Learn / Case Studies / Ryanair
How Ryanair uses Hotjar Surveys to measure satisfaction and report on trends
“The main stakeholders in our business want to keep track of product performance. We use Hotjar Surveys to see how satisfied our customers are with our products, and we report the larger trends.”


In any business, conversions ebb and flow for a variety of reasons, and it can be difficult to pinpoint the root cause. Are customers reacting to the changes you’ve made in your product? Are they responding to a new company policy? Or are they influenced by some external force beyond your control?
The only way to know why customers behave the way they do is to gather customer feedback—which is one of the ways Ryanair uses Hotjar.

How a leading discount airline gathers customer feedback that shapes their product strategy
Ryanair is a leading discount airline from Ireland. They receive a staggering 1.8 million visitors per day on their website—travelers looking for bargain flights (their flagship product) and hotel rooms (another important product for Ryanair).
Rui Pereira (Head of Research and Usability) and Anna Zajac (User Experience Researcher) use Hotjar Surveys to gather customer feedback and understand how customers interact with their products.
Specifically, they use Surveys to study the customer flow when customers (1) book flights, (2) check-in in for flights, and (3) book hotel rooms. They’re primarily interested in:
Ease of use
User satisfaction
Barriers to purchase
The main stakeholders in our business want to keep track of product performance. We use Hotjar Surveys to see how satisfied customers are with our products, and we report the larger trends.
How Ryanair uses Hotjar Surveys (in 3 steps)
Step #1: ask open-ended questions to identify user pain-points
When Ryanair first gathered feedback, they didn’t know what their customer pain-points were—so they asked open-ended questions, prompting customers to tell them how to improve their user experience.
They then exported all the open-ended responses to an Excel spreadsheet and went through every response to identify broad categories of complaints.
After gathering several months' worth of data, Ryanair had pretty much heard it all—any issue a customer could have with their key products had been logged. With this information, they were able to create multiple-choice questions that allowed unhappy customers to select their complaints from a list.
Step #2: ask closed-ended questions + study all the data
Armed with a set of multiple-choice questions, Ryanair began running closed-ended surveys for 20% of their visitors at key stages in the buyer’s journey. Keep in mind, they get 1.8 million visitors per day, so 20% provides more than enough data.
They ask 3-4 questions after flight booking and check-in, and they ask 4-5 questions to customers who book hotel rooms.
Here are the questions they ask visitors after they’ve just booked a flight:
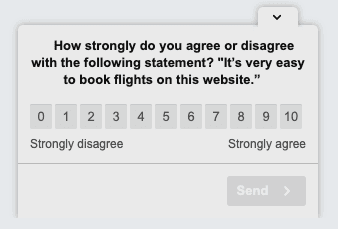
How strongly do you agree or disagree with the following statement (0-10):
"It’s very easy to book flights on this website.” (0=strongly disagree/ 10=strongly agree)
How strongly do you agree or disagree with the following statement (0-10):
"I was able to book my flight and purchase products without being interrupted."
Please rate how satisfied you were with the experience of using Ryanair today (0-10).
If the customer rates the experience poor (0-4), it triggers an additional question:
“Can you please tell us the main reason you gave that rating?
Note: question #4 allows respondents to select from a list of choices derived from results of the survey described in step #1.
The research and usability team then takes this information, crunches the numbers, and figures out which factors influenced each rating, including product issues (e.g., timed-out searches, policy changes) as well as external factors (e.g., weather delays).
Step #3: present the data to the stakeholders
Rui and Anna deal with mountains of data, so part of their job is simplifying the data and presenting it to key stakeholders to show the big picture. This allows the stakeholders to make data-driven decisions about product development and company policies.
With this in mind, the usability team compiles a report that averages monthly scores and lists key factors that played a role in negative ratings. They also provide historical data, for context, that shows average monthly variations in scores.
The value of Hotjar, for us, is that we can observe trends. We started doing this in May of 2018, and we were quickly able to observe trends in satisfaction. We can compare one month with another, and we find this useful.
Get started with Hotjar
Trusted by 1,148,546 organizations across 180+ countries. It’s free, forever.
No credit card required

No credit card required

56,549 users signed up last month

GDPR- & CCPA-ready
