Learn / Guides / Funnels guide
How to use funnel analysis to identify issues and boost conversions
Visitors flow through your website every day, but somehow all that traffic results in just a trickle of conversions, sales, and signups. Funnel analysis helps you spot where users leave your website, so you can optimize the customer journey and increase conversions.

This post explains how to do funnel analysis so you can identify key traffic sources, spot high-exit pages, and make impactful improvements. You’ll also learn how to combine funnel reports with additional analytics insights, enabling you to send more traffic down your funnels to the pages that matter.
Read on to learn more, or skip to what you need:
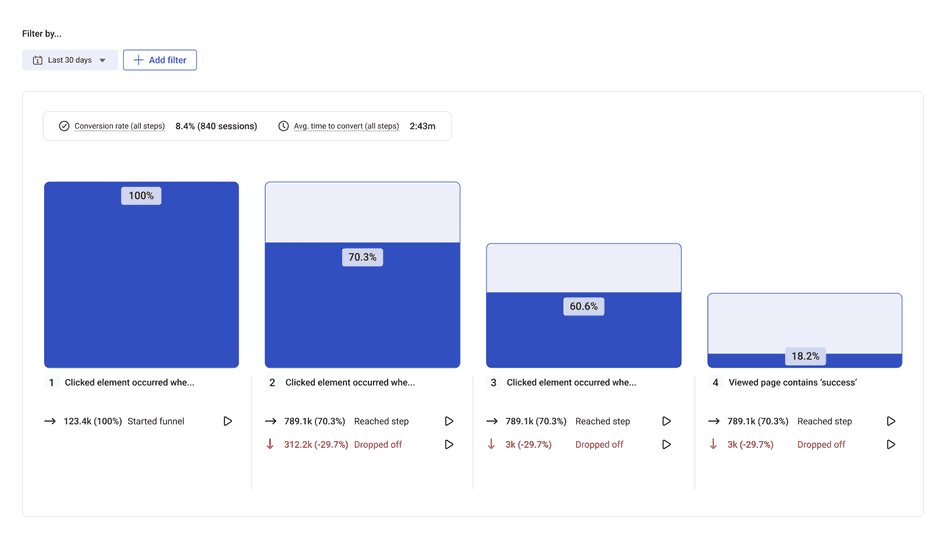
Analyze and optimize your funnels with Hotjar
Identify and remove conversion blockers in your funnels by seeing exactly where, when, and why users drop off.

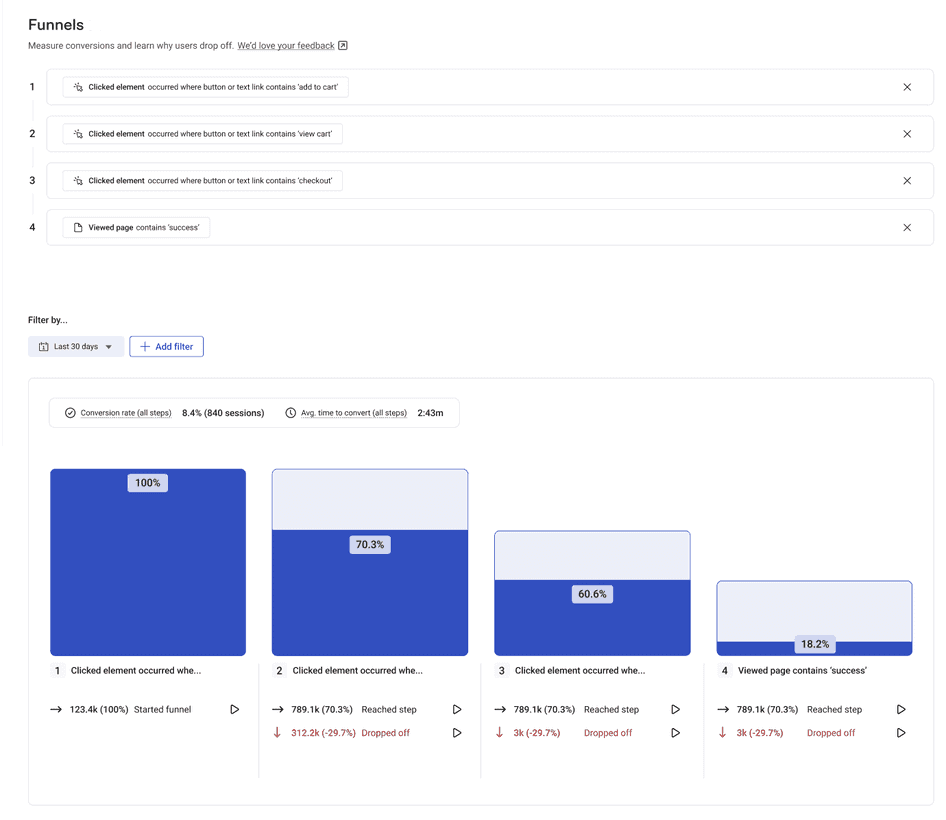
What is funnel analysis?
Funnel analysis is the process of mapping the flow of website visitors to a set of specific funnel steps that result in conversions or signups. Businesses use funnel analysis to trace the user journey throughout their website, optimize it, and see how many visitors end up in each stage of the funnel.
There are lots of different types of funnels—marketing funnels, sales funnels, click funnels, and more—but they all share some common traits: a 'funnel' gets its name because it narrows toward the end, so the volume of visitors at the top is larger than the volume of visitors at the bottom.
Funnels (also called conversion funnels or sales funnels) are widely used across various marketing and sales functions because they help identify barriers that cause users to leave before reaching a conversion point.
For example, many people might visit the homepage of an ecommerce website, but only a few will eventually go on to see a thank you page after purchase. In this example, a basic ecommerce funnel conversion path will look like this:
Homepage > category page > product page > cart > checkout > thank you page
Funnel analysis tracks user actions throughout the funnel and tells you how many visitors make it through each step, highlighting problems or areas for improvement in the customer journey with the goal of increasing conversion rates and revenue.
3 benefits of using funnel analysis on your website
It's often easy (and tempting) to work on too many parts of your site at once. Funnel analysis helps you understand what needs tackling and prioritize work on those steps first instead. Here’s how.
📈 Before you get started: to get the most out of your funnel analysis, first make sure your funnels are set up for success. Consider using a customer journey map to help you map out the ideal customer journey and inform the steps of your funnel. Check out our chapter on how to create funnels for more.
1. Find the high-traffic, high-exit pages where people are leaving
Funnel analysis tools visualize the drop-off rate and conversion rate of your main pages, helping you understand when and where visitors and potential customers are leaving your website.
Knowing where in the journey users drop off will help you focus your optimization efforts on the biggest opportunities. To lean on the funnel metaphor: finding where users leave helps you plug holes in your funnel and send more traffic through it.
We’ve identified steps in our funnel that were confusing to our customers and caused them to abandon our product. We can easily identify screens that make them get lost and hesitate on what to do next, so then we can fix UX issues and continuously improve. Every small improvement increases conversions around 10 to 20 percent, which is really significant.
2. Determine where high-quality visitors come from
Funnels are not only useful for finding issues that need fixing. They can also help you spot successes you can double down on—for example, by revealing where your high-converting traffic comes from.
Using funnel analysis tools like Hotjar (that’s us! 👋) or Google Analytics will help you do this. For example, with Hotjar Funnels, you can add up to five comparisons across any funnel view, so you can quickly and easily compare performance by traffic channels.
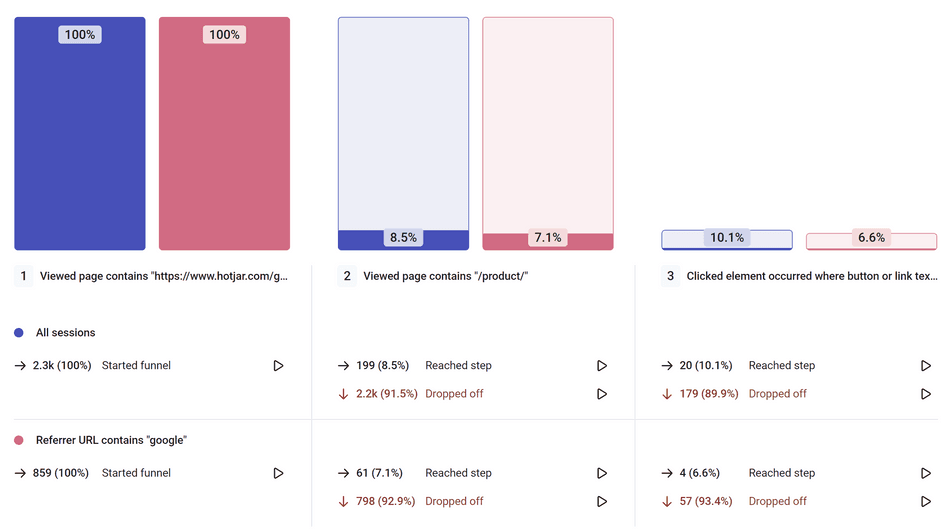
If you understand how visitors who convert reach your website, you can focus more on those acquisition channels and increase the likely conversions.
🔥 If you’re using Hotjar
They often say that comparison is the thief of joy—but not when it comes to funnel analysis. Using funnel comparisons in Hotjar gives you deeply helpful insights to optimize and tailor your funnel flows for different segments. Try comparing funnel views like:
A/B test variants, to see which version has the greatest impact on conversion rates
Marketing campaign performance by traffic channels, so you can see where your campaign is driving the greatest ROI
New users and returning users, so you can identify and nurture behaviors associated with conversion and loyalty
Devices, so you can spot any issues specific to desktop, mobile, or app
User attributes, such as location, to spot how different user cohorts progress through your funnel
Events, like ‘Saved to wishlist’, so you can see which actions and behaviors are linked with conversion or drop-off
3. Help team members and stakeholders make decisions
Funnels are a straightforward way to share where your online business is doing well and where there are opportunities for improvement.
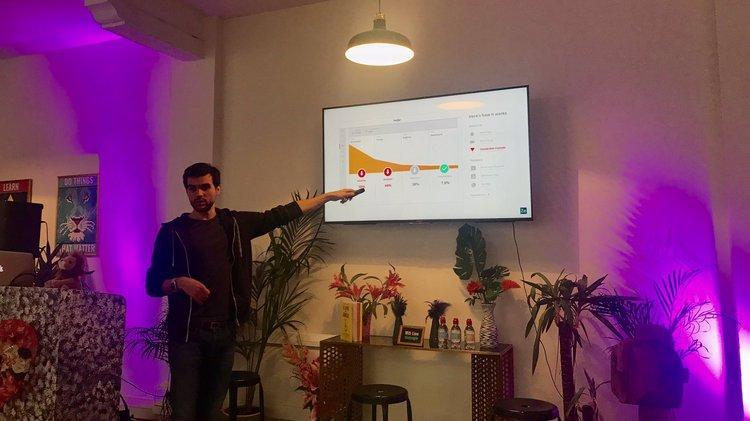
Jeremy Foucray from Zetoolbox presenting a funnel analysis (credit: Christophe Solier)
Funnel reports are an easy visual aid to use in presentations to stakeholders and team members alongside your metrics and KPIs, helping you get buy-in for future optimization work and showcase your successful projects. There’s nothing quite like seeing a big red ‘drop-off’ alert to inspire people to take action.
How to do funnel analysis
At this point, it goes without saying that conversion funnels give you a clearer understanding of the user behavior across your website—but you can supercharge the analysis by combining funnels with other complementary tools.
1. See what’s happening between events and pages
After identifying problematic high-exit pages and roadblocks in your conversion funnel, you can use product experience insights alongside your funnel analysis to get a more in-depth look at what users interact with right before they drop off. Two great ways to get this much-needed context? Heatmaps and session recordings.
Heatmaps
Heatmaps record and aggregate user clicks, mouse movements, and scrolls, allowing you to see which elements were clicked (or ignored) and how far down the page users scrolled.
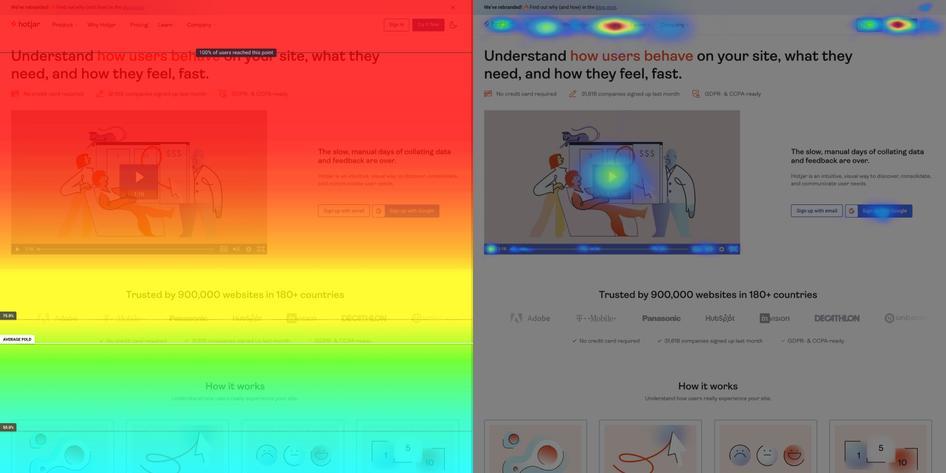
Placing a heatmap on your high-exit pages helps you spot problematic elements, such as broken links and unseen CTAs causing users to drop off.
Session recordings
Session recordings are renderings of individual user sessions on your website, and will help give more context to your heatmap insights.
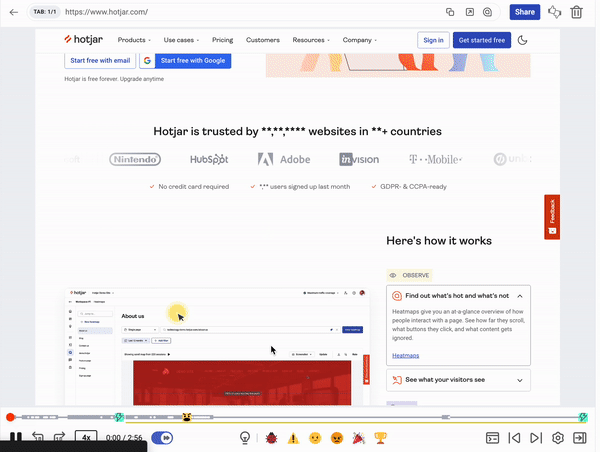
Focus on your high-exit pages and watch how people browse, scroll through content, and interact with buttons before they leave your website. Spotting any issues they encounter helps you empathize with their journey, and gives you the data needed to improve your UX design and guide visitors deeper into your site.
🔥 If you’re using Hotjar
Detected an unusually high drop-off rate in your Hotjar Funnels? Click on the button next to the number of users who dropped.
This allows you to watch recordings of these specific user sessions, so you can understand exactly what happened at each step—and see what really prevented them from converting.
2. Find out what’s going on by surveying visitors on the page
The additional analytics data from heatmaps and recordings will give you a few hypotheses for UX improvements and design changes. You can experiment with design changes through A/B testing at this stage (and use funnel comparisons to see how these improvements perform against your old flows), but there’s one key insight that’s still missing: feedback from your users.
Qualitative data from on-page surveys and feedback is an invaluable part of funnel analysis. Instead of making assumptions and guesses about why visitors bounce and don’t convert, you can simply talk to your users and let them tell you why.
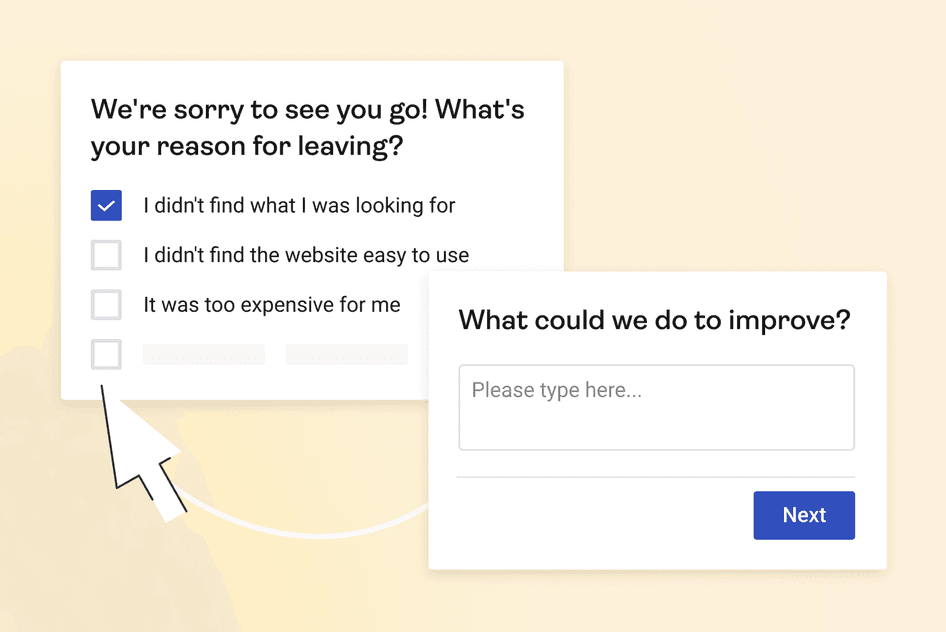
Again, starting with your high-exit pages, set up a website survey with a couple of key questions to learn more:
What’s missing from this page?
What’s stopping you from continuing?
What were you looking for?
How can we help?
Asking the right open-ended questions allows your visitors to tell you how they feel, in their own words, so you can empathize with their needs and provide a better website experience.
🤓 Read more: check out our guide on how to ask good survey questions to maximize conversions and find out why visitors leave your website.
Conversion funnel analysis example: a case study from CMS Connected
There are loads of examples of funnels that show how effective funnel analysis makes a major difference to your business’s bottom line. Here’s one funnel analysis example we love.
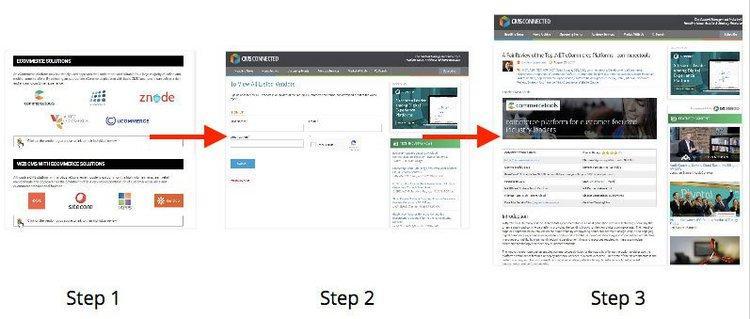
CMS Connected, an IT news and marketing company, used funnels to analyze the performance of a piece of gated content.
The funnel was set up as a simple three-step journey from a landing page (step one) to a sign-up form (step two) to a success page (step three). In order to see the content they were interested in, visitors needed to sign up on step two with their name and email address.
By analyzing the funnel, the team at CMS Connected identified a huge drop-off of around 82% between steps two and three. This meant that for every ten people making it to the page, more than eight left without interacting with the content.
As a result, the team removed step two from the funnel and made the content available to all visitors. This decision solved a problem and created a better experience for visitors, who could freely flow towards the page(s) they were interested in—but it also guaranteed that CMS Connected’s content was given a true chance to shine and help their readers.
Use funnel analysis to unlock more insights and improve conversions
By understanding how your funnels actually perform—and discovering how different flows compare to others—you can make data-driven, user-led improvements that result in real growth for your business.
Analyze and optimize your funnels with Hotjar
Identify and remove conversion blockers in your funnels by seeing exactly where, when, and why users drop off.