Learn / Guides / Funnels guide
How to create a sales funnel that converts in 5 steps
Sales funnels help you visualize the pages your customers visit, from a landing page to goal completion. They might not be the paths you expect (or even want) customers to follow, but tracking how they perform will help you understand where—and why—users drop off.
This guide shares a five-step method for building and monitoring your most important conversion funnels. Read on to discover how data from best-in-class tools like Google Analytics and Hotjar Funnels helps you optimize for improved user experience (UX) and conversions where it matters.
5 steps to creating an optimized sales funnel:
Find and fix your funnel leaks
Use Hotjar to see why users drop off, so you can win them back.

1. Map out your main paths to conversion
Every visitor who lands on your website and eventually converts will take their own unique path. But after a while, you’ll see recurring patterns and common checkpoints.
To map out your funnel, start from the end goal (e.g. an ecommerce order confirmation page) and work backward to find the most common paths and pages that get people there. Here are a few ways to do it:
Using Google Analytics 4 (GA4)
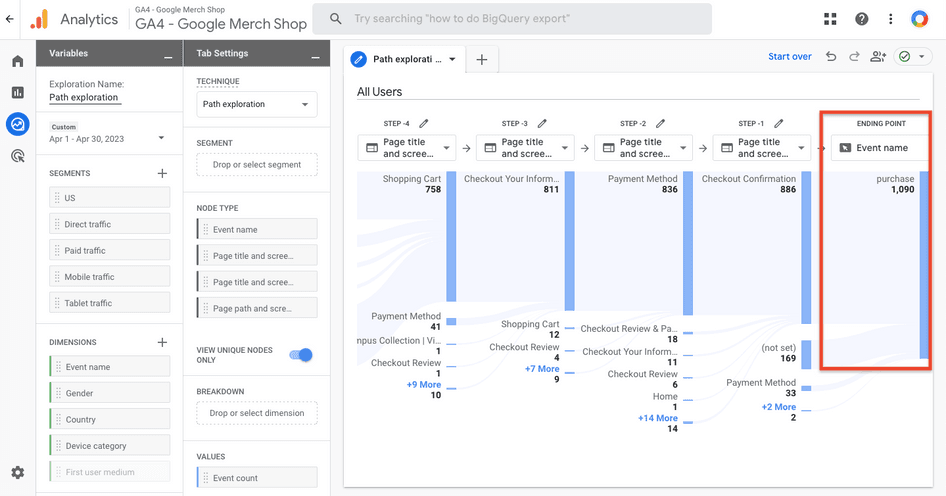
In GA4, go to Explore > Path exploration and click ‘Start over’ in the top right to remove the sample data. Select the ‘Ending point’ box to add an event or page representing your end goal. GA4 will then display the pages or steps that came immediately before:

Using Plausible
With a GA alternative like Plausible, filter by goal conversion (e.g. ‘sign-up’) and view the top entry pages that converting visitors landed on—these will be the pages at the top of your funnel:

Using Hotjar
In Hotjar, filter session recordings by a post-conversion exit page (like a ‘thank you’ page), clicked element (like a ‘Complete payment’ button), or event (like a purchase):
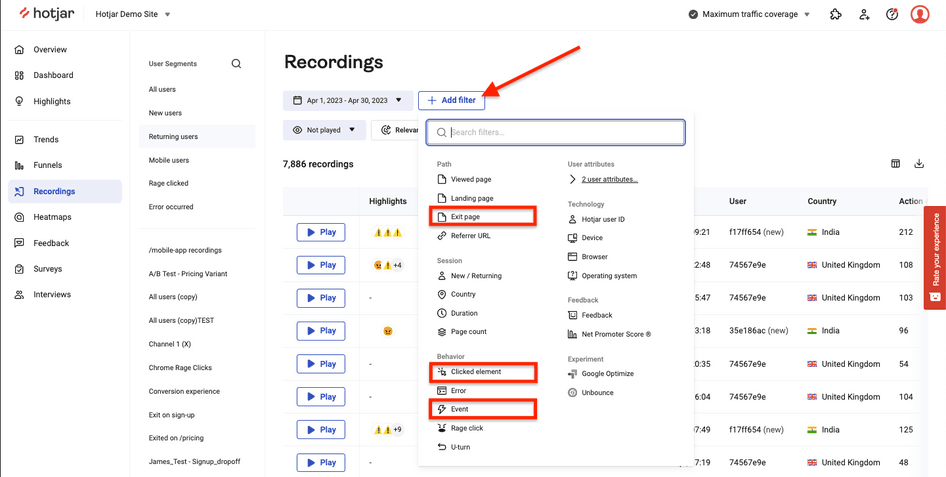
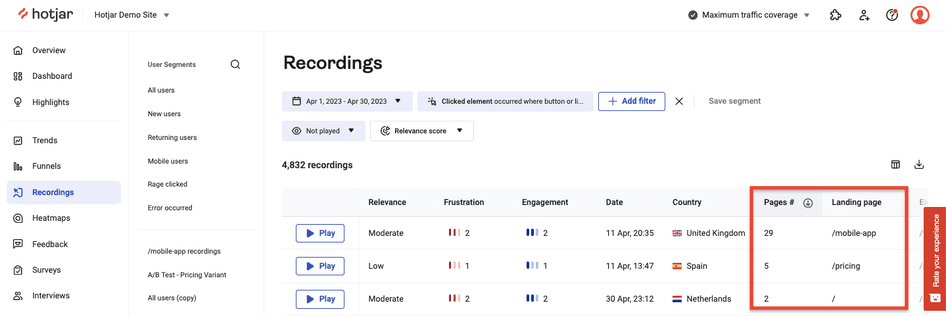
Hotjar will display all the data from these recordings in a list: look at the ‘Landing page’ column to identify the most common entry points at a glance, then watch multi-page recordings to review complete user journeys across your site.
2. Build your most valuable funnels
Now that you know the most common paths users take to complete a purchase, use a funnel tool like Hotjar Funnels to visualize them and:
Identify the high-traffic exit pages where you lose most visitors
Focus your conversion rate optimization (CRO) efforts on the biggest opportunities
Compare how different segments convert to identify your most valuable cohorts
In Hotjar, select the Funnels tool on the left sidebar and click ‘Add step’. Then, choose a page, clicked element, or event representing your first funnel step (e.g. a landing page).
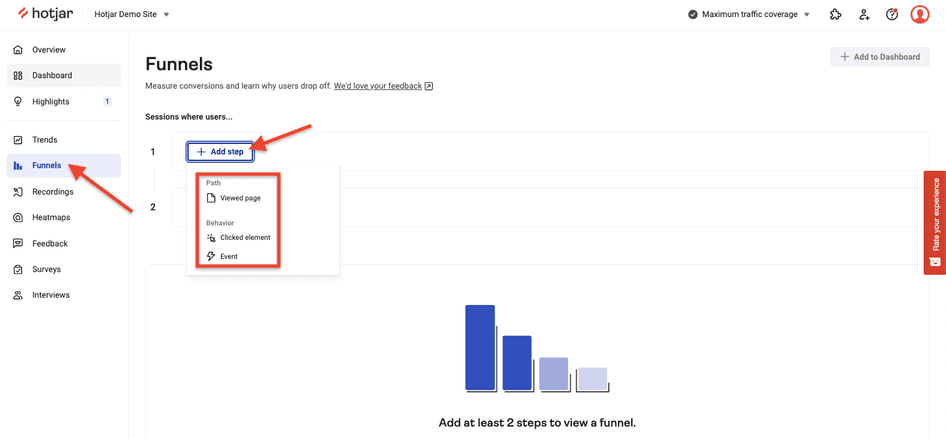
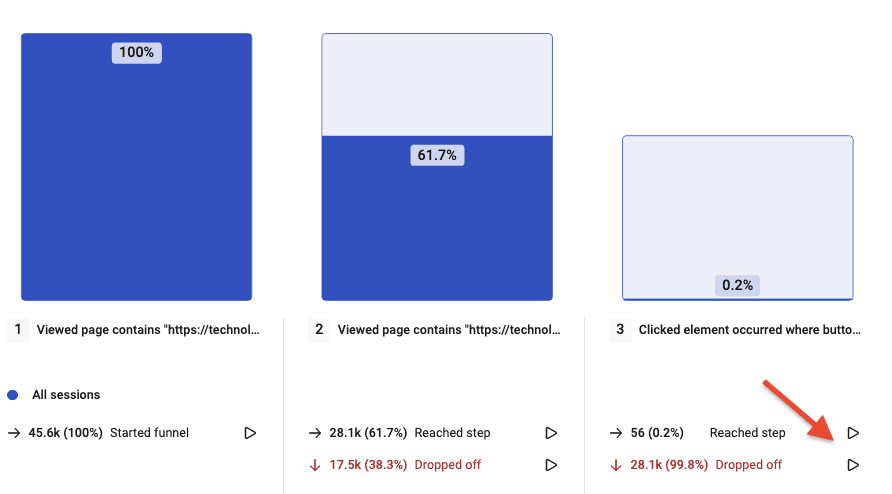
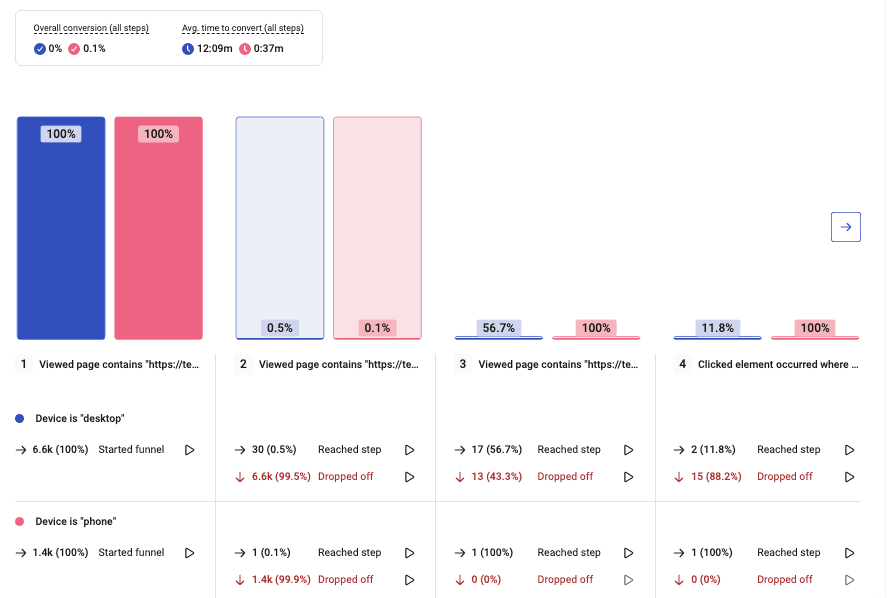
Repeat to add up to ten steps. Your funnel will look like this:
Compare up to five user segments to understand how different cohorts behave. For example, you can filter by:
Device, to view desktop vs. mobile conversions
Referrer URL, to compare the performance of organic search vs. social media traffic
Country, to see how traffic from different markets converts

3. Fix leaks to reduce drop-offs
We use Funnels to track conversions and then watch the recordings. It really helps us understand why users drop off.
Most sales funnels indicate where you’re losing conversions, but that data alone won’t help you improve conversion rates. Instead of guessing why people drop off, watch how they browse, see where they click, and ask them what they need.
If you’re using Hotjar Funnels, click the play icon to jump straight to a session recording playlist of:
Users who dropped off: what did they do before they left? Did they encounter any errors or rage-click in frustration?
Users who converted to the next step: did they spend time on the page? What elements did they interact with?

Use Hotjar Heatmaps to visualize a heatmap of the page(s) where you’re losing the most users to review clicks, scrolls, and mouse movement. You can filter to view heatmaps of users who did and didn’t reach the next stage of the funnel. For example, filter by:
Exit page, to view the actions of users who left without converting
Clicked element, to see the behavior of users who did or did not click a call-to-action button (CTA)
Event, to see browsing differences between users who made a purchase and those who didn’t

A move map showing mouse movement and clicks of users who did not click ‘get in touch now’
For example, the above mouse movement heatmap shows users who didn’t convert toggling between the monthly and yearly pricing plans, and clicking menu elements and the ‘contact us’ link. This suggests they needed more information before converting. Next steps could include:
Triggering an on-site survey to ask visitors what they’re missing
A/B testing changes to the page, like adding testimonials or changing the main CTA

Creating a follow-up survey in Hotjar Surveys to find out what information visitors need
💡Pro tip: if your funnel analysis reveals multiple drop-off points, fix the one closest to the end goal first. It’s like repairing a leaky bucket: the hole right at the bottom is the most pressing issue if you want to keep any water in.
4. Bring more traffic through the top of the funnel
Once your funnel is fixed, you’re ready to bring more people in. Instead of jumping straight to a shiny tactic that might not work for your user personas and most valuable customers (TikTok! Lead magnets! Email marketing!), go back to your analytics data and find your highest-performing traffic sources first.
Here are a couple of ways you could do this:
In GA4, go to Reports > Traffic acquisition and sort rows by revenue to see which channel drove the most sales:
In Hotjar Funnels, filter by referrer URL to compare the conversion performance of different traffic sources:
Once you know the best-performing traffic sources for your business, you can work on new marketing campaigns with confidence that you’re targeting a high-converting channel.
💡Pro tip: supplement your quantitative analytics data with insights from your target audience. For example, run surveys and interviews (both available via Hotjar) to develop a holistic understanding of the customer journey. The funnels you build are focused on your website, but you’ll want to know how and where people heard about you in the first place.
5. Monitor, optimize, and repeat
Creating a sales funnel is not a one-and-done activity: user behavior changes, website code breaks, and new products get added—so you need to keep a watchful eye on how traffic flows through your website.
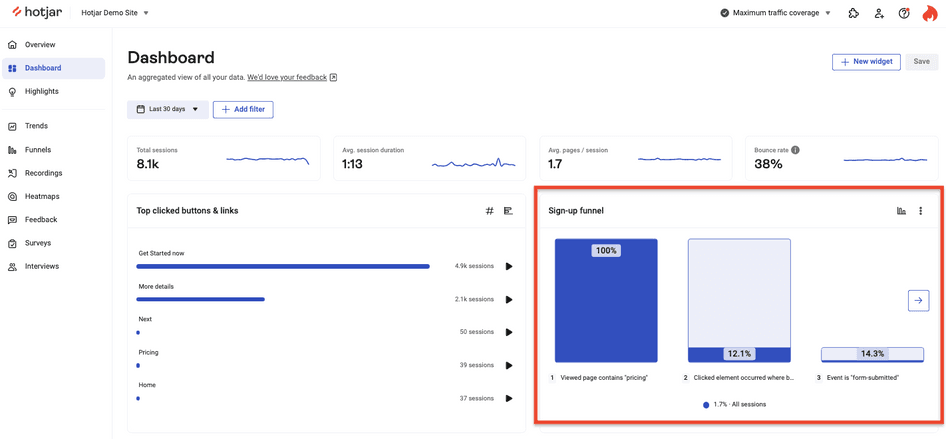
Use the Hotjar Dashboard to monitor your most important funnels. When you spot a drop in conversion rate, you’ll be in the right place to troubleshoot the issue before it becomes a bigger problem.
For example, audience intelligence platform Audiense used Hotjar Funnels to monitor their sales funnel. When the team noticed a sudden drop off on their sign-up page, they watched session recordings and quickly discovered that the password validator feature was broken. Thanks to this insight, they fixed the issue in a couple of hours, and conversions returned to normal.

We monitor our sales funnel to see where people abandon the sign-up page without converting. One day we noticed a huge drop in conversions. We discovered that the autocomplete feature was broken, so we fixed it, and conversions went back up immediately.
Create a funnel that shows you why users drop off
Funnels will show you where you’re losing users, but they won’t help you understand why. For a complete picture of what’s happening on your website, supplement your funnel data with recordings of how visitors navigate, heatmaps showing you where they click, and qualitative feedback about their pain points.
And if you create your funnels in Hotjar, you’re only one click away from all these insights. 😉
Find and fix your funnel leaks
Use Hotjar to see where and why users drop off, so you can win them back.