Learn / Blog / Article
How we optimized perceived performance to improve our KPIs: a Hotjar case study
No one likes to wait. Even at a nice restaurant, if the food takes too long to arrive, you’ll start wriggling on your chair and looking around for the waiter. Worst case, you might even leave.
This is nothing new: people are impatient by nature, and your users are no different. If you ask them to wait too long for their requested content, they’ll enjoy the experience less and eventually drop off.


Summary
Perceived performance is a subjective measure of website performance. It focuses on how fast a website seems to the user rather than technical metrics, and is crucial for user-centric optimization.
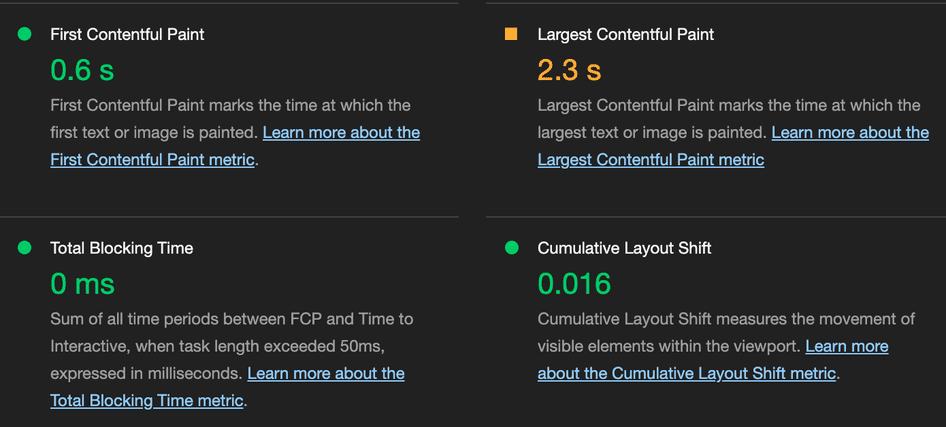
Google's Core Web Vitals help analyze and improve perceived performance. For example, Largest Contentful Paint (LCP) measures when the biggest visual part of a page appears, offering a user-centric view of loading performance.
Standard metrics like LCP aren’t always an accurate reflection of user needs. For instance, at Hotjar, our sign-up page's key metric is the time it takes for the ‘Sign up’ button to appear, which aligns with user intent.
Rather than artificially slowing down the user experience for A/B testing, you can correlate loading times with conversion rates for various user groups. This approach allows you to measure the real impact of performance on business KPIs and improve conversion rates.
Keep reading to see how we did it at Hotjar (and what our results looked like). 👇
It’s a fact that performance matters, and multiple studies have confirmed it. But less defined is the true impact of user experience on your business metrics. Without this understanding, you won’t know how much to invest in optimizing loading performance.
The good news is there’s a simple way to do this—and you probably already have all the tools you need.
What you should measure (and how)
First of all, what is ‘perceived performance’? According to MDN, it’s a ‘subjective measure of website performance’ and ‘how fast a website seems to the user’.
When we talk about perceived performance, we’re not concerned with the endpoint latency or the amount of server memory used by the backend service. Perceived performance metrics are, first and foremost, user-centric.
Examples of perceived performance metrics
The most popular examples are Web Vitals, proposed by Google. They aim to provide a unified way of measuring perceived performance across different websites.
Let’s look at specific metrics from that set: one of them is the Largest Contentful Paint or LCP. The measurement starts when the user requests the page to load, for example, by clicking a link. It ends when the biggest visual part of the page, such as an image or a block of text, appears on the screen.
The element that occupies the most space on the screen is considered the most important for visitors, so it’s a nice proxy metric for a website’s overall loading performance. It’s a universal approach that allows you to compare completely different web pages, from a newspaper article to an ecommerce checkout page.
When Web Vitals don’t work
In the world of SaaS products, we’re usually more focused on specific customer journeys and jobs to be done (JTBD). Often, it’s not the element taking the biggest space that provides the biggest value to our customers.
Consider the example of Hotjar’s sign-up page: people come here to use the registration form, although most of the screen area is filled with marketing copy and customer logos on the right-hand side.
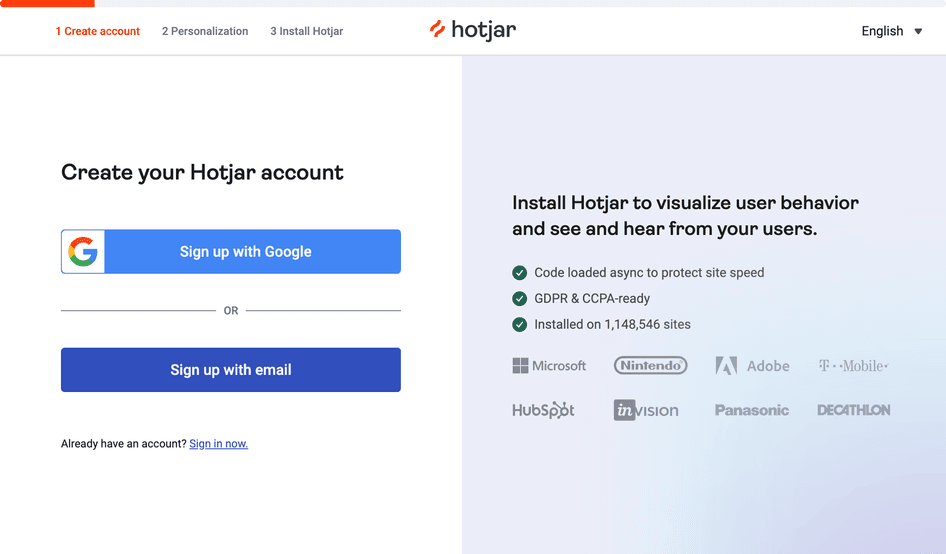
We recognized that, in this scenario, the Largest Contentful Paint isn’t the best metric to focus on. So, we defined our own ‘web vital’ focused on our users and this particular use case. We decided that for our sign-up page, the key perceived performance metric is the time it takes for the ‘Sign up’ buttons to appear on the screen.
Thankfully, existing tech makes it easy to collect this type of data. For example, the Element Timing API, available in Chromium-based browsers, allows the measurement of arbitrary HTML elements. Shims for other browsers exist, and it’s not difficult to figure out a custom solution that works with single-page applications written in popular front-end frameworks, too.
How to connect the dots
After deciding which page element is the most important for our users, we started collecting and visualizing this data from a sample of real user sessions (Real User Monitoring or RUM). This approach enabled us to measure for the first time how long it took for each page visitor to see the ‘Sign up’ buttons.
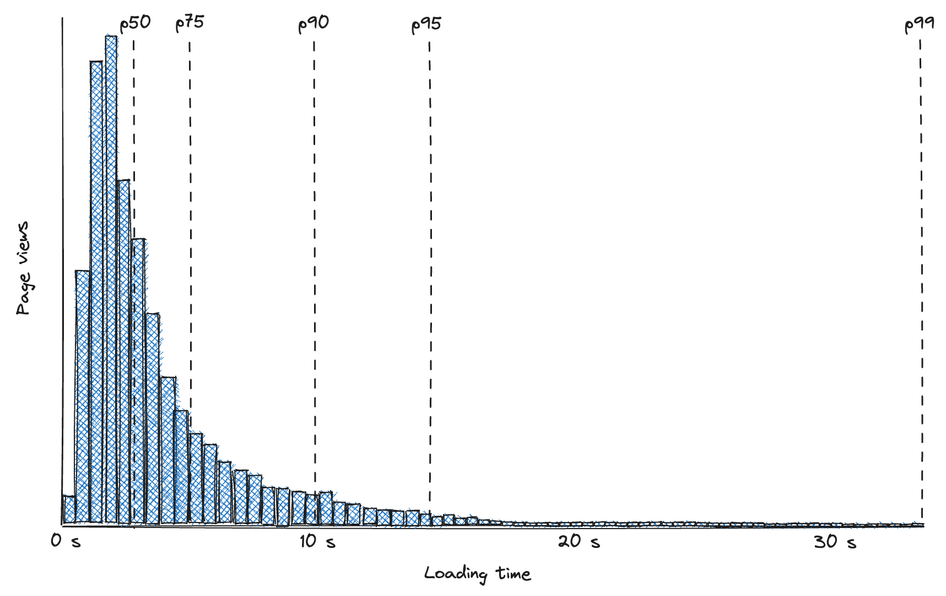
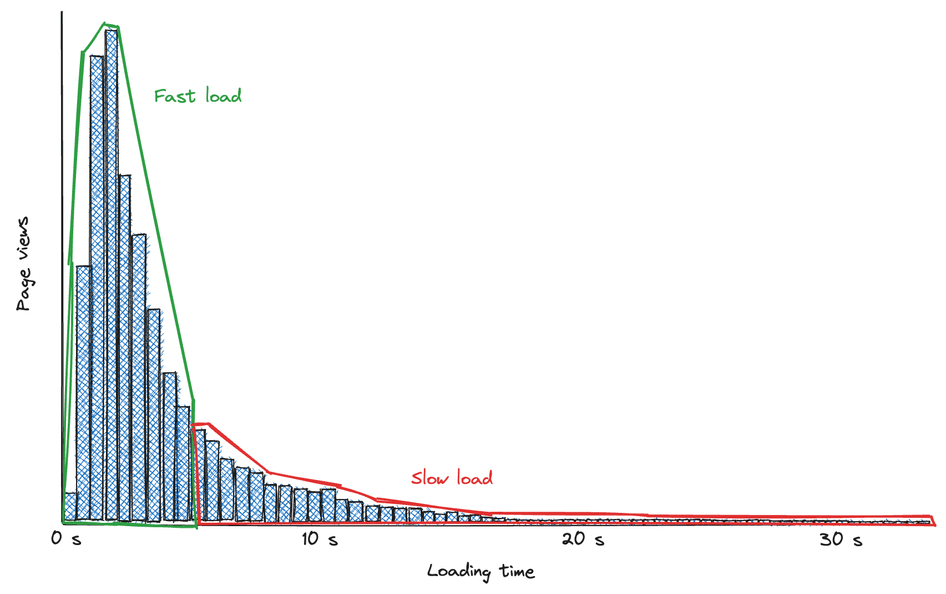
For example, the median (50th percentile) value was around 2.75 seconds, while the 75th percentile was around 5 seconds, as seen in the chart below.* This data was very informative, but it didn’t answer the question: how much should we invest in performance optimization to see positive business impact?
Option 1: slow it down and see what happens
We agreed that to understand the impact of potential changes, we need to somehow correlate our business KPIs—in this case, the conversion rate of the registration form—with the performance perceived by users.
One method we considered was an A/B test, where one group of visitors would get an artificially slowed-down experience while the other would be served as usual. By comparing conversions between these two groups, we could see the impact of the slowdown and, thus, the impact of potential speedup.
An experiment like this could give us the answer we want, but it would be against our core values. At Hotjar, we put our customers at the heart of everything we do, so purposefully making the experience worse for someone just didn’t seem right to us.
Option 2: divide and analyze
Instead, we looked at the distribution histogram and realized we already have users with better or worse experiences loading the sign-up page. There are plenty of visitors for whom the page loads quickly (the left part of the graph below), but also a significant number who have pretty long loading times (the long ‘tail’ on the right).
It’s not surprising if we consider that people who visit the Hotjar website from all over the world have different connection conditions and different device speeds. We could read the conversion data for different people separately and see if the loading time correlates with the business. In a way, we could treat existing website visitors as A/B testing groups.
We decided to follow this approach and started by lowering the resolution of our dataset significantly. While engineers and data analysts are comfortable talking about percentiles and distribution metrics, product owners speak a different language. It’s difficult to work with large amounts of data without referring to tricky statistical and mathematical concepts. We decided we could go with a simpler approach and still get data that we could trust while also making the communication between product and engineering easier.
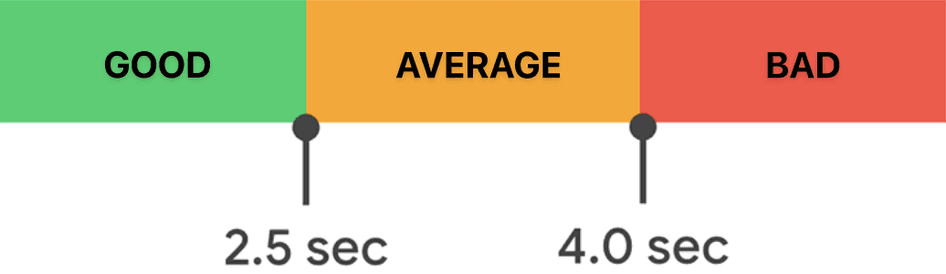
Instead of trying to make sense of the full histogram, we split all our users into three buckets—people with good, average, and bad loading experiences. We again followed Google recommendations about what most people consider a ‘good experience’. In the case of a web page like a sign-up page, it makes sense to use generic values, as the use case is pretty standard—we can assume that our potential customers are similar to average internet users. In this case
Every experience below 2.5 seconds is considered good
Every experience between 2.5 and 4 seconds is average (a.k.a. ‘needs improvement’)
Every experience above 4 seconds is bad (a.k.a. ‘poor’)
Business opportunity and optimization
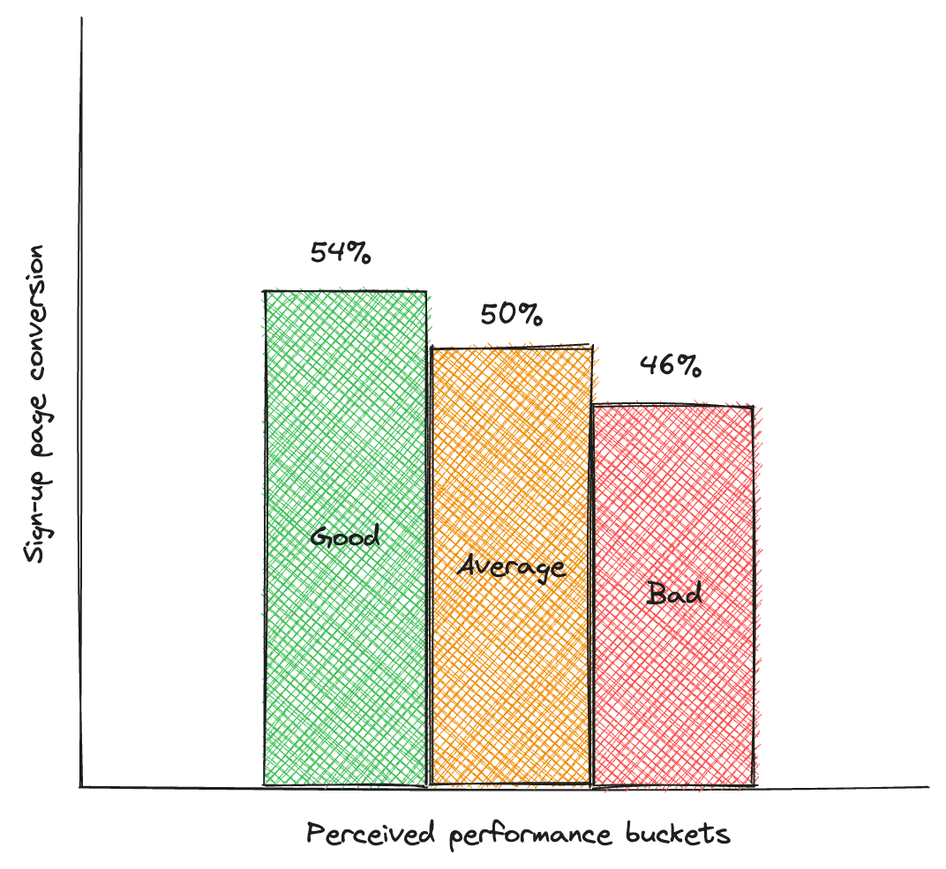
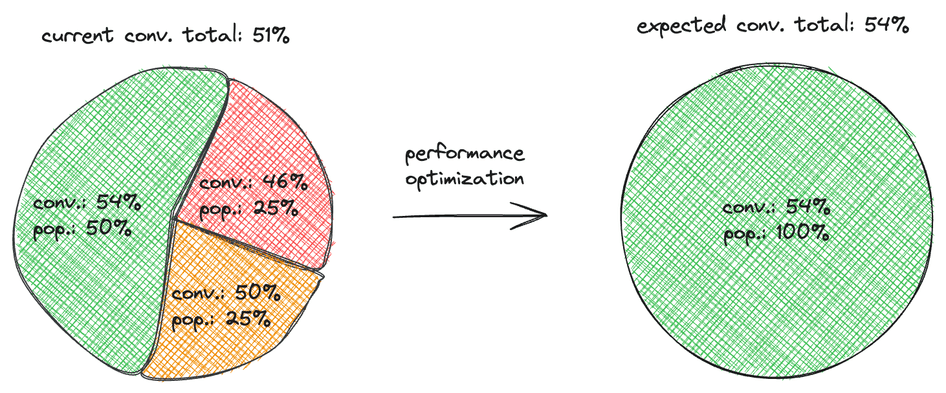
We read conversion data for each of these buckets, and found that people for whom the sign-up page loads faster—below 2.5 seconds—are much more likely to finalize account creation. The difference between the conversion of visitors with good and bad experiences was as high as 13%.
The KPI value in the average bucket was significantly lower, too. At the time, the number of people falling into good buckets vs. the average and bad buckets was pretty close to a 50/50 split.
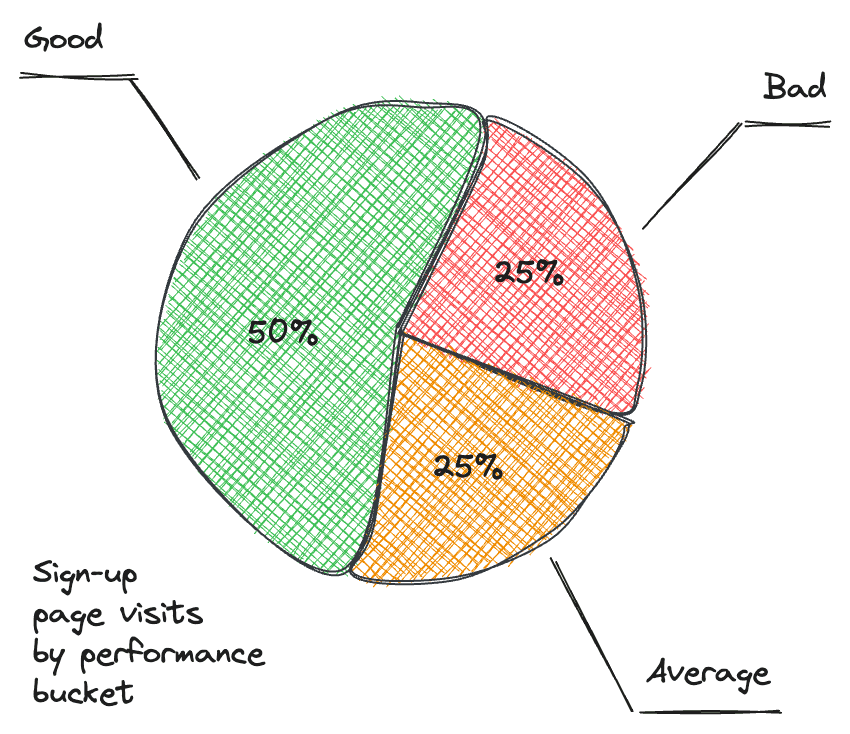
That was an amazing finding that flagged a business opportunity. We calculated that if we could improve the loading experience for all visitors having average and bad experiences enough to join the good bucket, we could improve our total conversion rate for the sign-up screen by as much as 6%! This was an upper boundary, of course. It’s practically impossible to provide every visitor with an excellent loading experience—we can only impact our system, not external conditions that affect the performance. We knew, though, that there was a lot of space for improvement in our current architecture, so it was worth trying.
We decided to validate our hypothesis before groundbreaking changes and dig deep into performance optimizations. There were a few low-hanging fruits that promised good results. If the business impact we anticipated based on bucketed data were true, we would immediately start seeing it after these basic optimizations.
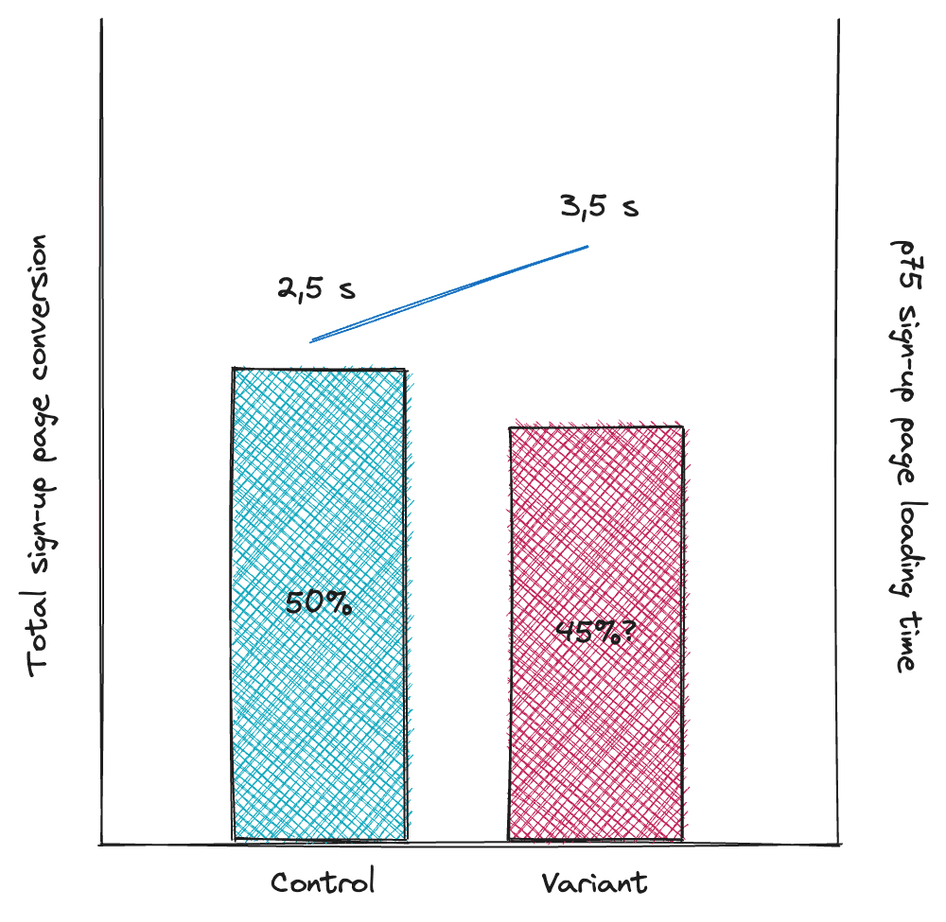
We followed the plan and improved the loading speed to the 75th percentile by almost 2.5 seconds. We released this change to 50% of the traffic as the A/B test. In the test group, the number of people with the good experience grew by 12 percentage points, while the bad experience bucket shrunk by 10. That was expected, but what happened to the conversion data?
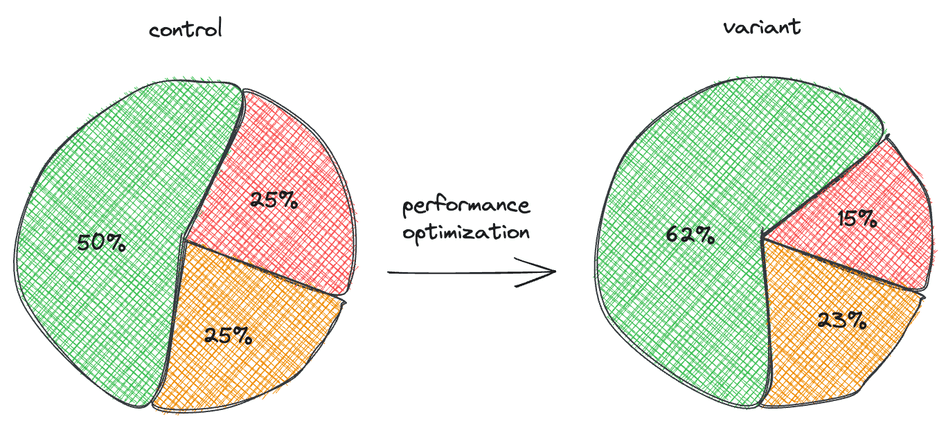
You may remember that the upper boundary for changes was 6% of the uplift of conversion. However, we didn’t move all the visitors to the good experience bucket, so we expected something significantly smaller.
After checking the data from the experiment, we realized that the total conversion rate of the sign-up screen between the test and control groups was different by as much as 5%.
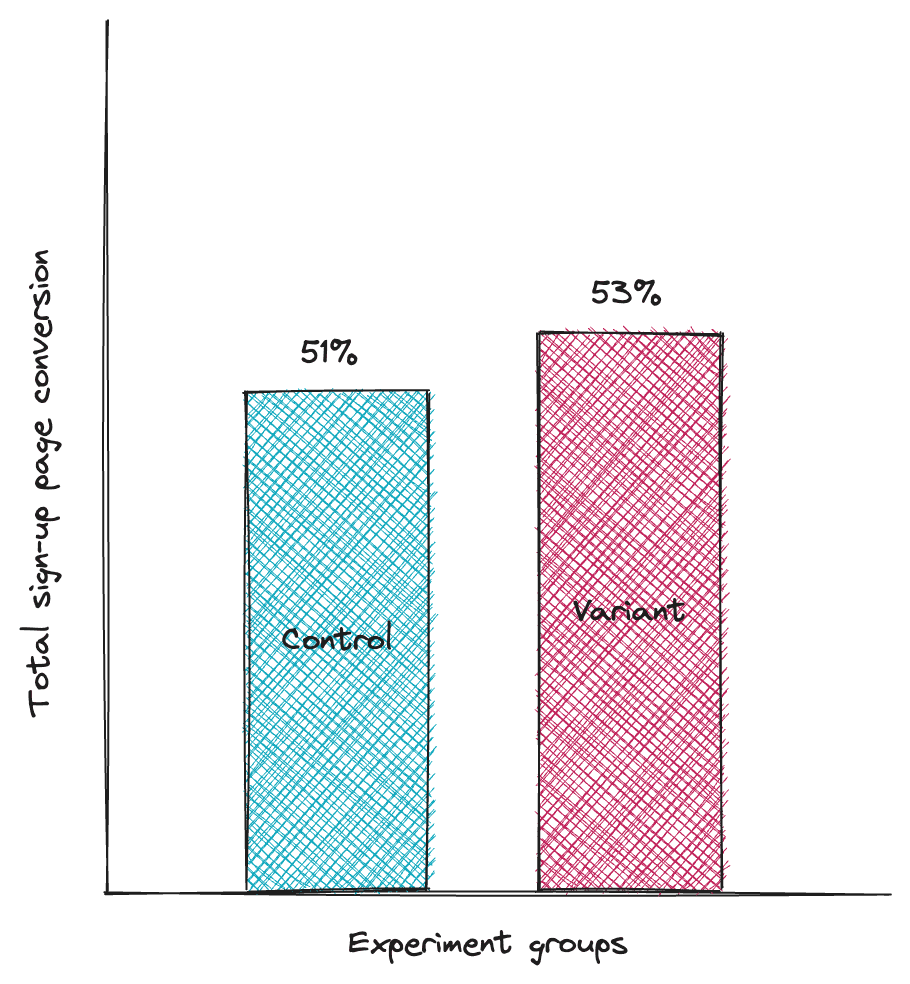
That was a big surprise but also a statistically significant difference. It led us to release our optimizations to 100% of visitors and plan future optimization work to improve our business KPI even more.
Measure perceived performance to improve your user experience
Measuring the perceived performance of your product and correlating it with business KPIs can help you find opportunities to improve your metrics. The data needed for this investigation is available in your data lake or can be collected quickly.
Once you identify focus areas, you can easily estimate the return on investment from performance optimization. The key to success is finding the right communication language between engineering and product. Improving speed bit by bit will bring you the value in small iterations.
Note: KPI improvements aren't the only benefit that observability can bring to your product. See more examples in a blog post written by my colleague, Clint.
Put your customers at the heart of everything
Heatmaps, Recordings, Feedback, Surveys, and Interviews give you everything you need to understand your users—and all five tools are available in the Hotjar suite for free.

Related articles

Hotjar's tech blog
Modernizing Hotjar’s architecture for a faster flow of value
In this article, we examine how we modernized Hotjar's architecture (note that Hotjar was acquired by Contentsquare in 2021) to deliver value faster to our customers. We start by explaining why we needed to modernize it and which principles guided us throughout the journey. Our aim is to provide insights into how these changes helped us improve and adapt in a rapidly evolving market.

Pavel Krayzel

Hotjar's tech blog
The power and pitfalls of regular expressions
‘Put our customers at the heart of everything’ is Hotjar's foremost core value. In line with this principle, our top priorities are protecting and being consistently available to our users. Regular expressions, or regex, are commonly employed to safeguard web services against harmful inputs. But they can also (somewhat ironically) become a source of vulnerability if not meticulously constructed.

Miloslav Pavelka

Hotjar's tech blog
Observability for product teams: what, why, who, and how
Observability is not a new concept in the software industry, but it still amazes me how many different interpretations I hear about this term. In many cases, observability ownership appears ambiguous, and it's also common to see it treated as an afterthought.

Clint Calleja