Learn / Guides / Web analytics guide
Web analytics: everything you need to know to improve your site’s UX
How do you know what people do when they visit your website, so you can make decisions to improve their experience and achieve your business goals?
Do you feel like you're missing out on valuable insights and opportunities because you don't understand your website user metrics and data?
Web analytics may seem confusing at first, but when you grasp the basics it becomes an invaluable resource to improve the user experience (UX), drive more conversions, and increase revenue.

This guide is an introduction to web analytics—what it is and why it’s important, including examples of metrics to track and what tools you need. You’ll also learn how to combine web and behavior analytics to get a complete picture of what users do on your site—and why.
Learn what’s really happening on your website
Combine Hotjar’s behavior analytics with web analytics data to learn how users interact with your site, so you can improve it and increase conversions.

What is web analytics?
Web analytics is the process of tracking and understanding how people use your website. Its ultimate goal is to help you understand your users with data so you can optimize your site's performance and improve UX.
You collect and analyze user data using web analytics tools to track what happens on your site and answer important questions, including:
How many people visit your site?
Where do they come from?
Which pages do they visit?
How long do visitors spend on your most important pages?
How many leave after visiting a single page?
These insights help you ensure your site is user-friendly and that it truly resonates with your target audience, so you can create delight.
The true purpose of analytics is to help you make good decisions. If you have an idea, you can use data to check the concept. Is it likely to affect a lot of visitors? Just a few? And once you make the changes, you can use data to see how well it worked. Did it make an impact? Was there a measurable change?
Top 4 reasons web analytics is important for your business
Web analytics is great for website optimization, helping you track what’s happening on your site and identify areas for improvement in terms of content and the overall user experience.
When done right, web analytics helps you increase traffic, conversions, and return on investment (ROI). Let’s take a look at how:
1. Learn who your website attracts and where they come from
Knowing who visits your website and where they come from helps you better understand different user personas. Web analytics helps you understand more about user demographics, goals, and behavior, so you can tailor your website's content and product offerings to their specific needs.
You also identify which channels drive the most traffic and conversions to your website and how to improve their performance.
2. Understand how users interact with your website
Knowing how users navigate your website, like what pages they visit and how long they spend on each page helps you understand what they're looking for and what they value. This web analytics data lets you give users what they need to perform a desired action on your site.
It also helps you create content strategies and campaigns that resonate with your audience.
3. Identify the pages that drive the most traffic on your website
Knowing what pages drive the most traffic on your website helps you understand users' preferences, so you can make informed decisions about your website and marketing efforts.
Then, you can use these learnings to improve your content strategy, conversion rate, and user engagement.
4. See how many users your website converts
Website analytics also helps with conversion rate optimization—increasing the percentage of visitors who become subscribers or paying customers.
Knowing your conversion rate lets you determine how effectively your website's content drives visitors to take desired actions, whether that’s sales or leads. By monitoring your conversion rate, you see where users drop off in the marketing funnel, which helps you make changes to improve the user experience and increase conversion.
For example, say a SaaS (software-as-a-service) company wants to increase the number of users signing up for its software. They can see how many visitors sign up for a free trial or purchase a subscription by using web analytics to track the conversion rate and how many users drop off. The SaaS company can then make changes such as simplifying the sign-up process or providing more information about the tool to increase its customer base and revenue.
Now that we know how web analytics benefits you, let’s go over three types of web analytics metrics you should track.
3 types of web analytics metrics to track
As we explain above, traditional web analytics help you understand who visits your website and how they interact with its content. You can use tools like Google Analytics, Mixpanel, Matomo, and Adobe Analytics to get this data.
Each of these software tracks metrics that are similar. However, because Google Analytics (GA) is the most commonly used tool, we’ll use it to help you understand critical web analytics metrics you should track.
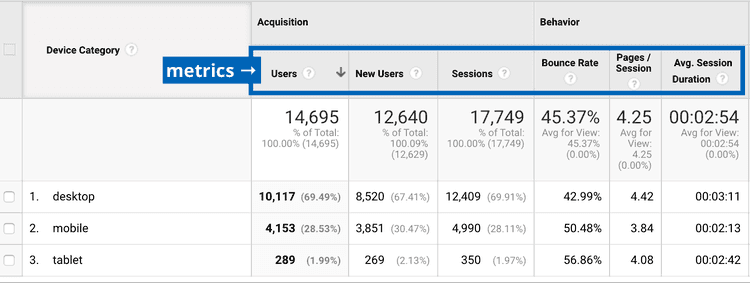
1. Acquisition-related metrics
Acquisition-related metrics measure how you get website visitors—you understand who your visitors are and how they landed on your website.
These metrics include:
Users: visitors who initiated at least one session during a selected date range. This metric helps you measure your audience size and determine if you're reaching the right people.
New users: the number of unique visitors in a specific date range. This metric helps you determine if you are attracting new traffic—people visiting your site for the first time.
Sessions: all user interactions within a specified time frame. This metric helps you understand what users do when they’re on your website.
2. Behavior-related metrics
Behavior-related metrics measure how people behave when they land on your website. They help you understand user behavior patterns, such as your most popular pages, how long users stay on a page, and what actions they take on the site.
These metrics include:
Bounce rate: tracks activity when a user visits a website page and then leaves without making another request. For example, if a user finds one of your blog posts through a search and reads it without clicking on any internal links or interacting in any other meaningful way before leaving, they 'bounced'.
Exit rate: how often a user has left your website from a single page. When you know which pages visitors are exiting the most and at what percentage (i.e. the exit rate), you can determine which pages you need to improve.
Pages per session: the average number of pages users view on your website during a session. This metric lets you determine how engaged visitors are on your website. For example, a high value shows that visitors actively explore and discover helpful information on your website.
Session duration: the average time a user spends on a website in a single session. A long session duration may indicate that visitors find the website's content relevant and engaging, while a short session may indicate that the website fails to meet their needs or expectations.
3. Conversion-related metrics
Conversion-related metrics measure how many people take a desired action after landing on your website, revealing how many users convert and how much revenue you get.
These metrics include:
Ecommerce conversion rate: the percentage of visitors who complete a purchase on the site. This metric helps you see how effectively your website converts visitors into paying customers.
Transactions: this metric provides insights into the number of customer purchases, the average value of the transactions, and the total revenue you generate from sales.
Revenue: the amount of money you generate from the transactions on your website. This metric tracks the return on investment for your marketing campaigns and advertising efforts.
To show how a website performs, web analytics tools track quantitative data—every page view, bounce, drop-off, conversion, traffic source, and country of origin. However, while web analytics show you what's going on with your website, it doesn't tell you why.
Combine web analytics with behavior analytics and product experience insights software to get a complete picture of what users and customers want from your pages and products, where they get confused, and where they focus their attention.
With web analytics, you see a clean set of events, like: someone visited the homepage → clicked on a button → visited a pricing page, and you get information such as how much time they spent on a page. The problem is: what happened in between those things? And what happened when they got there?
Maybe the time on the page is high because many people are scrolling down, and they’re lost and can’t find something. Maybe they got to the page by mistake, and now they’re stuck. Looking at what happens between those events is where it becomes really interesting. That's where you get the juicy stuff.
3 ways to pair web analytics with behavior analytics
Let’s say GA reveals that you have a page that gets a lot of traffic but has few conversions.
You know you need to change something on your website, but how do you make sense of this data? How do you know what to do next? Sure, you can make educated guesses about the problem, but you could be wrong and miss out on many revenue-generating opportunities.
Combining quantitative and qualitative data gives you a holistic picture of your UX so you can make changes that improve the experience. That’s where behavior analytics comes in.
Behavior analytics platforms—such as Hotjar (that’s us👋)—help you understand what users want, care about, and struggle with and answers questions like:
What are users interested in, and what are they completely ignoring? What do visitors think as they scroll down each page?
Are they leaving because something on the page is broken?
Where do they get stuck and struggle on your website or app?
What actions do users take just before leaving your website or app?
What do users want or miss on the pages they visit?
Together with web analytics, these answers give you a full picture of what’s really happening on your website. Here are three ways to pair the two:
1. Use heatmaps to identify page elements that influence conversions
Heatmaps are a powerful tool to understand what users do on individual pages on your website, allowing you to visualize and understand complex data at a glance.
Insights from heatmaps help you identify which buttons and CTAs receive the most and least interactions and whether or not users scroll to the bottom of the page, so you can increase the likelihood of people using the site more often, staying longer on your most important pages, and making purchases.
For example, Taskworld, a project management solution, after tracking web analytics, wanted to know why more users weren’t completing the sign-up process and identify areas for improvement, so they created a heatmap.
The heatmap revealed that users weren’t clicking on the main sign-up CTA and got distracted by other elements. After Taskworld resolved the issue, its conversion rate increased by 40%, and drop-offs decreased by 4.5%.
2. Use session recordings to see your website through users' eyes
Session recordings capture and replay the user’s journey across your website to observe how people move around, what they click on or ignore while browsing, and whether they encounter any issues or obstacles along the way.
Every time I make a significant change on my site, I jump into Recordings. Numbers might reveal if something has gone wrong, but Recordings will tell me why.
Pro tip: filtering your session recordings helps you see real actions users took while on your most and least popular web pages. For example, you can review the recordings of customers who left your website in frustration or those who took a series of specific actions around your website.
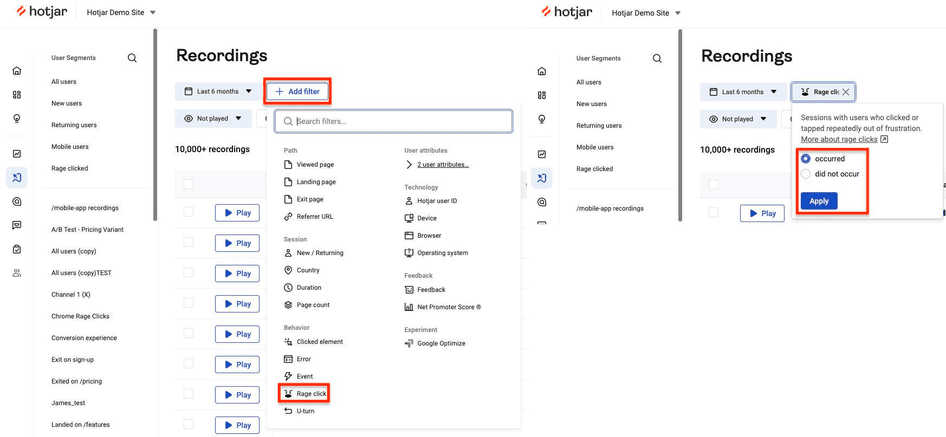
Hotjar Session Recording filters
3. Collect feedback to improve conversion data
Collecting feedback—whether it’s through interviews, an on-page widget, or surveys—eliminates guesswork and provides you with key insights from your users. You can inquire directly with them about which aspects of your site they enjoy and which they would like to see improved.
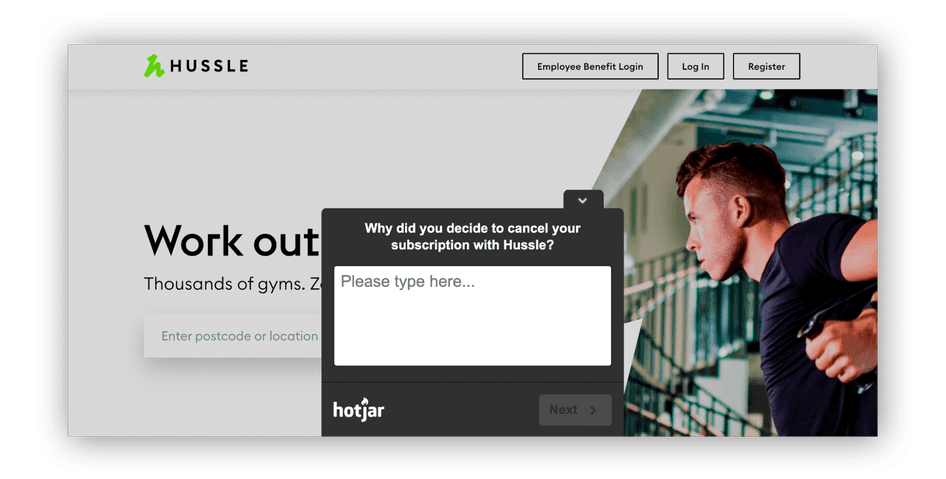
For example, Luke, a Product Lead at Hussle, used Hotjar Surveys to interview and gather insights from over 1,000 churning users immediately after they canceled their subscriptions.
Each response helped Luke identify common reasons users canceled, including small bugs or bigger user or product experience problems his team could fix.
Pro tip: use an exit pop-up survey to learn why people are leaving.
Placing an exit-intent survey on relevant pages lets you learn more about why visitors are leaving your site. Simply looking at your pages with the highest exit rates from web analytics tools will help you find the perfect page to trigger an exit poll.
With this data, you can use Hotjar to display a survey on the page you chose and even target users based on their device.
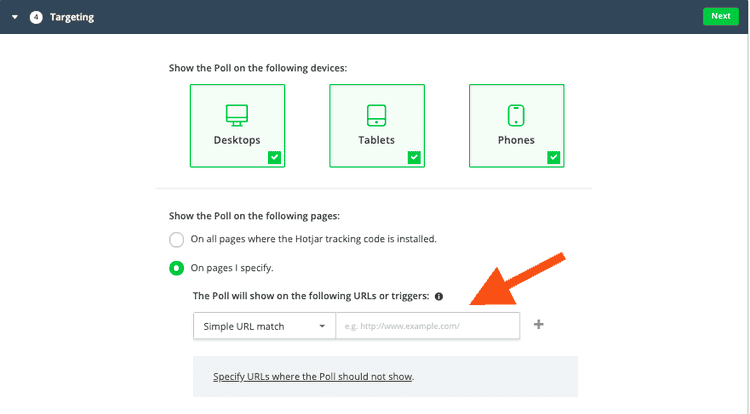
Hotjar poll targeting by page and device
Combine ‘web’ and ‘behavior’ analytics to watch conversions soar
Web analytics is great for understanding what’s happening on your website. However, numbers alone aren’t enough—they don’t give you the complete picture of the user’s experience—whether they’re frustrated or truly satisfied.
That’s why you need to use behavior analytics tools like heatmaps, session recordings, and surveys. Combining these tools with insights from a web analytics tool helps you identify bugs, broken elements, and potential blockers, so you can optimize your user’s experience and make their journey as smooth as possible.
Learn what’s really happening on your website
Combine Hotjar’s PX insights with web analytics data to learn how users interact with your site so you can improve it and increase conversions.