Learn / Guides / Intro to Trends
How to use Hotjar Trends to track metrics and understand why they change
With mountains of website and product data at your fingertips, it can be difficult to narrow your focus on the key patterns and insights that truly make an impact.
That’s why we created Hotjar Trends, our metric visualization tool: to help you stay on top of the metrics that matter, and never get lost in the data. Trends allows you to zoom out at any time for a macro understanding of your website’s performance, and zoom in on individual user actions and feedback to find the deeper reasons behind shifts in clicks, conversions, and sentiment.
Summary
This guide shows you how to use Hotjar Trends to identify and understand business-critical patterns in user behavior, so you can balance a big-picture overview with key user insights.
Use it to
How Hotjar Trends helps you zoom in and out
At its core, Hotjar Trends is a tool that lets you build unlimited custom data visualizations. You can add filters, Events, and User Attributes to track almost any behavior, compare different user segments, and measure performance over time. The point is: it’s a powerful tool that lets you do a lot.
It’s precisely because of all these applications that it can be tricky to know where to start or how to take full advantage of its functionality. We recommend an approach that alternates between different actions:
🕵️♀️ Zoom out to check patterns in performance, spot problems, and discover growth opportunities
🔎 Zoom in to see individual user actions and feedback, troubleshoot specific issues, and see what’s causing metric changes
👯♂️ And, repeat!
Big-picture overview, one-click insights
Create custom charts, monitor progress, and zoom in to find out what’s moving your metrics.

Zoom out: using Hotjar Trends to visualize performance
Hotjar Trends is designed to chart any combination of user behaviors, from feedback ratings to add-to-cart clicks, for any audience segment. This capability allows you to
Zoom out to understand if an issue you’ve found in a session recording or piece of negative feedback is an anomaly or a trend that needs investigating
Build custom trend widgets and monitor them in Hotjar Dashboards
We’ll show you how to do both in a moment (click here to fast-forward to our step-by-step instructions), but first: here are four ways to use Trends for a big-picture overview that quickly reveals if specific issues are part of a widespread pattern affecting your metrics.
1. Evaluate the frequency or severity of errors and bugs
You’re watching a recording of a user engaging with a new feature and see them encounter a JavaScript error. Is this something multiple users are experiencing? Use Hotjar Trends to zoom out and
Visualize how often the error occurs for all users
See if there has been a spike in errors since the new feature was released
Measure how the error affects your core metrics or ideal customer profile (ICP) to evaluate the impact and reach of the bug
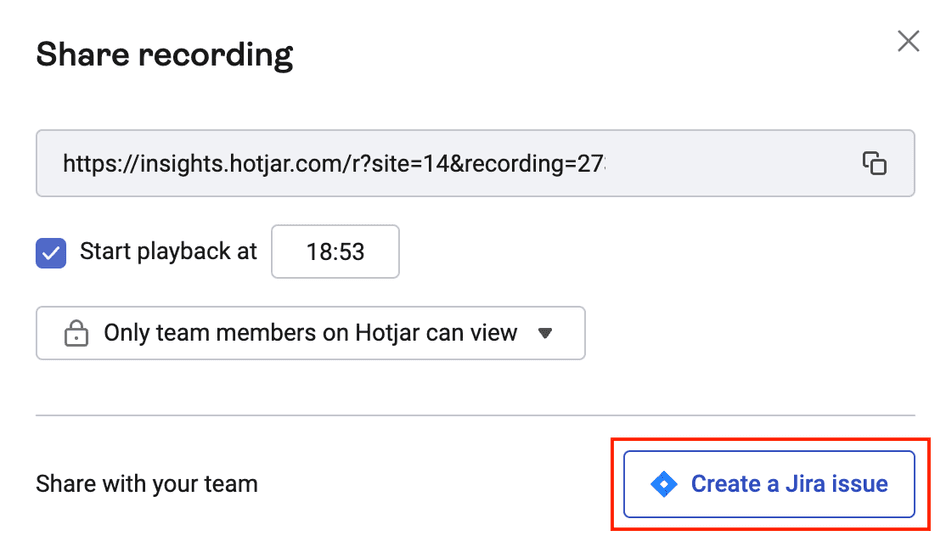
If you see that the error is causing a problem for many users or priority segments, click to create a Jira issue (or Linear issue, Trello card, or Asana task using Hotjar’s integrations) from the original recording for a developer to investigate.
2. Understand what causes user frustration
You’re viewing a heatmap of a key page and notice several rage clicks—rapid, frustration-induced clicks or taps—on a business-critical CTA.
You’re almost certain those rage clicks weren’t there before, so you use Hotjar Trends to zoom out and
Visualize CTA rage clicks over time
See if rage clicks are indeed spiking—and, if so, when the new trend began
Find out if any recent changes may have caused this change in user behavior
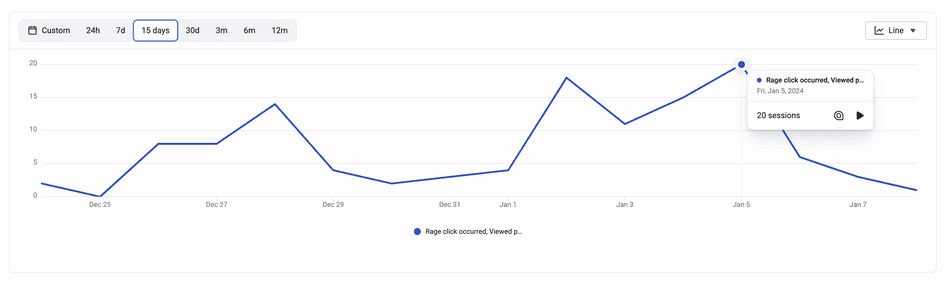
If you spot something unusual, share the trend chart with your dev team or design agency to troubleshoot what may have caused it.
3. Find conversion blockers
You want to improve mobile conversions. You review Hotjar session recordings and see a user stumble and bounce when going through the sign-up flow. Use Hotjar Trends to zoom out and
Visualize bounce rate for mobile users on the sign-up page
Chart mobile conversions over time
Click through to view a heatmap to see if there are widespread usability issues that need fixing
Monitor user sentiment from visitors who left feedback on the page
Speaking of which...
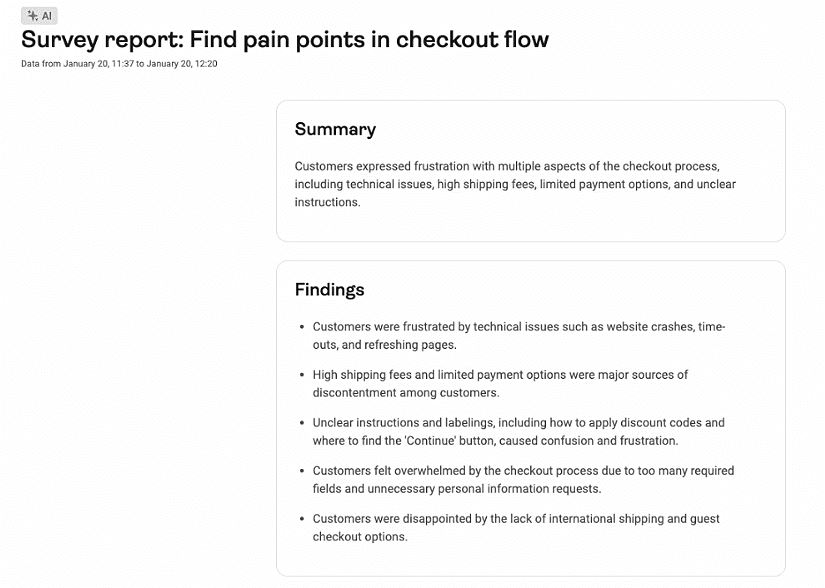
4. Investigate qualitative feedback
You’re reviewing checkout survey results in Hotjar’s AI-generated survey report. The summary reveals that customers expressed frustrations with multiple aspects of the process. Use Hotjar Trends to zoom out and
Visualize checkout page errors over time
View the most common errors occurring on the checkout page
Chart how often checkout rage clicks and u-turns occur
💭 Did you know? You can quickly zoom out to Trends from other Hotjar tools. If you’re viewing a session recording, heatmap, or other insight in Hotjar, click the ‘View trend’ icon to jump straight to the relevant metric in Hotjar Trends for more context.
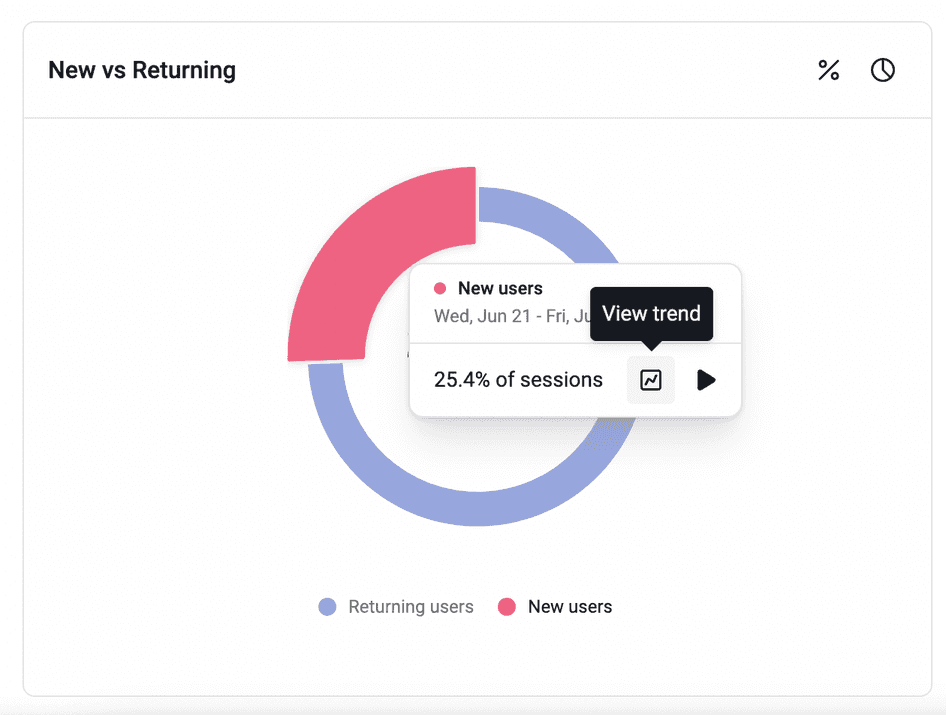
Click the ‘View trend’ icon to zoom out to Hotjar Trends from other tools—like a widget in your Dashboards
How to add custom widgets in Hotjar Trends
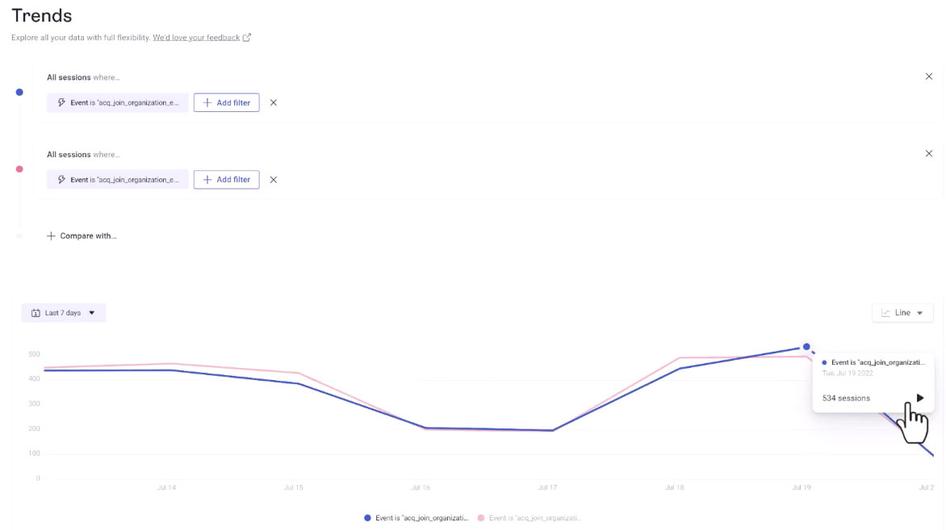
You can also create custom trends from scratch and monitor them in Dashboards. To do this, navigate to Trends in the left sidebar.
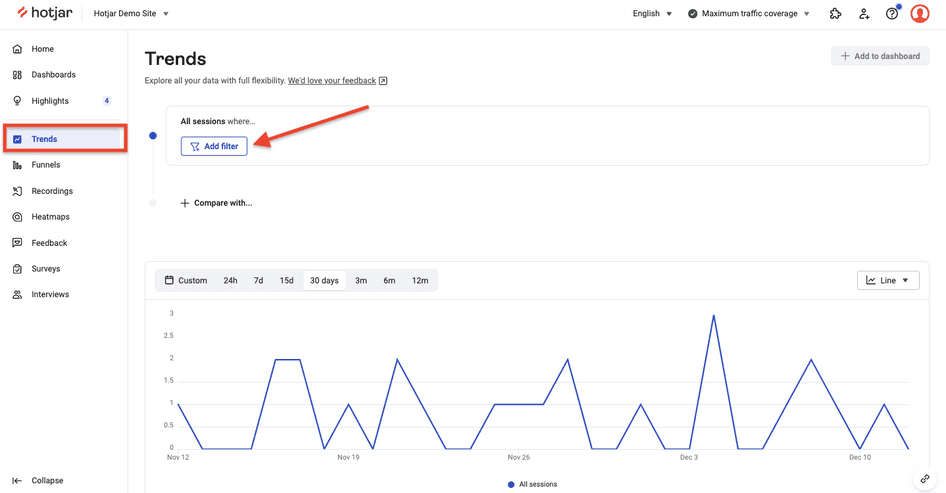
Click ‘Add filter’ and select a session filter. You can filter by
Path: including viewed page, exit page, referral source, and UTM
Session: including new/returning users, country, duration, and page count
Behavior: like clicked element, entered text, rage click, error, or event
User Attributes: custom attributes sent through our Identify API, e.g. on_trial, user_id or total_purchases
Technology: including device, screen resolution, and browser
Feedback: response sentiment from Hotjar Surveys and Feedback and Net Promoter Score® results
Experiment: inclusion in an Unbounce or AB Tasty experiment
Add unlimited filters to each chart to represent the specific segments or behaviors that matter to your business.
For example, to track the number of visitors who rage clicked and then exited on a checkout page, add a filter for ‘Exit page’ and choose your checkout page, then add a filter for ‘Rage click’ = occurred.
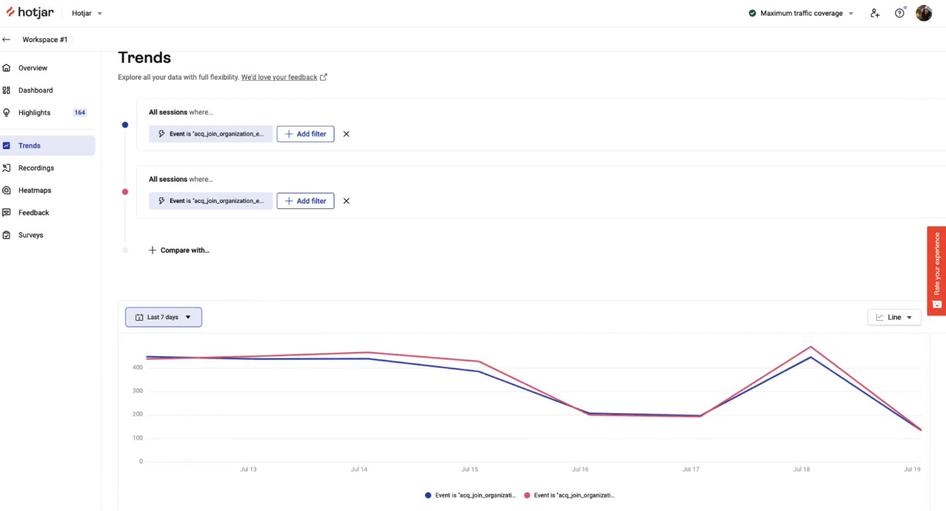
You can also add up to five comparisons to view performance between multiple segments, for example, to compare successful sign-ups between users that visited from organic search vs. paid campaigns. Click ‘Compare with’ and create a filter in the same way as before: each segment will show as a different color on your chart—drag and drop to rearrange them as you like.
To view charts for any period, select a date range. You’ll see the chart displayed as you add filters and comparisons. Click the dropdown to toggle between visualizations, including line, pie, and bar charts.
Zoom in: using Hotjar Trends to improve metrics
In addition to helping you zoom out to see the bigger picture, Hotjar Trends and Dashboards also make it easy to do the exact opposite: zoom in on the individual behaviors behind a metric change to understand why it’s happening, so you can work on the right fix.
We use Trends to track conversions and then watch the recordings when they’re down. It helps us understand what’s wrong.
Here are some ways to use Hotjar Trends to click straight through to the relevant user insights affecting your metrics.
1. Understand what’s causing dips or spikes
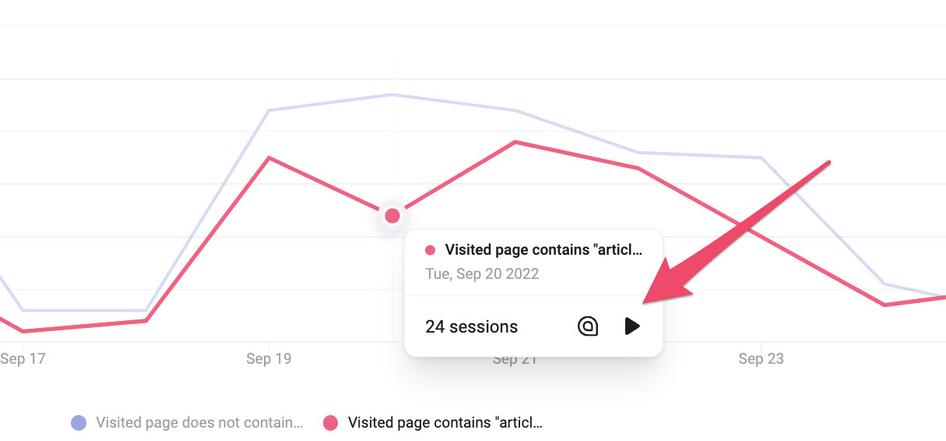
When you use Trends to visualize a metric, hover over any dip or spike and click to understand user behavior with session recordings and heatmaps or, where relevant, review related feedback responses.
You can do this for almost any trend you spot. For example:
If you notice a spike in errors on an important landing page, click to view individual recordings of the error as it displays for real users, and share them with your dev team to help them understand what’s wrong and prioritize fixes
If you see a dip in conversions for mobile visitors, click to view a heatmap of non-converting mobile users—check if they find your CTAs, or rage-click in frustration
2. Learn why A/B test variants win
Use Hotjar Trends to monitor conversions for different A/B test variants—do this via one of our integrations or by setting up custom user actions as dedicated Events.
If you see an increase in conversions on an A/B test variant, click to view recordings of converting users’ behaviors on the successful variant to deduce which elements helped them convert. That way, you have tangible (and shareable) data to inform future optimizations, instead of trying to replicate winning designs without understanding what contributed to their success.
Use Hotjar Trends to zoom out to the big picture and in to key insights
Your website, audience, and business are made up of many tiny moving parts. Hotjar Trends connects the big-picture overview of what’s happening—the patterns and trends—with the individual qualitative insights that explain why. Use it to zoom out and in (and out and in again!) to understand why things work, fix what’s broken, get buy-in for improvements, and build better experiences for your customers.
Find the ‘why’ behind your metrics
Use Hotjar Trends to track custom metrics over time, then click to zoom in on the user behavior insights that explain them.