Wissenswertes / Leitfäden / Leitfaden zum Customer Journey Mapping (CJM)
Die 10 besten Customer Journey Mapping-Tools für das Wachstum Ihres Unternehmens
Jetzt wissen Sie, wie wichtig es ist, eine Customer Journey Map zu erstellen - Sie haben Ihr Warum festgelegt und vielleicht sogar mit dem Wie begonnen.

Customer journey mapping tools are your vehicle to building a data-driven customer journey map (CJM). In this chapter, we’ll walk you through three categories of tools, and how to choose the right tool(s) for your business to improve your workflow.
What are customer journey mapping tools?
Customer journey mapping tools—also known as user journey mapping tools— are digital tools that collect and present quantitative and qualitative data about how users interact with your product or website so you can better understand your buyer persona.
They tell you where your visitors came from (in the world or on the web), how they behave on your website, and gather feedback directly from users.
The more complicated the customer journey, the more data you need to map it out. The right mix of customer journey mapping (CJM) tools can give you data from multiple customer touchpoints and channels.
3 types of customer journey mapping software to create a better user experience
Customers will interact differently with your site or app depending on what part of the journey they’re in. Since the journey map includes everything from awareness—when they saw your ad on Facebook, for example—to onboarding and using your product, the data you rely on to guide your map will vary at each stage.
Here are three types of CJM tools that will give you the data you need:
3 website and behavior analytics tools for customer journey mapping
Analytics tools give you insight into who your customers are and how they behave on your website.
Traditional website analytics tools give you quantitative data around traffic and demographic metrics like bounces and bounce rate, new and returning users, and goal conversion rates.
Behavior analytics tools give you qualitative insight into how users actually experience your website, and how they behave during their customer journey. You can find out where they spend time on individual pages, what buttons they click (or don’t click), and pinpoint where they exit from the funnel.
While traditional analytics tools tell you about the customer’s journey to your website, behavior analytics tools show where their attention goes after they’ve arrived.
Both types of analytics tools—quantitative and qualitative—work together to help you identify usability issues in your customer journey and highlight customer experience improvement opportunities.
Here are three popular analytics tools used by marketing and UX professionals:
1. Hotjar
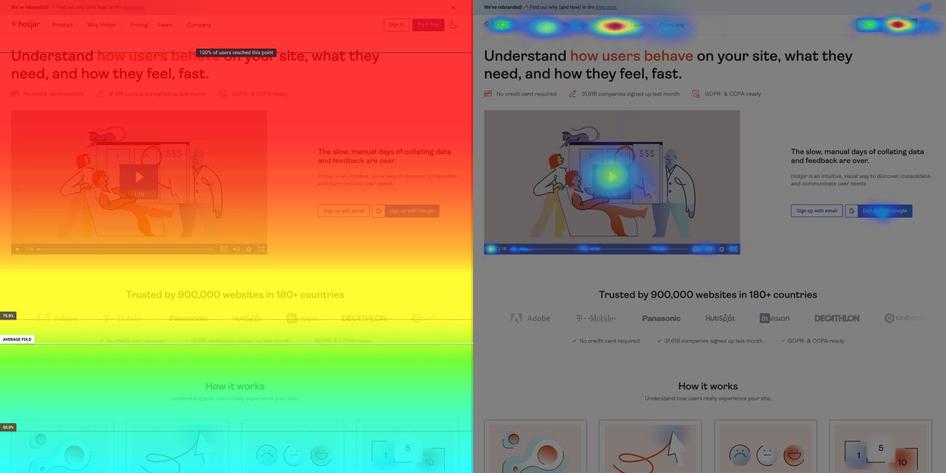
What it is: to put it simply, Hotjar (hi there! 👋) helps you gain insights into customer behavior. Tools like heatmaps, session recordings, surveys, and our Feedback widget give you data and feedback about how users experience your site throughout their journey.
How it’s used: Heatmaps and Session Recordings show you how users behave—where they click and scroll, where they get stuck, and the actions they take as they navigate from page to page.
Insights from Hotjar will help you prioritize how you build and fix your website to provide a better customer journey, which can ultimately help you increase conversions and improve customer satisfaction.
When to use it: Hotjar complements tools like Google Analytics, providing more understanding into customer engagement and behavior on your website.
Entdecken Sie, wie die Besucher Ihre Website erleben
Verwenden Sie Hotjar, um Daten und Einblicke in die Customer Journey zu sammeln, damit Sie die richtigen Änderungen zur richtigen Zeit für Ihre Besucher vornehmen können.

2. Google Analytics
What it is: traffic analytics tool from Google
How it’s used: Google Analytics (GA) tracks and measures website traffic metrics, like bounce and exit rates, goal conversions, sources of traffic, and user demographics.
When to use it: most website owners use Google Analytics—there are other analytics tools out there, but GA is the golden standard.
GA tells you how much traffic your website gets, where it comes from, and helps you understand which channels convert best. You can also see what your most popular landing pages are, and where people are exiting from your website.
Pro-Tipp: Traditionelle Analyse- und Verhaltensanalysetools funktionieren am besten im Team. 🤜🤛 Die Kombination von Hotjar und Google Analytics hilft Ihnen, ein vollständigeres Bild der Reise Ihrer Kunden durch Ihre Website zu zeichnen.
3. Heap
What it is: a no-code product analytics tool
How it’s used: Heap gives you customer data on how people use your product, tracking every stage of the customer journey.
When to use it: when you’re looking for journey pain points in your product, and need data that’ll help you make decisions around increasing retention and reducing customer churn. Heap helps you understand which customer segment your users come from, and gives you more granular insight into the customer journey.
The 4 best tools to visualize your customer journey
A customer journey map is a visual representation of how customers interact with and experience your website, products, or business across multiple touchpoints. Classic customer journey mapping tools are the flowchart builders: the digital versions of your sticky notes, only these can be saved in the cloud, shared with your team, and turned into a remote-work-friendly collaborative experience.
Once you’ve collected data about your users from analytics tools, Customer Success and Sales teams, and anyone else who interacts with your users, you’ll have enough information to map out the user journey.
When you have the flowchart mapped out, it’ll be easier to:
Identify all customer touchpoints
Find opportunities to build customer loyalty
Visualize which touchpoints belong to each part of the funnel
See which pathways can be simplified
Create clearer CTAs and paths for navigating to the next step
Here are four tools to create visual and intuitive maps:
1. Miro
What it is: an online whiteboard
How it’s used: Miro is particularly great for remote teams that want to put their thoughts onto a shared, digital whiteboard. The software lets you create a board from scratch—so you can still use your sticky note strategy, just digitally—or use one of their pre-made templates.
When to use it: you can use Hotjar heatmaps together with Miro to bring the heatmaps and analytics to life. This helps ensure you and your team are making data-driven decisions. Use it the same way as you’d use a whiteboard, for wireframing, diagramming, or planning your roadmap.
2. UXPressia
What it is: a customer journey maps for the design-conscious
How it’s used: UXPressia’s main functionality is to create customer journey maps. If you need a little more than a whiteboard, UXPressia helps you create consistently good-looking CJMs for your customer personas. It’s intuitive and beautiful, for those who want to build maps that impress. You can easily see the customer touchpoints and customize the maps to your own brand.
When to use it: when you need a clean design and a tool that lets multiple stakeholders across different departments contribute data. Very useful for when you need real-time collaboration capabilities. UXPressia is also a good option if you're looking for a customer journey map template to help you get started.
3. Smaply
What it is: a mapping tool for the complex customer journey
How it’s used: Smaply is a great tool for understanding channel usage and backstage processes. It lets you create a repository of customer insights, including images, PDF files, and even audio files to link all together and get a full overview of the customer journey. Plus, it integrates with project management tools like Jira.
When to use it: when you have a complex customer journey and you want to keep everything in one, easy-to-navigate place.
4. Gliffy
What it is: a simple online diagramming solution
How it’s used: Gliffy is a collaborative tool that lets you draw out very large diagrams. You can drag and drop shapes from their library and give feedback, and it integrates with Google Drive. It stores past versions and tracks changes, so you can always go back, and it’s fast and easy to use.
When to use it: when you don’t need a fancy customer journey mapping tool, but something simple but versatile to get your ideas ‘on paper’.
3 voice of the customer tools for user feedback
Voice of the customer (VoC) tools help you understand your customers' needs and capture what they're really feeling and thinking about your business or product, in their own words. Getting all of this together helps you get raw, authentic feedback about how they perceive you at every stage of the journey.
Here are three customer feedback tools to help you understand your users:
1. Hotjar
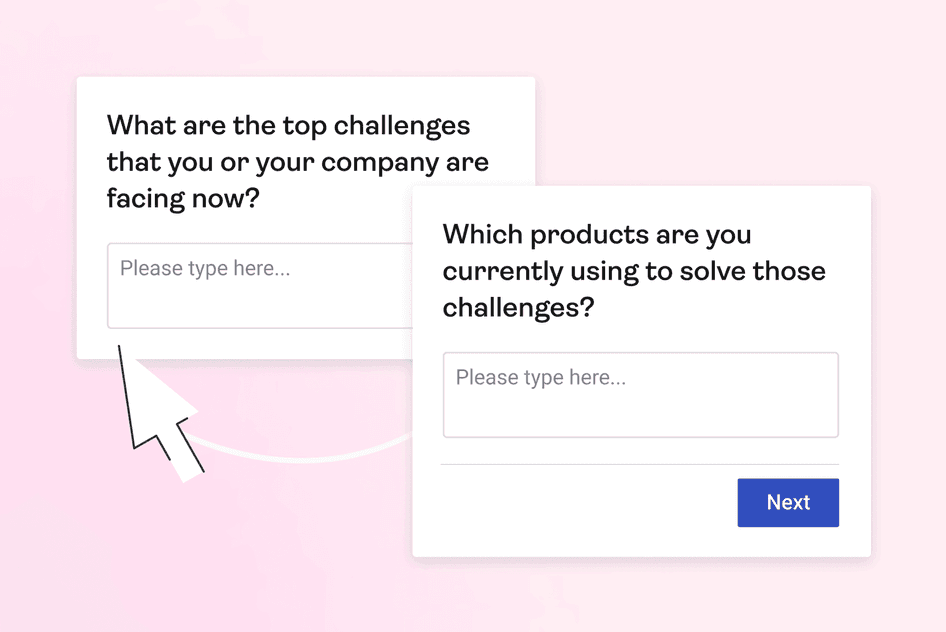
What it is: Hotjar (hello again! 👋) gives you insights into customer behavior with analytics and feedback tools like heatmaps, session recordings, surveys, and a visual feedback widget.
How it’s used: Heatmaps and Session Recordings show you what and how; Surveys and Feedback tools help you understand why. Place a survey or feedback widget on any page to ask customers what they think about their experience on your site, and give them the opportunity to share their unique perspective. With the Slackintegration, you and your team members are notified about new responses in real time.
When to use it: when you want to understand your users’ motivations—their drivers, barriers, and hooks—ask them! Hotjar lets you choose where you place your Surveys and Feedback widget, so you can get feedback when and where it’s most important.
Profi-Tipp: Die Art und Weise, wie Sie eine Frage stellen, bestimmt die Art der Antwort, die Sie erhalten werden. Offene Fragen liefern Ihnen mehr qualitative Daten (und können detailliert beantwortet werden), während geschlossene Fragen (denken Sie an Ja/Nein-Fragen) Ihnen helfen können, Diagramme zu erstellen, die auf quantitativen Daten basieren.
Bevor Sie eine Umfrage auf der Website erstellen, sollten Sie wissen, welche Informationen Sie von Ihren Besuchern erhalten möchten und wie Sie diese verwenden werden, damit Sie Fragen stellen können, die Ihnen die benötigten Daten liefern.
2. Clarabridge
What it is: an AI-powered feedback analytics tool
How it’s used: Clarabridge uses AI-powered text analytics to collect what people have said about your brand or business from every possible source, and analyze how they feel about you.
When to use it: when you want to know how people really feel about your brand and business, and what the general sentiment is. Use Clarabridge when there are people already talking about your company: either on your website (through chats and surveys), or off of your site (like on social media platforms).
3. InMoment
What it is: experience-intelligence (IX), AI-powered feedback
How it’s used: getting better feedback from users.
When to use it: when you want a simple way to get deeper and more meaningful VoC feedback from customers. InMoment’s AI-powered bot nudges your users to give more information. If you ask them about their experience, and they say ‘good’, InMoment prompts them further: ‘What was good?’ It also offers social monitoring and gathers meaningful feedback about what your customers are saying about you.
How to choose the right customer journey mapping tool
The right tool depends on a few things: the complexity of your customer journey, the maturity of your understanding of the journey, the structure of your team, and why you’re mapping the customer journey—that is, what you want to learn from it.
The most important part isn’t really the tool you pick, it’s how you use it and what you do with the insights.
In the next chapter we’ll dig deeper into why you need customer journey mapping tools in the first place, and how specific features can help you accomplish your goals.
Entdecken Sie, wie die Besucher Ihre Website erleben
Verwenden Sie Hotjar, um Daten und Einblicke in die Customer Journey zu sammeln, damit Sie die richtigen Änderungen zur richtigen Zeit für Ihre Besucher vornehmen können.