Learn / Guides / Behavior analytics guide
Top 15 user behavior analytics tools
If you really want to improve your website or app, looking at metrics like pageviews, bounce rates, and conversion rates alone isn’t enough—traditional metrics are out of context: they leave you guessing and making assumptions about what users want.
Learning how users behave on your site and interact with your product is one of the best ways to improve the user experience. Behavior analytics tools give you a glimpse into your users' minds so you can take the right steps to give them the experience they need.
This page covers five types of behavior analytics tools and helps you choose the tool that will enable you to reach your goals.

What are behavior analytics tools?
Behavior analytics tools reveal the actions users take on your website or app and help you understand how they experience and interact with your product.
Analyzing data from behavior analytics tools helps you uncover issues—like website bugs, a confusing design, or a poor user experience (UX)—so you take actionable steps to improve UX and the customer journey and increase conversion rates.
5 types of behavior analytics tools
Not all behavior analytics tools are created equal. Some tools reveal users' page-to-page journey through your website so you can see how they progress through your funnel; others let you ask users for direct feedback on your product, or analyze how they interact with a specific element.
Here are five types of behavior analytics tools:
1. Traditional analytics tools
Traditional analytics tools are behavior analytics software that allow you to understand what users are doing on your website. They capture sessions and page visits, keep track of events, calculate exit and bounce rates, and more.
These analytics platformscollect data best suited to quantitative analysis.
Google Analytics
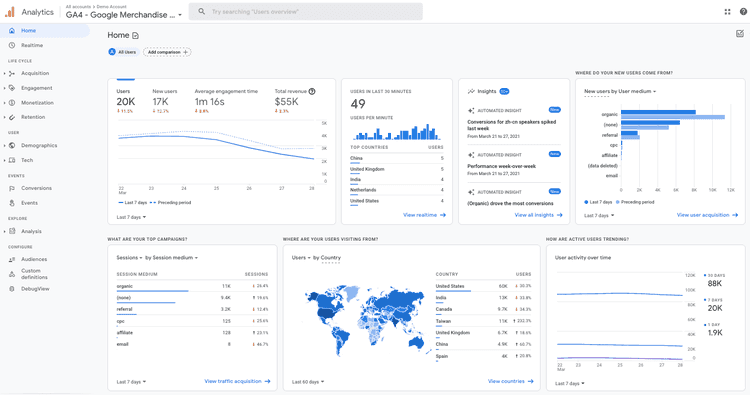
What it is: Google Analytics (GA) is an analytics platform that collects user data across devices and platforms. It lets you track quantitative data, from demographics to user behavior.
What it helps you do: Google Analytics translates user actions on your site or app into key data points. It’s one of the best behavioral analytics tools to answer questions like:
How many users visited your pages?
What is your pages’ bounce rate?
Where did those users come from?
Price: free
🔥 Pro tip: as a quantitative analysis tool, Google Analytics cannot tell you why users are behaving the way that they do. To understand the why beyond the what, use the Hotjar and Google Analytics integration. Filter heatmaps and recordings by GA events to understand how users actually behave on your site.
Mixpanel
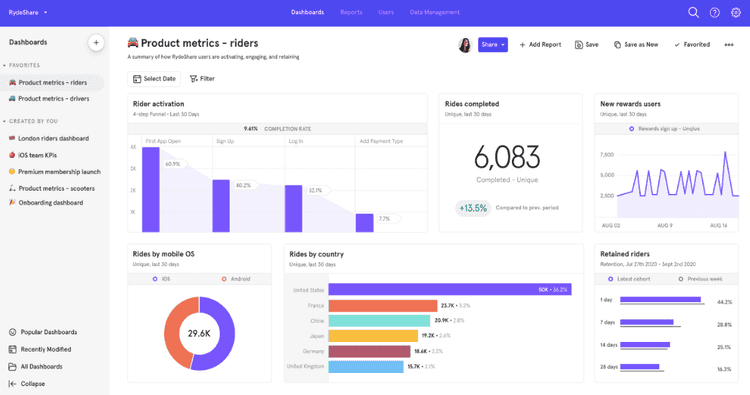
What it is: Mixpanel is a product analytics software that helps you convert and retain customers by analyzing user interactions on your website.
What it helps you do: Mixpanel opts for a self-serve approach to behavior analytics. Instead of traditional reports based on sessions and pageviews, they provide event-based tracking.
Once you’ve set up your events, properties, and user characteristics, Mixpanel helps you answer:
What is the drop-off rate at each step of the conversion funnel?
Which user cohorts converted best?
How are users moving through your product?
Price: free plan for up to 100K monthly tracked users, then starting at $25/month
Heap
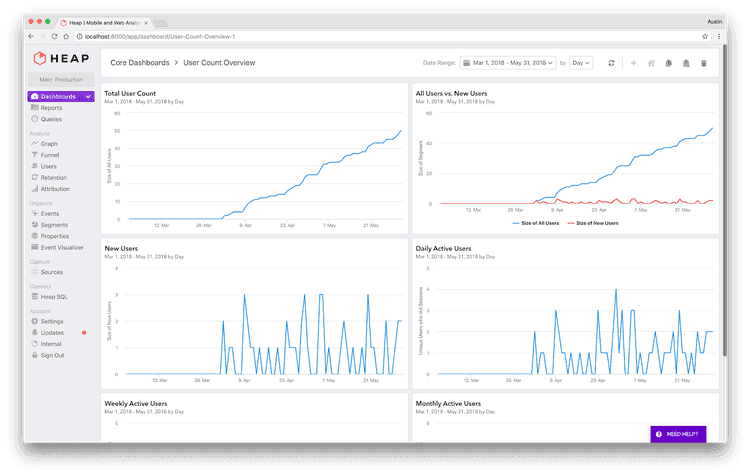
What it is: Heap is a digital insights platform that helps users understand their users and customers’ behavior on their site.
What it helps you do: Heap lets you collect data automatically with a single snippet. No technical expertise is required to start tracking user behavior patterns. Heap also alerts you about potential friction points in your site’s UX.
Price: Heap offers a basic free plan to get started
2. Session replay tools
Session replays (or session recordings) are renderings of actions visitors take as they browse your website from page to page, including mouse movements, clicks, taps, and page scrolls.
Session recordings help you understand how individual users experience and interact with your website—learn where they get frustrated or stuck, and fix UX mistakes.
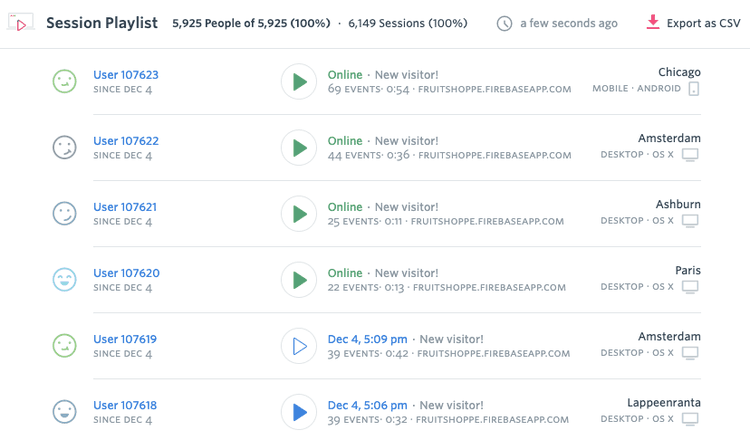
Hotjar Recordings
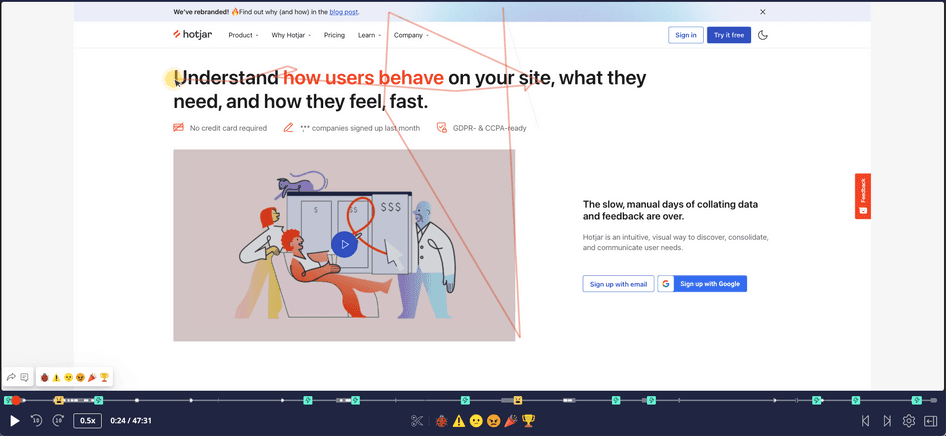
What it is: HotjarRecordings show you how individual users navigate your site, helping you understand and identify blockers in the customer journey. See where users click elements over and over again out of frustration (also known as rage clicks) or turn back before taking action (aka u-turns). It’s like looking over your user’s shoulder as they move their mouse, jump between pages, click on different elements, and exit your website.
What it helps you do: get a real understanding of how people interact with your product instead of playing a user behavior guessing game. Session recordings help you identify changes that will improve the user experience (UX) and give you visual, qualitative proof of the positive impact your changes make (and get buy-in to make additional changes). With a console tracking functionality and the error filter, Recordings also allow you to watch sessions with website bugs so you’re able to fix issues quickly.
Session recordings answer questions like:
Where do users focus? What do they spend time on, and what do they ignore?
What causes users to get confused or stuck?
What drives them to leave your website? What do they do in the moments before they abandon a product page or a checkout page?
Analyzing session recordings will give you insights to help fix UX issues and optimize your website for a smooth customer journey—and a higher conversion rate.
Price: get started for free. See full pricing here.
🔥 Pro tip: a quick way to identify blockers is to filter recordings by sessions that include rage clicks and u-turns, indicating that something isn’t working.

For example, if a user repeatedly clicks on an element (rage click), it may be a broken button you need to fix or an element that looks clickable—but isn't. If a user opens a page and quickly navigates back to the previous one (u-turn), it may signal uncertainty or a bug on the page they exited from.
Use what you learn from these recordings to remove blockers and improve UX for your users.
FullStory
What it is: FullStory session recordings let you visualize shopper frustration to better understand and solve issues. Like hotjar, their recordings are designed to index every interaction a visitor has with your site, which you can search for and access in your dashboard.
What it helps you do: FullStory indexes every digital interaction with your website or app, which helps teams measure, validate, and take action on individual customer's experiences at scale.
Recordings can help you understand the impact an issue or blocker had on your business (for example, users affected or dollars lost) so you can prioritize bug fixes appropriately.
With FullStory, you can watch live sessions while the user is still online and browsing, which is particularly helpful to support teams.
Price: from free for 1,000 sessions per month
Note: read our full Hotjar vs. FullStory comparison to learn which tool will suit your needs.
Crazy Egg
What it is: Crazy Egg's recordings tool lets you watch recordings of real users on your website so you can learn what makes them take action or become frustrated. You can see how users click, scroll, and move around your site.
What it helps you do: get to the heart of the user experience. See where visitors move their mouse, which sections they visit or avoid, and how long they stay on each element. Find out where they struggle, and make updates to improve their flow through the conversion funnel (and your conversion rate).
Price: starting at $288 per year (no monthly billing), 30-day free trial available
Note: for a detailed side-by-side comparison of the tools—so you can make the best choice for your business—check out our handy Hotjar vs. Crazy Egg article.
💡 Find out what users really think
Use Hotjar's behavior analytics tools to understand how users experience and interact with your website or app, so you can spot issues and bugs, and improve UX.

3. Heatmap tools
A heatmap (or heat map) is a visual, color-coded representation of website pages and elements that users interact with the most (hot) or the least (cold).
Website heatmaps aggregate user behavior and show you whether users reach important content, get distracted by non-clickable elements, use links and buttons, or experience issues while browsing on desktop or mobile.
Heatmaps are a must-have tool for making data-based decisions when you’re A/B testing, updating, or redesigning your website.
Hotjar Heatmaps
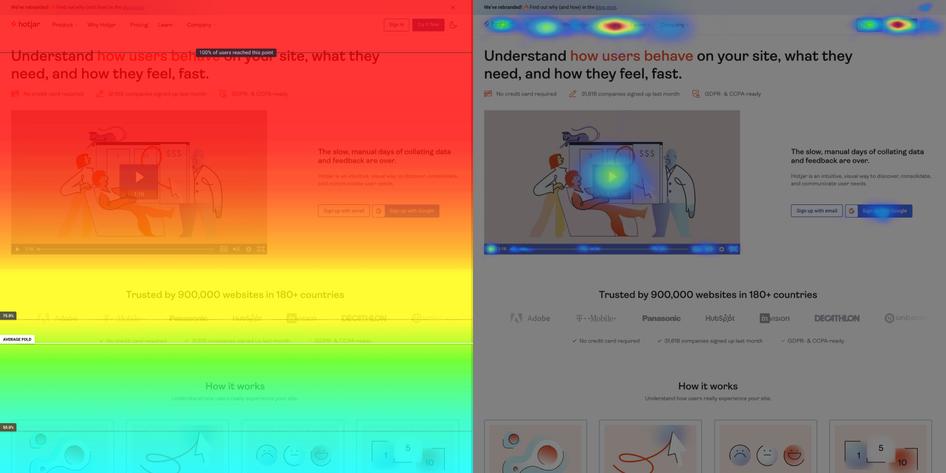
What it is: Hotjar Heatmaps show you what people do on your website pages, in aggregate, by displaying a range of colors from red (most popular) to blue (least popular) over different elements of your web pages.
What it helps you do: track user behavior with Hotjar Heatmaps using
Scroll heatmaps: see the percentage of people who scroll down to any point on the page. Do users see your CTA or your unique selling proposition (USP)?
Click heatmaps: see how frequently users click or tap on elements of your web pages. Are there a lot of clicks on a non-clickable element, or are users overlooking the button you want them to click?
Move heatmaps: see where desktop users move their mouse as they navigate a page. Is there a lot of mouse movement on important sections of the page?
Heatmaps help you identify opportunities to improve your page copy, layout, CTA placement, messaging, and design.
Price: get started for free. See full pricing here.
🔥 Pro tip: capture continuous heatmaps with all paid Hotjar plans. Hotjar generates heatmaps from sessions instead of pageviews, which means you don’t need to set up heatmaps for individual pages—just turn on the 'session capture' setting.
Lucky Orange
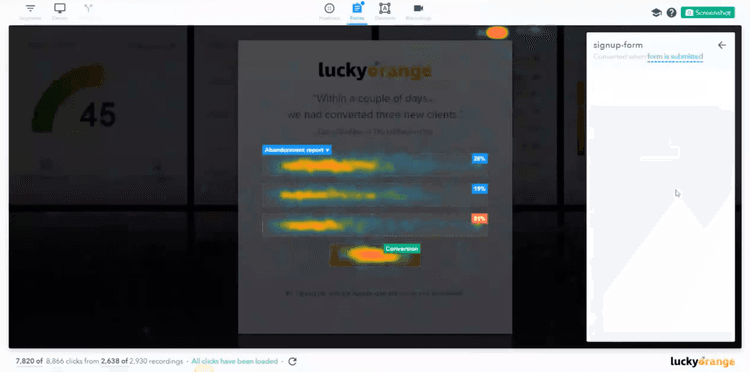
What it is: Lucky Orange is a conversion rate optimization tool that offers real-time heatmap insights and analytics.
What it helps you do: review heatmaps in real-time while your users toggle menus, navigate your website, open popups, or fill out a form.
With Lucky Orange, you can segment metrics, device types, and timeframes to learn how users browse and interact with your website.
You can only access Lucky Orange heatmap data for 30 days, so you can’t spot patterns over a long period, but you can spot individual user issues that require immediate support.
Price: from $10 per month, 7-day free trial available
Note: read our full Hotjar vs. Lucky Orange comparison to learn which tool will suit your needs.
Inspectlet
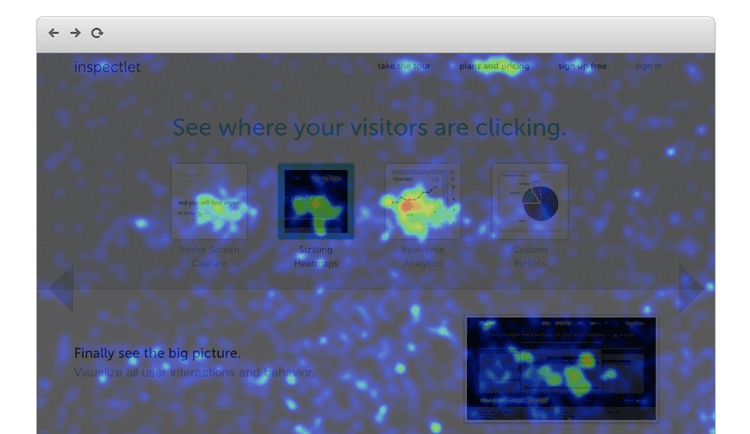
What it is: Inspectlet is a heatmapping tool that helps you understand your website visitors' intentions and what they focus on as they browse.
What it helps you do: find out where your visitors are looking (and what they’re missing) based on how they move their mouse and where they click. Inspectlet’s scroll heatmaps show you whether people scroll far enough to reach page sections that matter to you (think: product descriptions, pricing information, or the ‘buy’ button).
Price: from free for ~1,000 sessions per month and 1 month of data storage
4. Feedback and voice of the customer (VoC) tools
Website feedback and voice of the customer (VoC) tools give you what other tools can’t: qualitative data from real customers. Feedback tools let you layer quantitative data like traffic, bounce rate, and session duration with why users behave a certain way on your site.
Aggregated numbers and metrics from tools like Google Analytics leave out important context about user behavior—context your website visitor can add, themselves.
Here are some of the usual suspects:
Traditional metrics tell you users are abandoning their carts; feedback tools let you ask them why.
Traditional metrics tell you a specific page has a high exit rate; feedback tools let you survey users just before they leave to find out what turned them away.
Traditional metrics tell you a CTA has a low conversion rate; feedback tools let you ask users what’s stopping them from taking action.
Hotjar Incoming Feedback
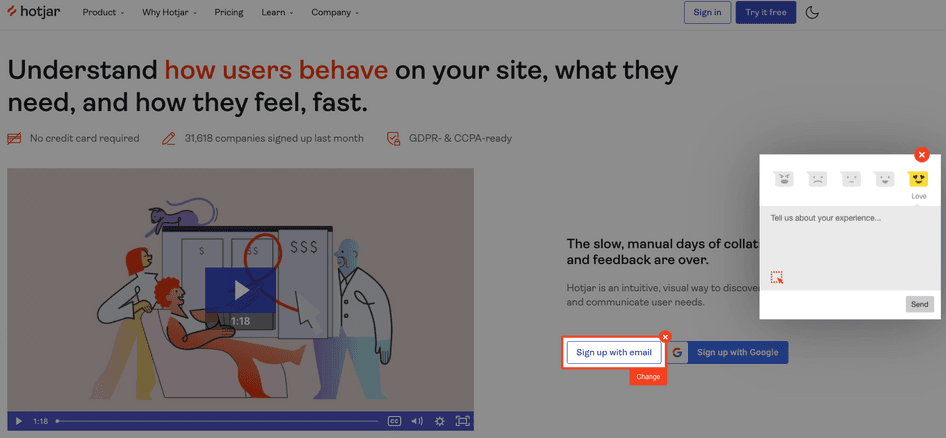
What it is: Hotjar Incoming Feedback gives you instant visual feedback from real website users. Users select, rate, and comment on specific page elements so you can learn what they love about your site—and what they want you to improve.
What it helps you do: get a detailed picture of how your visitors feel about your website or app. The Incoming Feedback widget sits at the edge of your page, so when a user clicks it, they can rate their experience on a scale, provide context and details, and even screenshot a specific page element.
Use Incoming Feedback to understand:
How your visitors feel about important web pages and their elements (think: product images and descriptions, buttons, headlines, checkout page)
User happiness over time (based on a graph of feedback ratings)
User satisfaction before and after you make a change to your site or app
Price: from free for 2,000 pageviews per day. Paid plans are measured by sessions and start at 100 full user sessions per day for $39 per month. See full pricing here.
Hotjar Surveys
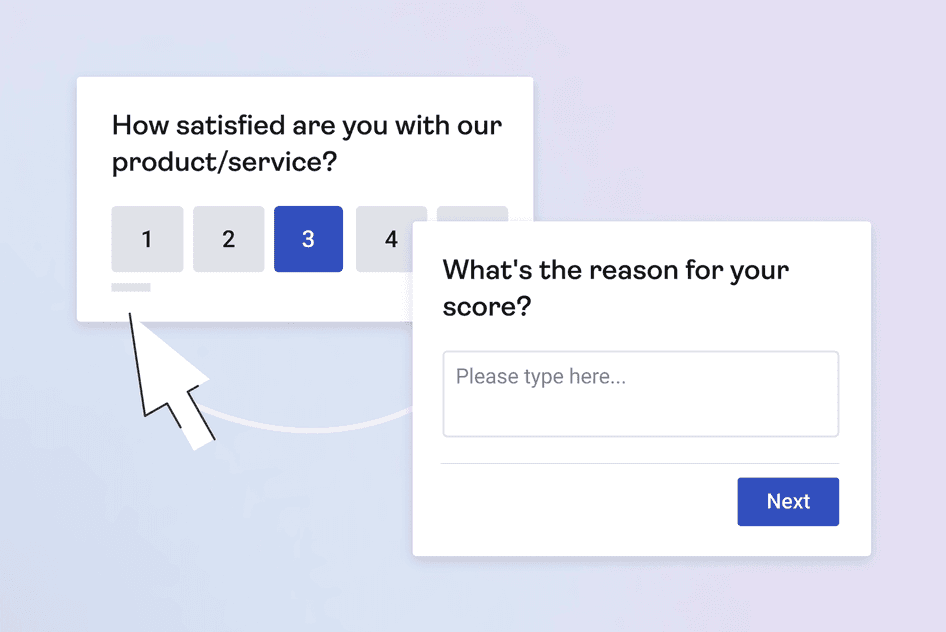
What it is: Hotjar Surveys take the guesswork out of understanding user behavior. Find out exactly what users need or think, in their own words, by asking questions and getting answers directly from them.
What it helps you do: get answers to questions about user behavior directly from the users themselves. Find out what works and what doesn't, and discover pain points in the user experience that traditional analytics tools can't identify.
Survey questions can be short or long, closed- or open-ended, and you can ask for a rating on a scale with surveys like:
With Hotjar, you also have the option to trigger a survey after visitors take a specific action, limiting surveys to specific user segments.
Price: from free for 2,000 pageviews per day. Paid plans are measured by sessions and start at 100 full user sessions per day for $39 per month. See full pricing here.
🔥 Pro tip: Hotjar tools complement each other: play the session recording associated with a user’s feedback to understand what their user journey was and why they left this feedback.
Hotjar Surveys
What it is: Hotjar Surveys take the guesswork out of understanding user behavior. Find out exactly what users need or think, in their own words, by asking questions and getting answers directly from them.
What it helps you do: get answers to questions about user behavior directly from the users themselves. Find out what works and what doesn't, and discover pain points in the user experience that traditional analytics tools can't identify.
Survey questions can be short or long, closed- or open-ended, and you can ask for a rating on a scale with surveys like:
With Hotjar, you also have the option to trigger a survey after visitors take a specific action, limiting surveys to specific user segments.
Price: get started for free. See full pricing here.
🔥 Pro tip: ask questions that will give you actionable insights.
Consider both open-ended questions (which can be answered in detail) and closed-ended questions (which offer a limited number of options, like yes/no or multiple-choice).
Here are a few examples of open-ended questions to try:
Is there something you’re struggling to find?
What brought you here today?
Was this article useful?
How likely are you to recommend us to a friend or colleague?
If you need additional inspiration, here are 28 more customer feedback questions to ask your users.
Usersnap
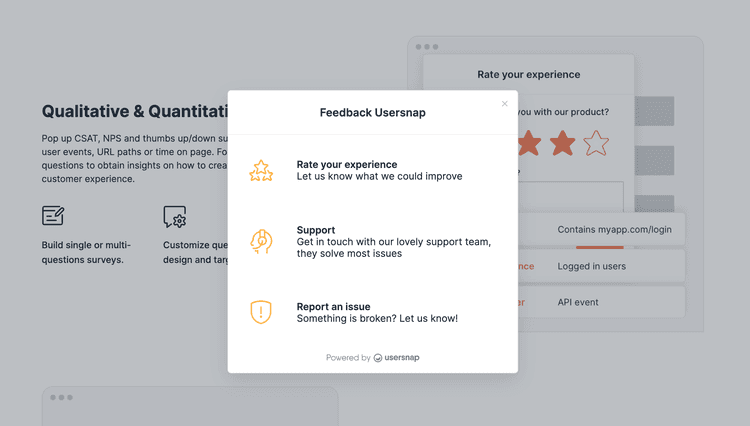
What it is: Usersnap is a versatile feedback platform. They help SaaS (software as a service) companies grow through a single hub for customer requests, bug screenshots, and customer experience (CX) ratings.
How it helps you: collect visitor feedback by asking your visitors to:
Rate their experience
Reach out to support over live chat
Report an issue by screenshotting a specific part of the page
Fill out an in-app form
You can view all the feedback on a dashboard with statistics and trends, so you can work on the improvements and track whether they worked.
Price: from $19 per month for one project/use case, 15-day free trial available.
5. A/B testing tools
A/B testing tools help you test changes you make to your website or app to find the variation that performs or converts the best—i.e. the one that results in happier users, and more clicks, signups, or sales.
With A/B testing tools, analyze user behavior on one or more variants to know which one offers the best UX and converts more.
Note: A/B testing works particularly well on high-traffic website pages; traffic helps with statistical significance.
Google Optimize
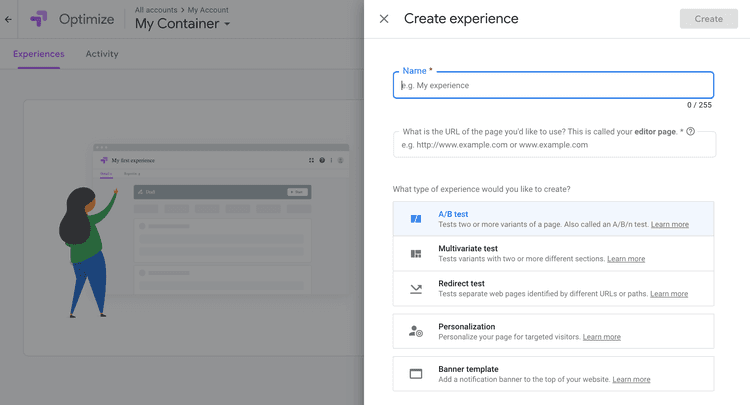
What it is: Google Optimize is a free website experiment platform. It natively integrates with Google Analytics and lets you run A/B tests, multivariate tests, and redirect tests.
What it helps you do: after using Google Analytics to identify pages of your website that need improvement, like pages with high bounce rates or low conversion rates, use Google Optimize to test changes—and see if they make a difference to the metric you’re analyzing.
Once you analyze your test results, Google Optimize makes it easy to launch the variation that gives your visitors and customers a better user experience.
Price: free
🔥 Pro tip: Hotjar integrates with Google Optimize, making it easy to see how customers respond to and interact with test variants. Filter Session Recordings by Optimize experiment IDs to watch individual users as they move their mouse, scroll, click, and browse each test page.
Optimizely
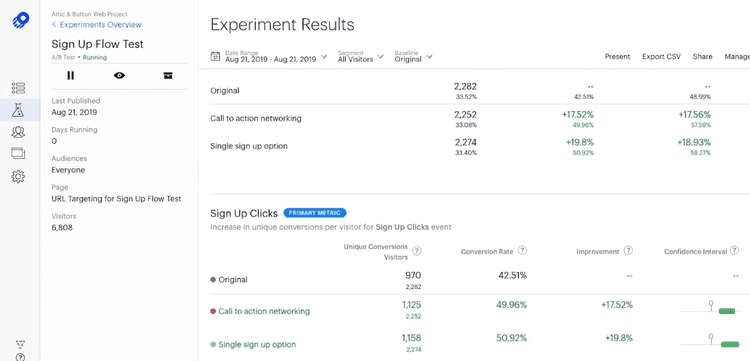
What it is: Optimizely is a test and experimentation platform designed to help users improve their site’s UX to acquire more users and improve customer retention.
What it helps you do: test variations of your homepage, landing pages, and product pages against each other to find the one that results in higher conversion rates.
Optimizely lets you iterate on your experiments across all devices and provides a platform allowing for fast releases, feature validation, and safer tests.
Price: pricing is only available on request for Optimizely’s experimentation platform
🔥 Pro tip: Hotjar integrates with Optimizely. By integrating the tools, you can filter your recordings and surveys by experiment.
Omniconvert
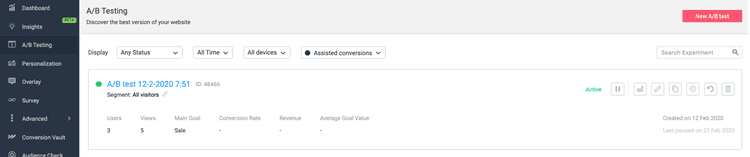
What it is: Omniconvert is a website conversion optimization tool for ecommerce businesses. A/B testing is one of their Explore package features, along with advanced segmentation, exit-intent overlays, and API access.
What it helps you do: run unlimited tests to learn how your visitors interact with your website, including design, calls to action (CTA), and text—and run with what works best.
Your tests can include mobile, desktop, and tablet, but you can also make them device-specific. The segments you test on can be based on traffic source, geolocation, behavior, UTM parameters, and custom parameters like customer lifetime value (LTV).
With these detailed segments, you can dig into specific visitor behavior and improve your website for the customer profile that matters most.
Price: starting at $320 per month, 30-day free trial available
💡 Get more out of your A/B tests
Finding the best-performing variation from an A/B test is an accomplishment… but why does one version work better than the other? How can you replicate its success across your website or app?
To find out, look at Hotjar Session Recordings and Heatmaps on the pages or elements you’re testing. Then, analyze the winning and losing versions and look for clues: what are visitors drawn to? What confuses them? What’s the final thing they do before they convert—or leave?
Hotjar integrates with Omniconvert making it easy to connect your Omniconvert experiments to your Hotjar account and filter your recordings and heatmaps by Omniconvert experiment ID.
How to evaluate behavior analytics tools and find the best one for you
If a behavior analytics tool gives you cool features and fancy reports but doesn’t help you improve your website or app, it’s not enough.
To determine which behavior analytics tool(s) you need—the one(s) that will help you improve your website and UX—you have to identify your goals. For example:
Do you want to increase conversion rates or average order value (AOV)?
Do you want to decrease cart abandonment rates or customer churn?
Do you want to find out which version of a site or app users prefer?
Do you want to find out if a product update had a positive impact?
When you know what you want to achieve, you can evaluate your options and find the tool to help you accomplish your goals.
💡 Keep in mind: there's no one-size-fits-all behavior analytics solution. Each tool has different use cases and brings different results. When you combine tools based on your goals, you can get even deeper, more actionable insights and a fuller picture of user behavior.
For example, recordings of A/B test page variations will show you what’s making one page more successful than the other, and on-page feedback can help you understand any unusual behavior you uncovered with recordings.
Learn more:
Here are three questions you should ask yourself when you're choosing a behavior analytics tool:
1. What do you want to learn about your users?
Identifying what you want to learn about your users will help you determine which behavior analytics tool is right for you. To get the most valuable and actionable user insights, start by specifying the problem you want to solve. For example:
Problem 1: high exit and bounce rates on your checkout page
What you want to learn: why are users exiting? Is there an issue or bug? What do users do on your site just before they exit? Are there any behavioral clues like rage clicks or u-turns?
Tools that can help: session recordings and feedback tools
Problem 2: a low conversion rate on a landing page
What you want to learn: are users seeing the information they need? Is the CTA button accessible and visible on all devices? Are the message and CTA appealing?
Tools that can help: heatmaps and A/B testing tools
🔥 Pro tip: once you identify which insights matter to you, add them to a checklist to mark off as you evaluate behavior analytics tool options.
2. How can you enrich your web analytics data with insights from a behavior analytics tool?
Web analytics tools like Google Analytics, Amplitude, Heap, or Mixpanel give you quantitative data about what happens on your website or app through metrics like traffic source, conversion rate, bounce and exit rate, and session duration.
Traditional analytics tools tell you what happens on your website, but not why it happens or how you can improve. That’s where behavior analytics tools come in, giving you qualitative data that adds context to traditional metrics.
Here are some examples of how to combine quantitative and qualitative data to paint a clearer picture of user behavior:
Keep an eye on your cart abandonment rate in Google Analytics.
When it goes up, there may be an issue with your checkout process. Spot the problem by watching recordings of sessions that included adding to cart but didn’t end with a purchase.
Use Google Analytics to find pages with a lot of traffic but low conversion rates.
A heatmap will show you what draws users’ attention and whether they view all the details they need to convert.
Dig into the Google Analytics Conversion report and segment it by Converters. Look at the average time these users spend on conversion-focused pages. Then, run a survey that’s triggered after a certain number of seconds—less than the time you found in GA—to find out what might make them leave (and not convert).
🔥 Pro tip: combining quantitative and qualitative insights will give you a complete picture of what your users experience when they browse your site and help you identify the best next action to improve their experience.
Learn how to use Hotjar and Google Analytics together to make this happen.
3. Does the tool let you filter and segment your reports to get specific, actionable insights?
No matter how good your graph or chart looks, and no matter how much detail you include, if your user behavior data doesn't help you take action to improve your website—and UX, CX, conversion rates, and sales—it's not enough.
For example, let’s say you had access to recordings of every session that ever happened on your site, but no way to filter them by exit URL, specific behaviors, devices, or other useful criteria. Those recordings would be pretty useless unless you took the time to sort through them—and it would take ages to find actionable insights.
To ensure you get valuable, actionable data from behavior analytics tools, check if the tool will allow you to filter insights:
For different pages, including pages visited, landing pages, and exit pages
Based on audience segments and user attributes like traffic source, geolocation, and new or returning visitors
For different behaviors, like rage clicks and u-turns
Look for a tool that allows you to get specific, so you can identify challenges and friction points that need to be removed to improve the user experience.
💡 Find out what users really think
Use Hotjar's behavior analytics tools to understand how users experience and interact with your website or app, so you can spot issues and bugs, and improve UX.