Learn / Guides / GA glossary (A-Z)
Google Analytics goal conversion rate
Every website has goals (think purchases, adds-to-cart, sign-ups) that can be set up and monitored from inside Google Analytics. But do you know how many people are completing your goals, and how many are not—and more importantly, why?
Let’s take a look at how to find your goal conversion rate, what you need to look out for in GA, and how you can get closer to answering the question ‘why’.
What is a goal conversion in Google Analytics?
Goals in Google Analytics help you keep track of the actions your website visitors did or didn't take. A goal conversion (or goal completion) takes place when your visitors complete a specific action you are tracking—for example, make a purchase, add a product to cart, or sign up for a newsletter.
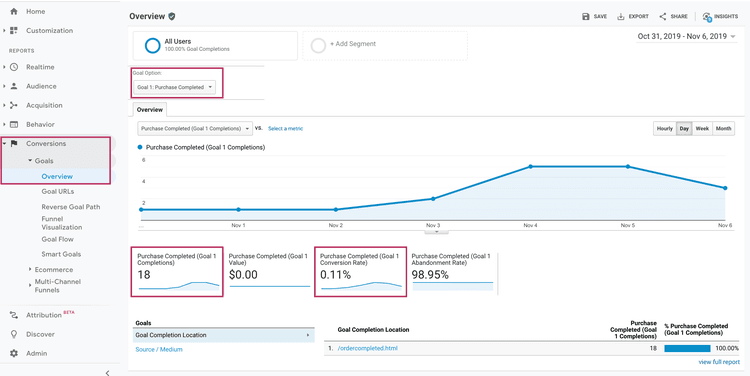
You access the Goals report under Conversion > Goals > Overview, where you can select the goal you’re interested in from a drop-down menu and see relevant data.
How is the goal conversion rate calculated?
In Google Analytics, the goal conversion rate is calculated as the number of goal conversions divided by the number of sessions, times 100.
For example: if your ecommerce goal is ‘Purchase completed’, every time a purchase is completed it will count as a goal conversion. If you have 200 sessions and 5 successful purchases, the conversion rate is (5/200)*100 = 2.5%.
Why is it important to track your goal conversion rate?
Tracking the conversion rate of your goals can tell you how well your website is doing in specific areas you’re interested in. A low goal conversion rate means not many people are doing what you want them to, while a high one conversely shows you what is going well.
On any website selling online, an obvious goal to track is ‘purchases completed’, and knowing the conversion rate can help you look at trends and fluctuations, spot opportunities, and intervene if there are sudden drops. But there are plenty of other goals you can create and track to paint a more complete picture of your visitors’ journey across the website, including:
Add to cart
Register an account
Enter checkout
Sign up for a newsletter
and ecommerce tracking conversions for each will help you paint a picture of what’s working, and isn’t, on your website.
A quirk of the Goals Overview page
When you navigate to Conversion > Goals > Overview, the default goal option is ‘all goals’—and the Goal Conversion Rate number you see is a sum of the conversion rate of all your goals:
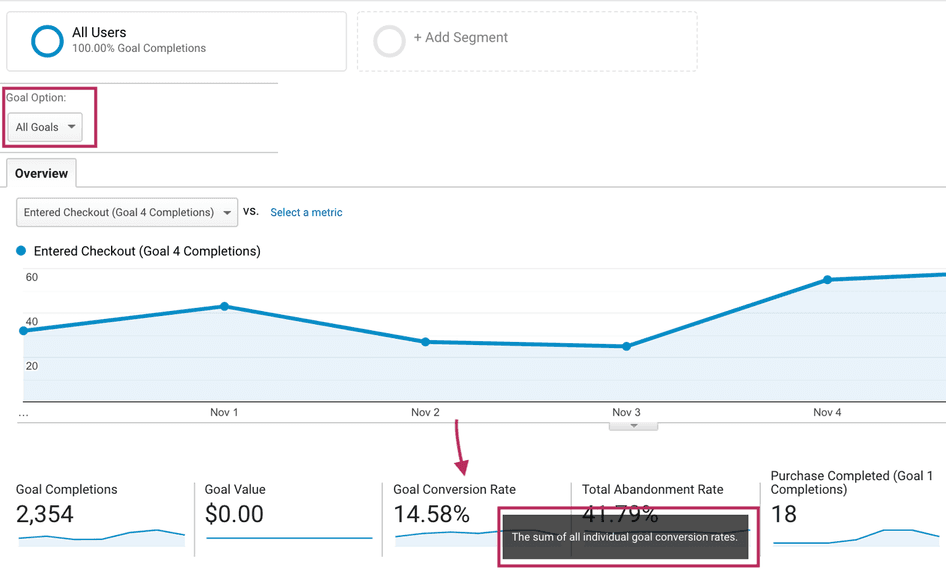
This means that if you have set up 5 goals that all happen to convert at 25% each, your Goal Conversion Rate will be 25 + 25 + 25 + 25 + 25 = 125%. Which is clearly a useless data point.
And even if you didn’t experience this edge case, looking at this overview can be quite deceiving—you might have an overperformer that skews all other numbers, and think you’re better/worse off than you actually are. Reminder: always use the drop-down menu to investigate the individual goal you’re interested in.
How to use subsegments to analyze goal conversions
Once you have set up your goals, you won’t only find them in the Goal report; you can review them alongside other metrics, for example by going into Acquisition > All Traffic > Source/Medium and see how different traffic sources compare:
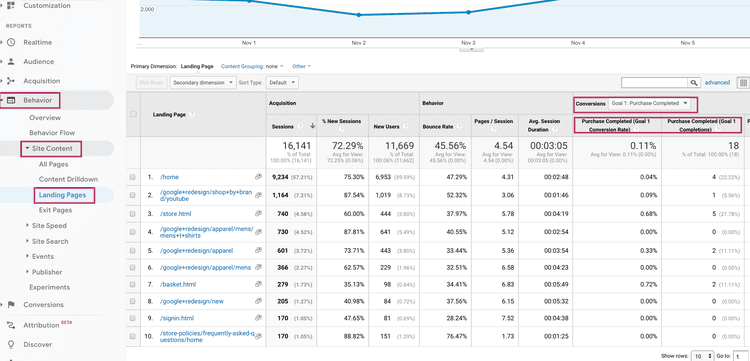
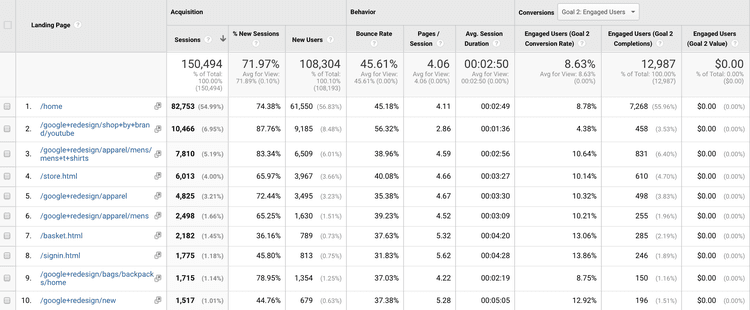
Similarly, you can go into Behavior > Site Content > Landing Pages and compare performance by looking at differences in behavior dependent on where people entered your website from:
The point is: there are many different ways to slice and dice available data around goal conversions. Google Analytics data is fairly accurate, but averages can lie—which is where drilling down into different reports and/or looking at specific dimensions (source, medium, device, etc.) can help you get a better sense of what’s going on.
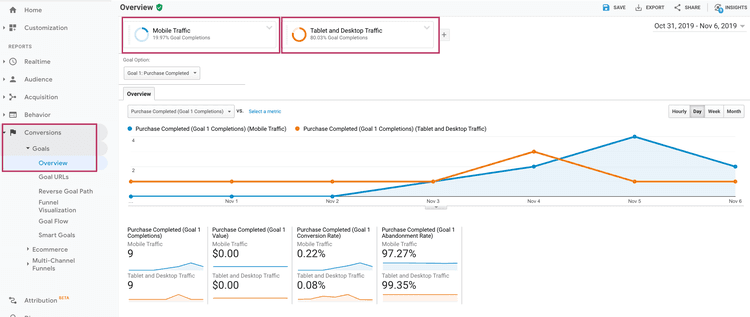
You can also do this by applying segments to the Goal Overview tab. Clicking the All Users default setting at the top will open a menu where you can select multiple segments:
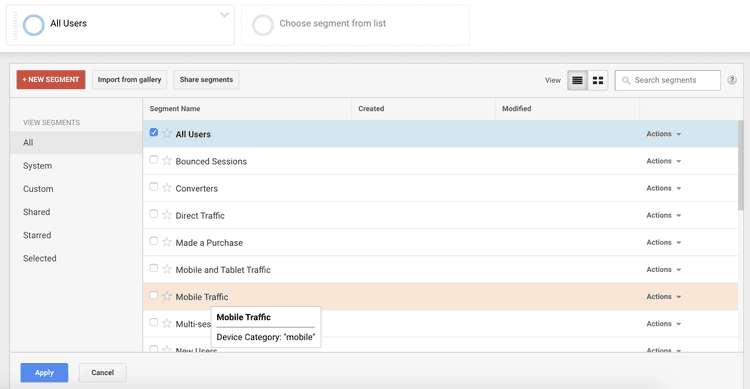
You can then compare goals across different types of traffic—for example, you could investigate the ‘Purchase completed’ goal across desktop and mobile users and see if you can spot any obvious or revealing differences:
The expert’s take on goal conversion rate
There is no good, perfect, or ideal goal conversion rate. Conversion rates are always going to vary by so many things: your website type, the industry you're in, what your unique value proposition is, how much seasonality the website has, and even things that you as a marketer or optimizer cannot really affect, like the actual price of a product. There is only so much you can do by focusing on industry benchmarks or competitors. I’d say it’s more important to always focus on beating your current goal conversion rate, and not compare it to stats out there that you may have overheard, or been told about, or read on articles.

How to investigate and improve your goal conversion rate
The data you’ve collected in Google Analytics so far will give you a solid understanding about the performance of your main goal(s)—but when it comes to actually improving it, more digging is required. You need to get to the bottom of your visitors’ motivation and research what, if anything, is stopping them from completing the goals you set up.
To get started, you can run a 3-step investigation that will help you discover:
The DRIVERS (things, desires, motivations) that drive people to your site
The BARRIERS that cause them to leave
The HOOKS that persuade a visitor to act (and complete your goal)
Step 1: understand what brings people to your site (DRIVERS)
The first thing you want to discover is why people are coming to your site, and how their motivation aligns with your goal(s). You can’t get that from Google Analytics alone—but GA is a good starting point nonetheless.
Head to Behavior > Site Content > Landing Pages, and use the Conversions column to filter the results for your particular goal:
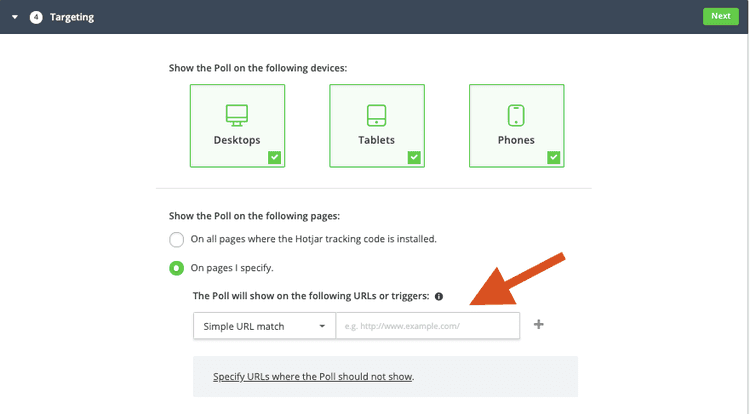
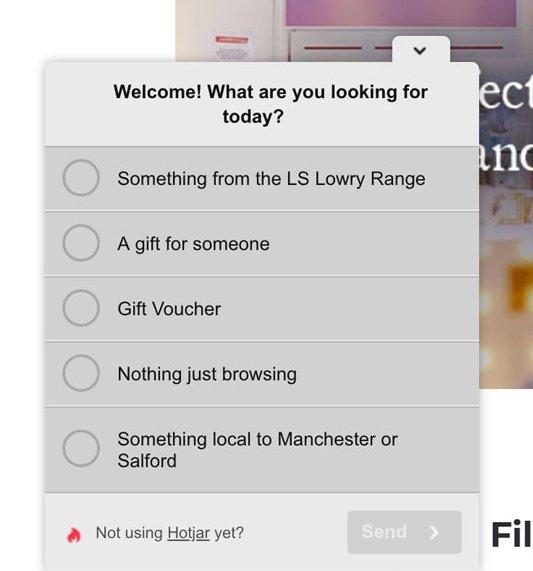
Find the pages with the highest sessions, and set up an on-site survey in Hotjar on those specific URLs. Asks your visitors why they’re visiting with a question such as “What was the main reason for your visit today?” and judge whether their intentions are similar to your goal.
For example: say your goal is a purchase. By placing a poll on the first URLs a person tends to visit, you might find that they don’t actually intend to purchase until they see a customer testimonial—and that it makes sense to make customer testimonials more prominent on the page.
PS: SEE 20+ EXAMPLES OF ON-SITE POLLS IN ACTION
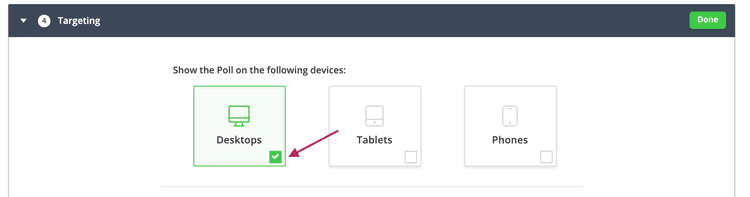
🔥 Pro tip: remember how earlier we mentioned you can use subsegments in GA to find whether your averages are skewed? Adding a secondary dimension (such as device category) to your Landing Pages report will also help you get more granular with your poll targeting. For example, if it turns out that mobile visitors land primarily on a different page than desktop ones, you can set your survey to appear on the specific URLs and only show to relevant device users.
Step 2: understand what stops people along the conversion path (BARRIERS)
You can dig deeper into why people abandoned your site (and goal) by reviewing how website visitors engage with important pages before they leave.
To do this, head to Conversions > Goals > Goal Flow in GA, and break down your data by individual goal using the Goal Option dropdown. This will show you the paths your visitors take before reaching a destination goal, and the volume of drop-offs for each step:
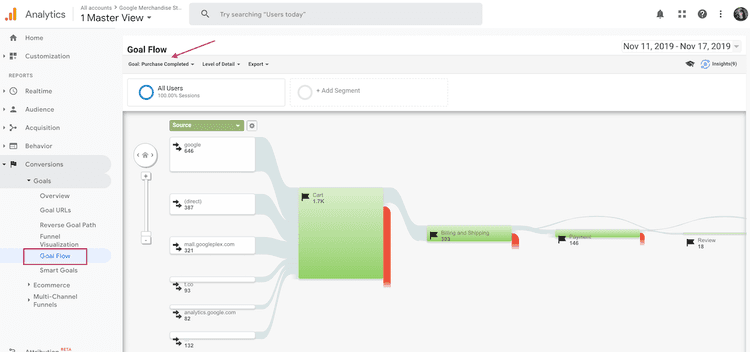
Clicking on each step will open a second graph, where you can make a note of the pre-conversion pages with the highest drop-off rates. Once you have a list of pages that you want to investigate, use Hotjar Session Recordings on those URLs to see if you can spot any reasons why people exit your site without completing the goal.
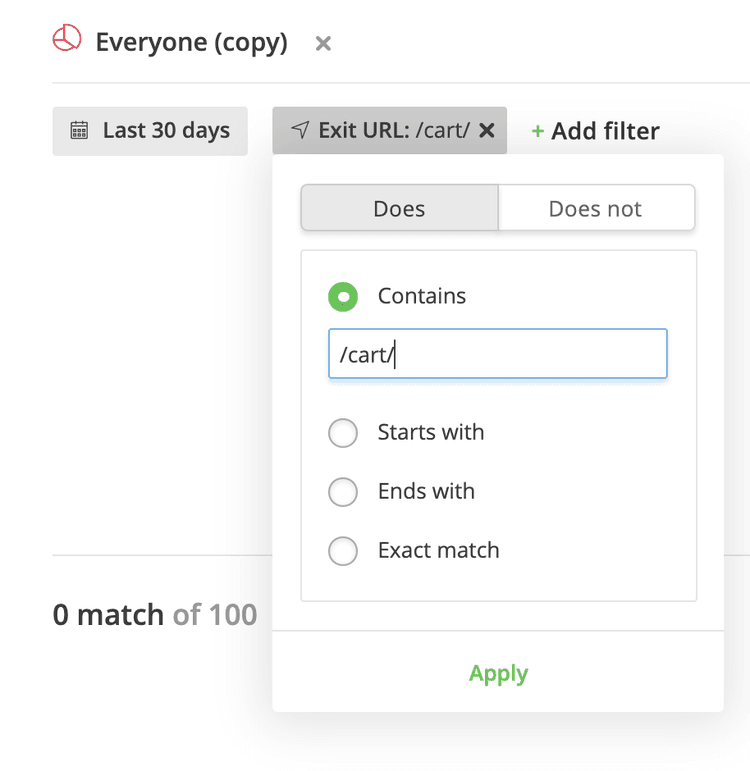
Here’s what that might look like if your goal is a purchase. Say you discover in GA that your /cart/ page has a 70% drop-off rate. You then use Hotjar’s filters to view visitor recordings of the visitors who left your site on the /cart/ page:
You’ll have a list of recordings of people who visited your pre-conversion page but didn’t convert. Spend a few hours digging through these recordings. Can you spot any areas of the page that people seemed confused about? This could look like:
Hovering over a specific element for a long time
Viewing a specific area of the page immediately before exiting
Scrolling up and down on the page repeatedly
If you spot anything that’s obviously broken, go right ahead and fix it; if not, use the data to develop hypotheses about design or content changes you can test. Monitor how your goal conversion rate moves afterward—it should improve since you’re focusing on and changing the things people stumble on pre-conversion.
Step 3: find what convinced people to convert (HOOKS)
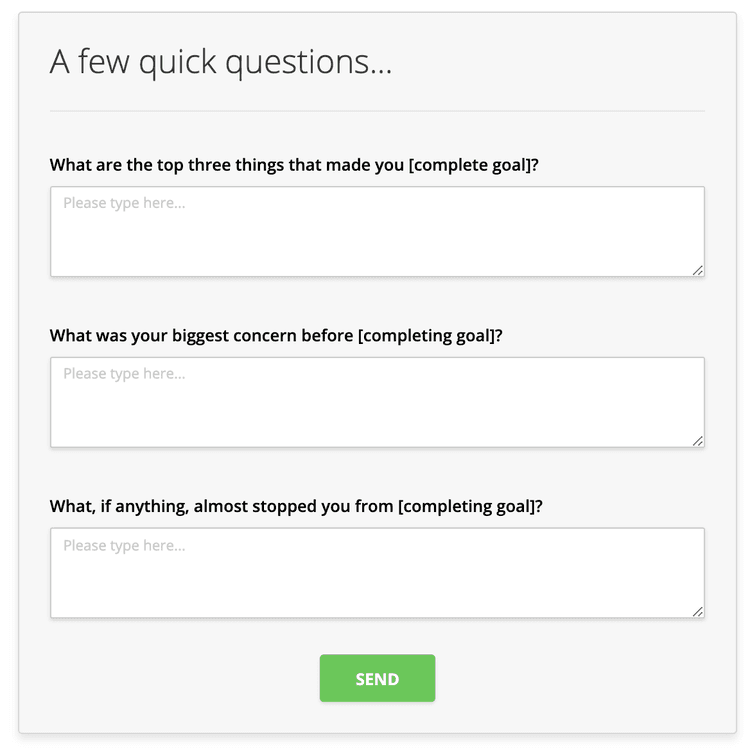
The ‘hook’ is what caused visitors to complete your goal. Once again, you want to hear directly from them—but instead of asking any site visitor to give you their feedback, you can target people who’ve already converted, and send them a simple email survey to ask why they completed the goal. Example questions include:
What are the top three things that made you [complete goal]?
What was your biggest concern before [completing goal]?
What, if anything, almost stopped you from [completing goal]?
Let’s put that into practice and say your Google Analytics goal is ‘complete a purchase’. If you received your customers’ consent to use their email address, you can build a Hotjar survey with the three questions above and email it to them:
You might get feedback like:
“I saw the company had a 5* rating”
“I almost didn’t [complete goal] because I couldn’t see any reviews from the sales page. I had to visit TrustPilot”
“I converted because an influencer I follow had [product] on their Twitter profile”
Only the people who’ve already converted know what’s nudged them and eventually won them over—and these things are bound to have the same impact on other visitors, and boost your goal’s conversion rate in return.
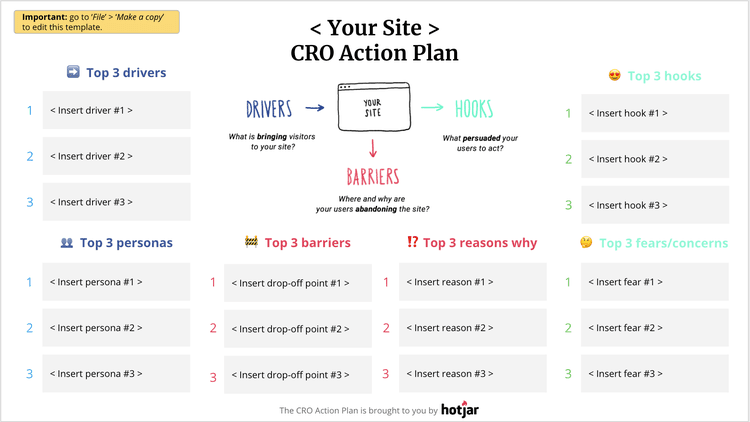
🔥 Pro tip: if you are looking for a more in-depth action plan, we have developed a 3-step framework you can follow to paint a fuller picture of the situation (with a free one-page template you can use throughout your investigation):
Editor's note: Google recently launched Google Analytics 4, which includes minor changes to some reports; however, this article is still relevant for standard GA. As more users migrate, we will release updates to this and other articles as needed, with references and steps to obtain results in GA 4.
Content credits: we created this piece with the help of web analytics and CRO expert Rich Page, who was interviewed by our team and talked to us about all things GA in August 2019.
FAQs about goal conversion rate in Google Analytics
Start learning about your users today
Grab a free Hotjar trial, use Recordings and Polls on your URLs, and get insights about your users and what they need from you.

Content credits: this content was originally created with the help of web analytics and CRO expert Rich Page, who was interviewed by our team and talked to us about all things GA in August 2019.