Learn / Guides / Usability testing guide
Usability evaluation and analysis
Once you've finished running your usability testing sessions, it's time to evaluate the findings. In this chapter, we explain how to extract the data from your results, analyze it, and turn it into an action plan for improving your site.

Take your first usability testing step today
Sign up for a free Hotjar account and make sure your site behaves as you intend it to.

How to evaluate usability testing results [in 5 steps]
The process of turning a mass of qualitative data, transcripts, and observations into an actionable report on usability issues can seem overwhelming at first—but it's simply a matter of organizing your findings and looking for patterns and recurring issues in the data.
1. Define what you're looking for

Before you start analyzing the results, review your original goals for testing. Remind yourself of the problem areas of your website, or pain points, that you wanted to evaluate.
Once you begin reviewing the testing data, you will be presented with hundreds, or even thousands, of user insights. Identifying your main areas of interest will help you stay focused on the most relevant feedback.
Use those areas of focus to create overarching categories of interest. Most likely, each category will correspond to one of the tasks that you asked users to complete during testing. They may be things like: logging in, searching for an item, or going through the payment process, etc.
2. Organize the data

Review your testing sessions one by one. Watch the recordings, read the transcripts, and carefully go over your notes.
Look for:
Issues the user encountered while performing tasks
Actions they took
Comments (both positive and negative) they made
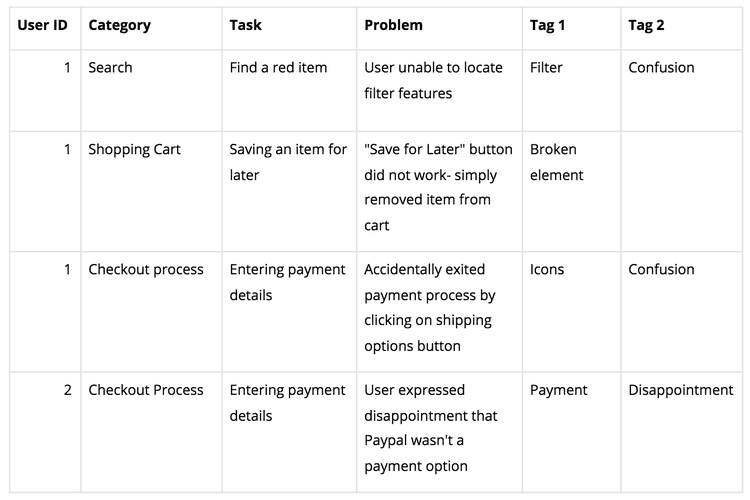
For each issue a user discovered, or unexpected action they took, make a separate note. Record the task the user was attempting to complete and the exact problem they encountered, and add specific categories and tags (for example, location tags such as check out or landing page, or experience-related ones such as broken element or hesitation) so you can later sort and filter. If you previously created user personas or testing groups, record that here as well.
It's best to do this digitally, with a tool like Excel or Airtable, as you want to be able to move the data around, apply tags, and sort it by category.
Pro tip: make sure your statements are concise and exactly describe the issue.
Bad example: the user clicked on the wrong link
Good example: the user clicked on the link for Discounts Codes instead of the one for Payment Info
When you're done, your data might look similar to this:
3. Draw conclusions

Assess your data with both qualitative and quantitative measures:
Quantitative analysis will give you statistics that can be used to identify the presence and severity of issues
Qualitative analysis will give you an insight into why the issues exist, and how to fix them.
In most usability studies, your focus and the bulk of your findings will be qualitative, but calculating some key numbers can give your findings credibility and provide baseline metrics for evaluating future iterations of the website.
Quantitative data analysis
Extract hard numbers from the data to employ quantitative data analysis. Figures like rankings and statistics will help you determine where the most common issues are on your website and their severity.
Quantitative data metrics for user testing include:
Success rate: the percentage of users in the testing group who ultimately completed the assigned task
Error rate: the percentage of users that made or encountered the same error
Time to complete task: the average time it took to complete a given task
Satisfaction rankings: an average of users' self-reported satisfaction measured on a numbered scale
Qualitative data analysis
Qualitative data is just as, if not more, important than quantitative analysis because it helps to illustrate why certain problems are happening, and how they can be fixed. Such anecdotes and insights will help you come up with solutions to increase usability.
Sort the data in your spreadsheet so that issues involving the same tasks are grouped together. This will give you an idea of how many users experienced problems with a certain step (e.g., check out) and the overlap of these problems. Look for patterns and repetitions in the data to help identify recurring issues.
Keep a running tally of each issue, and how common it was. You are creating a list of problems with the website. For example, you may find that several users had issues with entering their payment details on the checkout page. If they all encountered the same problem, then conclude that there is an issue that needs to be resolved.
Try and broaden the insight if it isn’t exactly identical with another, but is still strongly related. For example, a user who could not find a support phone number to call and another who couldn’t find an email address should be grouped together, with the overall conclusion that contact details for the company were difficult to find.
4. Prioritize the issues

Now that you have a list of problems, rank them based on their impact, if solved. Consider how global the problem is throughout the site, and how severe it is; acknowledge the implications of specific problems when extended sitewide (e.g., if one page is full of typos, you should probably get the rest of the site proofread as well).
Categorize the problems into:
Critical: impossible for users to complete tasks
Serious: frustrating for many users
Minor: annoying, but not going to drive users away
For example: being unable to complete payments is a more urgent issue than disliking the site's color scheme. The first is a critical issue that should be corrected immediately, while the second is a minor issue that can be put on the back burner for some time in the future.
5. Compile a report of your results

To benefit from website usability testing, you must ultimately use the results to improve your site. Once you've evaluated the data and prioritized the most common issues, leverage those insights to encourage positive changes to your site's usability.
In some cases, you may have the power to just make the changes yourself. In other situations, you may need to make your case to higher-ups at your company—and when that happens, you’ll likely need to draft a report that explains the problems you discovered and your proposed solutions.
Qualities of an effective usability report
It's not enough to simply present the raw data to decision-makers and hope it inspires change. A good report should:
Showcase the highest priority issues
. Don't just present a laundry list of everything that went wrong. Focus on the most pressing issues.
Be specific. It's not enough to simply say “users had difficulty with entering payment information.” Identify the specific area of design, interaction, or flow that caused the problem.
Include evidence. Snippets of videos, screenshots, or transcripts from actual tests can help make your point (for certain stakeholders, actually seeing someone struggle is more effective than simply hearing about it secondhand). Consider presenting your report in slideshow form, instead of as a written document, for this reason.
Present solutions. Brainstorm solutions for the highest priority issues. There are usually many ways to attack any one problem. For example: if your problem is that users don't understand the shipping options, that could be a design issue or a copywriting issue. It will be up to you and your team to figure out the most efficient change to shift user behavior in the direction you desire.
Include positive findings. In addition to the problems you've identified, include any meaningful positive feedback you received. This helps the team know what is working well so they can maintain those features in future website iterations.
Visit our page on reporting templates for more guidance on how to structure your findings.
Acting on your usability testing analysis
After the recommended changes have been decided on and implemented, continue to test their effectiveness, either through another round of usability testing, or using A/B testing. Compare feedback and statistics on success rates to evaluate the changes and confirm that they fixed the problem. Continue refining and retesting until all the issues have been resolved—at which point… you’ll be ready to start with usability testing all over again.