Learn / Blog / Article
Say goodbye to the Hotjar Dashboard. Long live Dashboards.
Hotjar Dashboard is now Hotjar Dashboards—with an ‘s’. 🤯
Look, we get it. Every product and their dog has a dashboard. They’re not new.
But bear with us—this is way more exciting than it sounds. It’s one small ‘s’ for Dashboards, and one big win for your team.

Dashboards: your new command center
Dashboards means you can now create and customize as many dashboards as you like.
Whether launching a new feature, monitoring areas of your sites for pesky bugs, tracking your latest marketing campaign—or all three at once—your teams will have all their metrics in one place: Dashboards!
Of course, with Dashboards it’s easier to dive into the real user behavior behind the metrics, too.
If you spot a drop in a page’s feedback score, or notice a surge in rage clicks, you can easily check session recordings, heatmap, or user feedback to learn what’s really happening.
Understanding users, squashing bugs, optimizing conversions—it all starts in Dashboards.
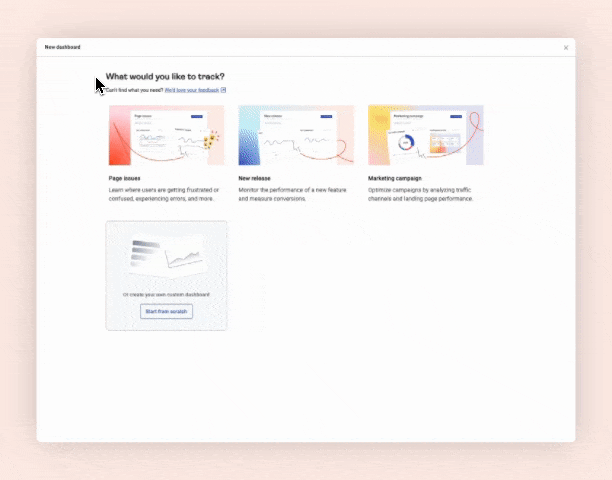
A dashboard for every occasion, ready in seconds
Here’s the best bit: you can set up dashboards in seconds with our new templates.
They cover a bunch of typical uses and scenarios—like launching a new feature, tracking pesky bugs, or monitoring a marketing campaign. You’ll see what users are doing, and how they feel about it, all in one place.
Once you’ve chosen a template, we’ll ask for relevant info, like the page’s URL. Pop your info in, and voilà: your new dashboard will spring into life.
More time spotting patterns, less time tweaking tables. This is what being in control feels like.
New dashboard widgets and an improved experience
You can now browse a gallery of widget templates (used to customize your dashboards) including our three latest widgets:
Net Promoter Score®: monitor customer loyalty so you can investigate unexpected dips fast
Page overview: bring together a page’s key metrics like number of sessions, rage clicks, average time on page, average scroll depth, and drop-off rate
Pages with most issues: surface the page on your site with the most rage clicks, u-turns, or errors
Plus, you’ll notice some smaller improvements across the board, err, boards. You can now rename, duplicate, and delete widgets so it’s easier to keep everything organized.
Dashboard ideas to inspire you
Dashboards can help you access insights fast, whatever you’re doing. Here are a few great uses to get you inspired:
Unlimited dashboards are available to all Hotjar users. Get in there and set up your command center today.
A dashboard for every occasion
Create dashboards in seconds. Customize them with a full range of widgets. Learn both what your users do and why.

Related articles

Hotjar product updates
🔥 Read it while it’s hot: February 2024 updates in the Hotjar world
February’s update is all about frustration 😤

Hotjar team

Hotjar product updates
A year in review: how Hotjar revolutionized its suite for users in 2023
Hotjar team

Hotjar product updates
🔥 Read it while it’s hot: November 2023 updates in the Hotjar world
It's November, and we've got exciting updates to share, from what happened last month to what’s coming soon. Sentiment analysis, improved research hub, popover surveys 2.0, and enhanced team collaboration... Take a look. 👇
Hotjar team