Learn / Blog / Article
Why are users dropping off your website? 7 powerful techniques to uncover the problem
It’s frustrating when people lose interest and drop off your site, whether they’re loyal, long-term customers or first-time visitors.
High drop-off rates can make you feel like a substitute teacher: doing your best to hold your students’ attention, but quite aware they’re restless, waiting for lunch, and could be pulled away by a smartphone notification any second.
While some level of website user drop-off is inevitable, you need to investigate why and when users disengage with your fantastic offer—so you can win back their attention and, ultimately, increase conversion rates.


This article gives you seven powerful techniques to find out where people drop off your site—and why—so you can address the problem, inspire user engagement, and create delight.
7 ways to tell where and why users drop off to increase engagement and retention
How you define a ‘drop-off’ depends on the nature of your business, and the funnel or flow users are abandoning. If you run an ecommerce site, for example, drop-off might refer to users who add an item to their cart and view the checkout page—but close the tab before parting with any cash.
To define your important flows, create a customer journey map that details the steps users typically take when completing a valuable action on your site, like buying a product, subscribing to your service, or using important features.
For your purchase flow (or sales funnel), this might look like:
Users navigating to and browsing a product page
Adding an item to cart
Checking out
Filling out delivery and card information
Clicking ‘pay now’
Now that you’ve identified a sequence users are dropping out of, here’s how to pinpoint exactly where you’re losing the crowd—and why.
1. Study web analytics
Analytics tools collect hard (quantitative) data on your users and track important metrics, so you can review and spot patterns, and find drop-off points.
Analytics software, such as Google Analytics 4, Adobe Analytics, and Hotjar, allow you to monitor metrics like:
Bounce rates: the percentage of your visitors who land on one page, then immediately leave your site without taking any action. Pages with high bounce rates are failing to engage your users, causing them to drop off.
Exit rates: the percentage of page views that end with a user leaving your site. For example, if your landing page has a high exit rate, you need to determine what’s causing users to leave, so you can fix the issue and increase engagement and retention
Flows: track a sequence of user actions within a flow (e.g. a user visiting your website, logging into their account, and using a particular feature) to identify what percentage of users make it from one step to the next. In Google Analytics 4, this feature is called Path Exploration.
💡Pro tip: use Hotjar Funnels to visualize your user flows with a graph and see the percentage of users who drop off and those who make it to each successive step.
Visual aids like this are invaluable when you’re presenting information about drop-off patterns to your team. When your collaborators understand where your drop-offs are happening at a glance, they can help you develop ideas to increase engagement.
What’s more, Hotjar Funnels creates session recordings (more on this later) of how users act in each step of your flow. For example, if you notice that many users drop off at one particular step, you can watch recordings of users’ screens as they navigate those pages.
Use Hotjar to watch the session recordings of important steps in your funnel to see why users are dropping off
2. Watch session recordings
Session recordings allow you to explore your website through your visitors’ eyes, so you can clearly see which parts of your processes engage users, and which parts distract or dissuade them from doing business with you.
When you watch session recordings, look out for:
How users interact with page elements, or how they fail to, so you can identify broken calls to action (CTAs) and items that look clickable but aren’t
Any unusual mouse activity, like rage clicks, wild scrolling, or u-turns, which usually indicate broken elements or rendering issues
How visitors move around pages, including how long they stick around and how far down they scroll, so you can tell whether the info on a page is sufficiently interesting to retain users’ attention
If something is causing visitors to lose interest in your site before they complete key actions, watching session recordings helps you uncover the problem—so you can fix it. If you’re using Hotjar, the platform assigns a relevance score to each recording, so you only watch the most important user sessions.
👀See it in action
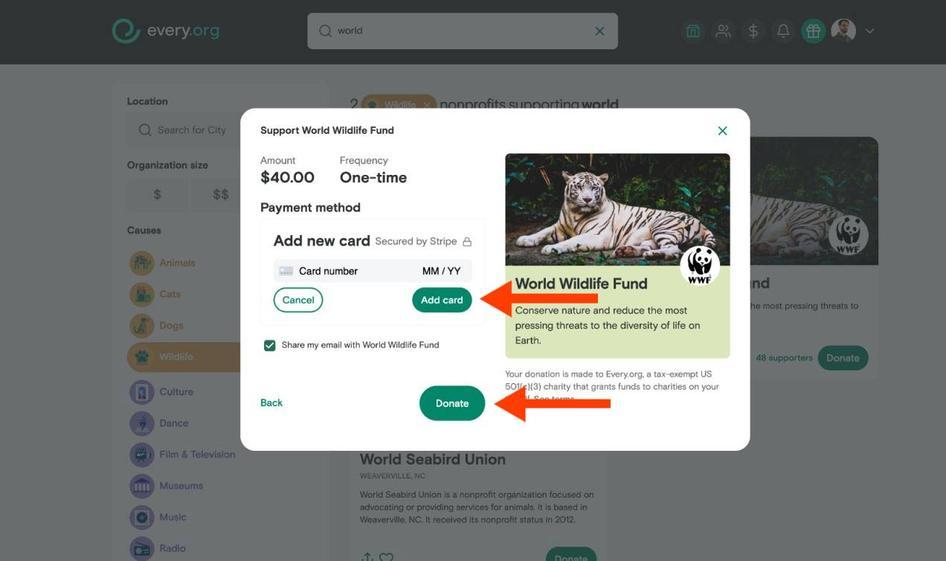
Reviewing session recordings proved to be a valuable tactic for the donation site Every.org, when its Senior Product Designer Dave Sharp noticed a high percentage of users dropping out of their donation flow.
Dave turned to Hotjar Recordings to investigate why and noticed there were two conflicting CTAs on a crucial page, confusing users and causing them to abandon the process.
"Recordings were helpful to spot that because those users didn't contact us—they just didn't complete the donation.”
Having identified the problem area, Dave’s team made changes to the flow—and donations increased by a whopping 29.5%.
3. Examine heatmaps
Heatmaps are visual representations that show which parts of a page are popular (i.e. hot, which is often red) or unpopular (i.e. cold, often blue), highlighting areas responsible for drop-off and helping you understand how engaging users find your site.
There are three types of heatmaps:
Click maps, which show the most- and least-clicked elements on a page
Scroll maps, which show how far down a page users scroll
Move maps, which show mouse movement as users navigate through a page
Study all three to figure out whether your users:
Easily find CTAs and key links
Scroll far enough down a page to see vital information
Get distracted by non-clickable elements
This way, you can pinpoint which changes to make to keep your users’ attention.
With Hotjar, heatmaps are free forever
Set up heatmaps on your important pages to gain a new perspective on why drop-offs happen.

4. Run a technical analysis
More often than not, the culprit behind user drop-off is frustratingly simple: in an effort to improve the site, someone broke something. For example, a high number of subscribers may have dropped off because your product no longer loads in some browsers.
To catch this, regularly run these technical analyses on your site:
Use a website audit tool such as SEMrush, Ahrefs, or Ubersuggest to scan your site for any broken links or server errors
Check your website’s load speed with a tool like Google’s PageSpeed Insights
Ensure your site works across all devices, especially mobile, using a platform like Google’s Mobile-Friendly Test
5. Use surveys to get feedback
If you want to find out exactly what’s going on in your users’ minds when they drop off, there’s no substitute for asking them directly.
Do this at scale with an exit-intent survey—i.e. a survey that only pops up when a user navigates away from a page, asking why they’re leaving.
💡Pro tip: Hotjar offers a free exit-intent survey template you can launch and customize in a matter of minutes. It’s short and snappy with:
One multiple-choice question: “We're sorry to see you go! What's your reason for leaving?”—to collect quantitative insights
One open-ended question: “What could we do to improve?”—to collect your users’ opinions in their own words
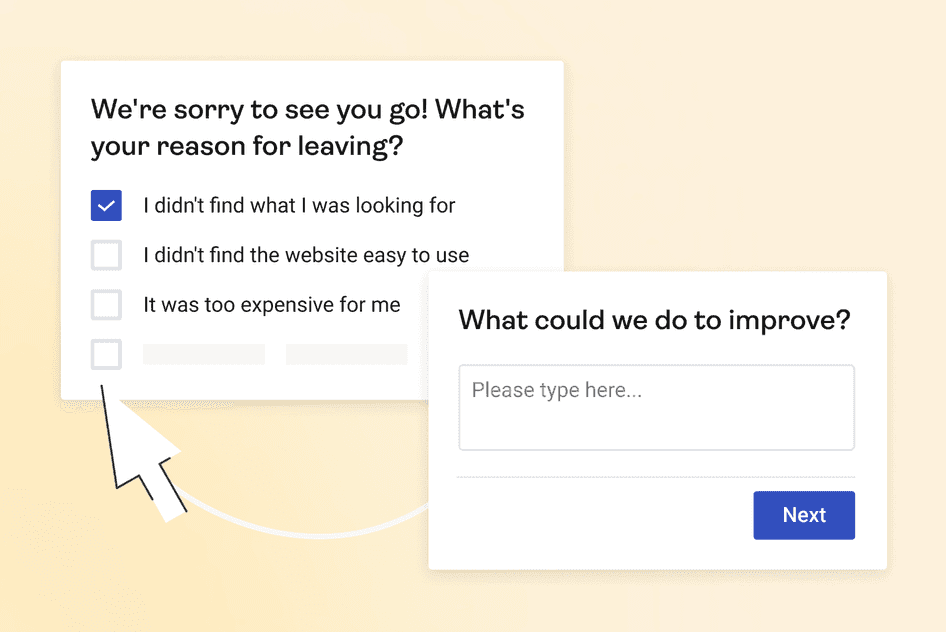
A simple survey can give you the insights you need to make impactful changes
6. Interview users
If a simple survey didn’t provide the depth of information you require for making big changes to drive engagement, dig deeper with customer interviews.
Schedule interviews with customers who used your product frequently in the past, but not in the last 30 days. Ask them to explain why they haven’t visited your site lately and what it would take for your offer to regain its initial appeal.
You’ll hear first-hand about any user experience (UX) problems behind your drop-off rates.
💡Pro tip: if you don’t have a few weeks to spare to organize your own user interviews, use Hotjar Engage to streamline the experience. It simplifies the process of recruiting participants and offers a straightforward platform to host and analyze interviews.

You can run up to two interviews per month on Hotjar’s free tier
7. Launch A/B tests
Sometimes, you’ll be almost certain that you’ve uncovered the reason your drop-off rates have been increasing—it’s as simple as a broken link or a CTA too low on the page. But other times, you might not be totally sure you’ve correctly identified the problem.
Maybe recordings have alerted you that your customers are spending a long time reading the details on your event registration page, and you think the issue has to do with the quality of the copy. But there could be another reason behind the hesitation, and you don’t want to waste time and resources fixing a problem that doesn’t exist.
If you have a hypothesis on how to improve your drop-off rates, first run an A/B test—an experiment where half your users see the current version of your page, and the other half see a new version of your web page (with the change you think would decrease drop-offs).
In a couple of weeks, you can tell whether your idea for improving drop-off worked—and whether you correctly diagnosed the issue.
💡Pro tip: take your A/B and multivariate testing to the next level with the Hotjar and Optimizely integration, and understand how users engage with and react to different versions of your product by filtering session recordings, surveys, and feedback responses by Optimizely experiments.
Bouncing back from high drop-off rates
Diving into the reasons behind website drop-offs can be a humbling experience—especially if you uncover obvious UX issues that would make it hard for any visitor to stay engaged on your site.
However, website issues are bound to sneak in when your product is constantly evolving. The important thing is to spot which elements are causing people to lose interest—by studying user behavior—so you can learn how to create better experiences and send your drop-off rates dropping through the floor.
FAQ about website user drop-off
Related articles

Solving common problems
How to evaluate the impact and reach of website bugs
Those pesky bugs. Even with the most meticulous checks possible, one or two usually make it through to production.
It’s vital to evaluate website bugs as they come up, so you know how urgently you need to fix them. Without taking a moment to assess impact, you’ll be shooting in the dark.
You might invest your precious resources in unnecessary work, or worse—underestimate the problem and cause frustrated users to take their business elsewhere.
Hotjar team

Solving common problems
Create an effective landing page using these free tools (video tutorial)
Your website is still one of your most important business tools, yet only 15% of websites average over 100,000 unique monthly visitors. In order to create successful websites that convert, consumers have access to an array of tools and features that promise to simplify their lives.
However, the overwhelming abundance of options can sometimes lead to more complications. Business owners often find themselves wondering, "How can I easily create a landing page that converts without design resources, IT support, or expensive optimization experts?"

Marc Hans

Solving common problems
10 ways Hotjar helps you understand your users better
Your sales are down; the well's running dry. What do you do to encourage people to buy from you: add a new product or service or multiply an existing product's features?
Increasing choices and features may be a business's automatic response to boost interest and, later on, conversion and sales. But more is needed to justify using company resources to create a solution that may or may not resonate with customers.
To achieve real, needle-moving change, you need to dig deeper and understand users better—what motivates or frustrates them and what hinders or helps them satisfy their 'jobs to be done'.
Hotjar team