Learn / Guides / Net Promoter Score® guide
What is Net Promoter Score®? Your introduction to NPS
Net Promoter Score® (NPS) is a customer loyalty and satisfaction measurement taken from asking customers how likely they are to recommend your product or service to others on a scale of 0-10—but there’s a lot more to the story than that.

Set up an NPS survey today
Grab a free Hotjar trial and set up an NPS survey on your website. Find out how likely your customers are to recommend you, and improve their experience—and your bottom line.

What is Net Promoter Score (NPS)?
Net Promoter Score® (NPS) is a measure used to gauge customer loyalty, satisfaction, and enthusiasm with a company, calculated by asking customers one question: “On a scale from 0 to 10, how likely are you to recommend this product/company to a friend or colleague?” Aggregate NPS scores help businesses improve upon service, customer support, delivery, etc. for increased customer loyalty.

As a business metric, NPS helps companies of all sizes organize around a mission-critical goal—increase their score by earning more enthusiastic customers—that can be easily tracked and quantified over time.
Why is NPS important?
NPS can be used as a predictor of business growth. When your company’s NPS is high (or, at least, higher than the industry average), you know that you have a healthy relationship with customers who are likely to act as evangelists for the brand, fuel word of mouth, and generate a positive growth cycle.
NPS is a valuable metric on a strategic level, but by itself, the score is not enough to be useful or paint a complete picture. The overall NPS system is important because it allows businesses to:
Ask follow-up questions as part of the standard NPS survey. By asking customers why they've given a specific score, organizations of any size can understand what they're doing well and where they could improve.
Track and quantify a score over time, creating internal benchmarks
Rally all employees around one mission-critical objective: earning more enthusiastic customers
→ Read more about the essential components of the Net Promoter System®
How to calculate NPS

NPS is calculated by subtracting the percentage of customers who answer the NPS question with a 6 or lower (known as ‘detractors’) from the percentage of customers who answer with a 9 or 10 (known as ‘promoters’).
→ Read the chapter on how to calculate NPS or simply use our NPS calculator
Net Promoter Score® scale: detractors, passives, promoters
In the Net Promoter System®, customers are categorized into three groups—promoters, detractors, or passives—depending on how they answer the standard question, “How likely are you to recommend us?”:
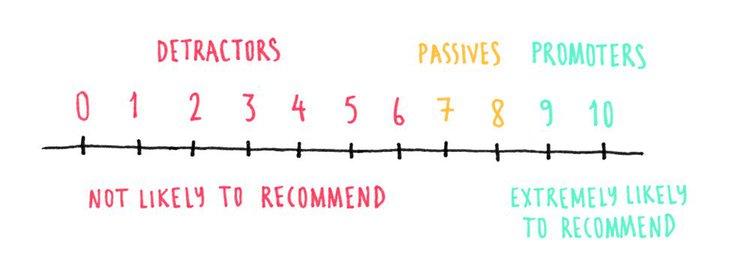
Promoters (score of 9 and 10) represent a company’s most enthusiastic and loyal customers: these people are likely to act as brand ambassadors, enhance a brand’s online reputation, and increase referral flows, helping fuel the company's growth.
Detractors (score of 0 to 6, included) are unlikely to recommend a company or product to others, probably won’t stick around or repeat purchases, and—worse—could actively discourage potential customers away from a business.
Passives (score of 7 or 8) are not actively recommending a brand, but are also unlikely to damage it with negative word of mouth. Although they are not included in the NPS calculation, passives are very close to being promoters (particularly when they give a score of 8), so it always makes strategic sense to spend time investigating what to do to win them over.
How to interpret Net Promoter Score®
Net Promoter Score® is always expressed as a number from -100 to 100; the score is negative when a company has more detractors than promoters, and positive in the opposite situation.
In the Net Promoter System®, average scores vary greatly between industries:
A 2018, US-based study by the Temkin group saw average NPS values ranging between 0 (internet and TV service providers) and 39 (auto dealers)
Another 2018, US-based study by the Temkin group found NPS averages ranging between -1 (Internet service providers) and 65 (department/specialty stores).
Knowing NPS averages by industry helps to understand how key competitors in a specific market are doing and gives extra context to what counts as a ‘good’ or ‘bad’ score.
What is a good NPS score?
Given the available -100 to +100 range, any score above 0 reads as ‘good’ because it indicates that a business has more promoters than detractors.
Top-notch companies generally have an NPS of 70 and above, but if you’re thinking this is the domain of big, global companies only, think again: in 2018, Netflix had an NPS of 64, PayPal scored 63, Amazon 54, Google 53, and Apple 49.
A perfect score of 100 indicates that every survey respondent would recommend a company to someone else—a score that nobody has ever achieved.
What is a bad NPS score?
Any score below 0 indicates that a business has more detractors than promoters. Here’s where industry NPS benchmarks like the ones mentioned above are useful: while an NPS score of -3 may seem bad in isolation, it’s hard to interpret it without comparable scores from key industry players—if the industry average was -10, suddenly the score wouldn't look as bad.
This said, even if the bar is set low, a negative NPS is a sign that a business has some serious work to do to improve the situation, reduce the number of unhappy customers, and generate more promoters.
→ Read more about NPS scores and benchmarks
How to run surveys and collect NPS feedback
If you're interested in calculating and tracking NPS for your business, the first step is to run an NPS survey to collect customer feedback. You can choose between two main ways of doing it, depending on whether you want to ask for in-the-moment feedback or collect it sometime after a customer has had any experience with your company.
1. Website survey
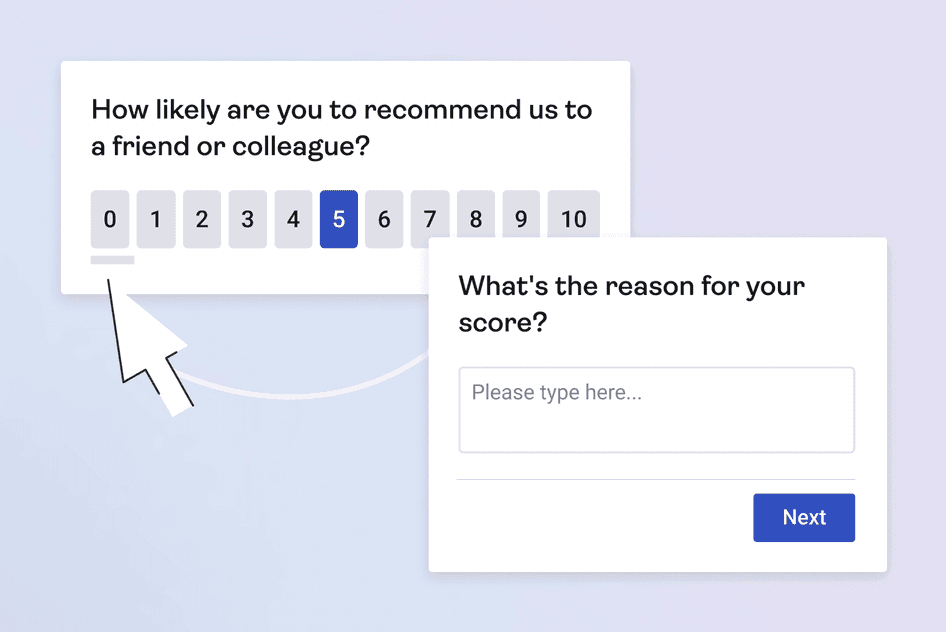
On-page/website pop-up surveys let you capture your customers’ feedback while they're still on your website. You can set up the NPS survey so it appears on your main conversion pages (for example, the thank you page people see after completing a purchase), or trigger an exit survey right before people leave the website.
To run this survey, you’d by asking the standard NPS question: “On a scale of 0 to 10, how likely are you to recommend [company] to a friend/colleague?”. For maximum value, you should always follow it up with one or two additional open-ended questions:
If the customer picks a number between 0 and 8 (detractors - passives), apologize for the negative experience and ask “What can we do to improve your score?"
If they pick a 9 or 10 (promoters), follow up with enthusiasm and investigate further by asking “What’s the main reason for your score?”
You can even add a third optional question for people to share their ideas on what else you should be doing
2. Email survey
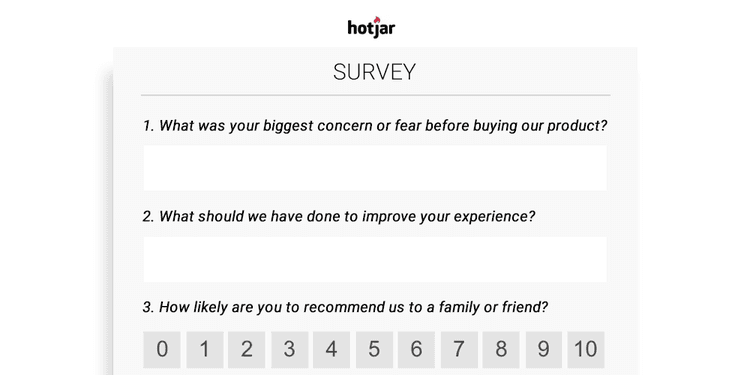
Instead of presenting people with a website pop-up, you can collect NPS data by emailing customers and inviting them to fill in a survey after a purchase or key interaction with your business.
Email surveys require a bit more work on the customers’ part (open the email → click on the survey → get taken to a separate page → fill it in and submit), and there is an obvious time delay between sending out the survey and getting results.
On the plus side, giving your customers the time to experience the product/service they received from you (for example, 15 or 30 days) might help them develop an even clearer sense of whether or not they would recommend it.
→ Read more about how to word your NPS survey questions
How to read your NPS results
Although NPS measures the likelihood of an action based on experience, it has proven to be a reliable predictor of future business growth or decline. In other words, it helps you see trouble coming both at the individual and macro customer level.
The Temkin group study quoted earlier also found a high correlation between NPS and customer experience: on average, in the US “customer experience leaders enjoy an NPS that is 21 points higher than the NPS of customer experience laggards.”
Here’s how to read your NPS results after running the survey and collecting data:
1. Look at data segments
Your company's Net Promoter Scores® may vary across different segments (e.g. age group, gender, long-term customers, higher-spending customers, etc.). When you’re just getting started with NPS you don’t need this level of depth: any information you collect at this point will help you start to paint a clear picture.
Once you're a more advanced user, you can super-charge your NPS analysis by putting segmentation systems in place and adapting your approach to different types of customers.
2. Keep tracking performance over time
Because NPS is a real-time metric, you could look at it daily if you wanted—but its true power is revealed over time when you can see trends and fluctuations:
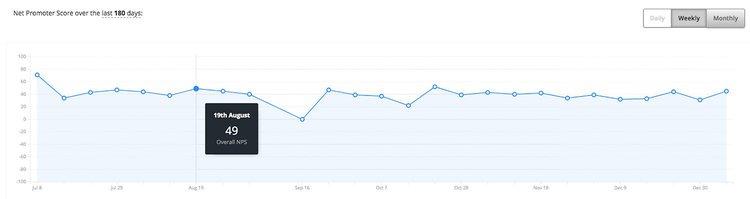
It may be difficult to get high response rates for every NPS survey you send out. For the ones that do get a large number of respondents, keep those handy as benchmarks for what to improve upon when your next survey comes around. Once you have an understanding of how NPS changes over time, you can investigate what factors may have contributed to it—which is when the next point comes in handy.
→ Read more about tracking your NPS

3. Close the loop
NPS is more than just a number: the real goldmine is the information you collect by asking follow-up questions as part of the survey (and even beyond that).
It’s crucial that you have an underlying methodology for interpreting your NPS score and that you always close the loop with customers to understand the context and reasons behind their score. Using one-to-one interviews, follow-up sessions, etc., helps you zoom in on specific issues, understand what can and should be improved, and focus your efforts in a truly customer-centric direction.
2 NPS case studies
Knowing your NPS is a great starting point, but to truly improve it—and your likelihood of business growth—you need to deep-dive into why your customers scored you the way they did. Here are two examples and stories to get you inspired:
Hotjar’s NPS case study
Like a lot of our customers, we use Hotjar to track NPS. We've been doing it for more than 5 years and learning as we go; in this article from 2018, we shared a few lessons about owning the metric, sending the NPS survey at the right time in the customer journey, segmenting the results, and closing the loop.
Taylor and Hart's NPS case study

Taylor and Hart is a London-based jeweler specializing in bespoke engagement rings. They have one of the highest NPS in the industry (80 and above), and this NPS case study covers how using Net Promoter Score® helped them secure repeat business, expand their product offerings, and grow at an impressive pace.
NPS in a nutshell
The Net Promoter Score® (NPS) measures the loyalty of a company's customer base with a score from -100 to +100, which comes from customers answering the question "How likely are you to recommend this company to a friend or colleague?"
To grow your business, you need satisfied customers or ‘promoters’ who talk about you enthusiastically and send referrals your way—and the way you measure your promoters is by checking how many people scored you 9 and 10 in an NPS survey.
NPS is a useful number for evaluating and benchmarking your business, but its real value is in the answers to the follow-up questions you get to ask as part of the survey: "What’s the main reason for your score?", "What can we do to improve our business— and your score?", and "What can we do to WOW you?" Customer satisfaction is key to getting new customers and securing old ones.
Net Promoter, Net Promoter System, Net Promoter Score, NPS, and the NPS-related emoticons are registered trademarks of Bain & Company, Inc., Fred Reichheld, and Satmetrix Systems, Inc
⚡ Master Net Promoter Score in just 5 minutes with our NPS course!