Learn / Blog / Article
How to discover what your users want to read (so you can write it for them)
At Hotjar, we use Hotjar in everything we do.
Whether it’s building, writing, scaling, designing, or hiring - Hotjar helps us make Hotjar better. We’re firm believers of practicing what we preach (and we 100% believe in our product) so using Hotjar to grow Hotjar is a must for our team.


Now to the problem: most content marketers struggle with "creating more engaging content," as evidenced by this phenomenal study put together by The Content Marketing Institute:
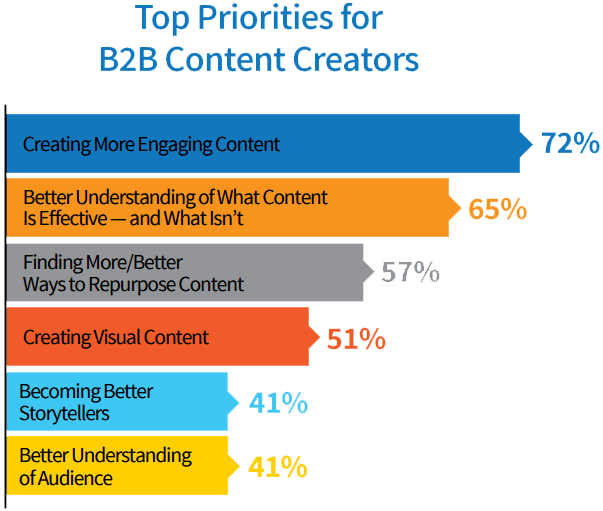
We’ve learned some really great tips over the past few years when it comes to producing content and here's the secret: you already have everything you need at your disposal to create great content.
Mining for gold
To be honest, we’re not immune to tunnel-vision.
Sure, we have our own ideas about what type of content we think you want to read on our site, but it doesn't matter what we think you want - it matters what you actually want.
Like me, I’m sure you’ve been guilty of frantically searching Google for content ideas or have spent time staring at a whiteboard hoping you’ll magically come up with some "valuable content" epiphanies. But staring at a whiteboard or scouring Google aimlessly still doesn’t help you find out what your users want.
This begs the question(s):
How do you find out what kind of content your readers want to read about?
How do you get inside the heads of the people who already regularly visit your site to find out why they visit your site?
What’s driving people to your URL? Like, literally, how are they landing on your page? How'd they get there? What does their path look like?
If you can figure out the answers to those questions, you’ll be able to build (and grow) a website that people make part of their weekly routine. And the easiest way to find out the answers to those questions…
...is to ask those questions.
How Hotjar creates user-driven content

A lot of people use Hotjar for heatmaps and recordings - and that’s all they use it for. Those are our two most popular features hands down.
But Hotjar wasn't built to be a tool used in isolation: it was built to be a total user behavior solution. If all you're doing is setting up a heatmap or recording on your page(s) without a user feedback mechanism, you’re missing out.
For instance, you could set up a heatmap on your blog page to see where people are moving and scrolling or a recording to watch them do it. But if you stop there, you’re not going to understand why you’re seeing what you're seeing.
To fully grasp why people are behaving the way they are, you need to ask them. And most of the time, they’ll tell you.
This is where user feedback surveys come in handy.
By setting up surveys along with your heatmaps and recordings, you’ll be way ahead of your competitors who aren't doing it. Look at this recording from our blog page:
What you're seeing is someone who visited our blog page, moved around a bit, and left without reading anything (i.e. they "bounced").
Sure, we can see that this person bounced rather quickly but if we just watched the recording without asking them why they bounced, we’d never know for sure why they did that. The only way to really know why users are behaving the way they’re behaving is to have them tell you.
Here’s how we ask our users what they think about the content on our blog:
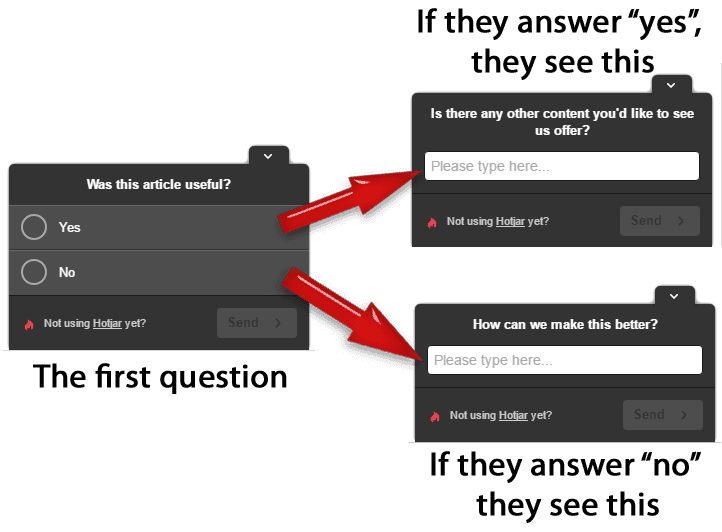
It’s simple, right?
We set up a poll, made sure that we asked the right kind of questions, and let the responses roll in. And, to get responses we always start with a simple "Yes/No" type question. Starting with a simple 2-choice question is effective because the survey doesn't come off as a huge time commitment. After the first question is answered with one click, we ask more detailed ones (open-ended). This method will help you get responses because a lot of people feel the need to finish what they start (this is called "escalation of commitment").
What do I do with the feedback?
The responses we get from our surveys are helping us understand our users and get insight into the type of content they want to see us produce (like this post you’re reading). To give you an idea of the type of responses you might get from your surveys, take a look at some of the responses we received from our blog page survey:
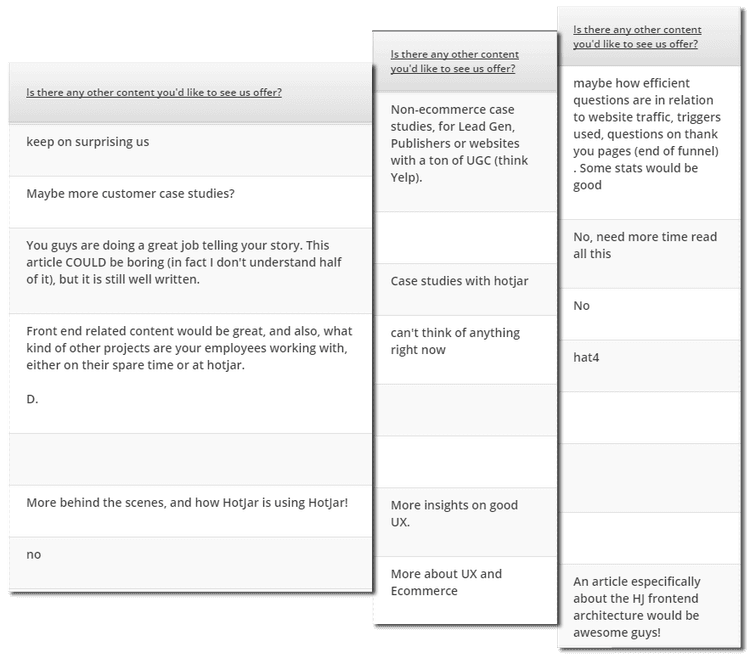
Those are only a small fraction of the hundreds of responses we've received from that survey alone. Think about what an advantage this gives you. You have your website visitors actually telling you what they think of your content and what kind of content will make them come back later.
Although Google Analytics can give you an amazing amount of data as far as time on page, site search stats, user flow, etc., it doesn't give you a way to talk to your users like polls do (and if you want to see some examples of polls, here's our Guide for Surveys that'll give you some ideas).
Now it's time to organize all those responses in a way that helps you understand your users as a whole.
How to organize survey responses
When you receive a decent amount of responses, you need a way to visualize and organize them so you can use them to help shape your content strategy.
Here’s how we do it at Hotjar:
The quick way: Trello
This way of organizing your responses is fast and will get you headed in the right direction. It’s nothing revolutionary or mind blowing, but it is a way to quickly catalog user feedback.
For this, we use Trello which is essentially a very helpful online to-do list. The basic version is free, and as far as an editorial calendar, it's simple, easy to learn, and user-friendly.
Here’s a sneak peek at our current “Blog Content” Trello board with some of the poll responses we’ve received from our blog readers in the 2nd column from the left:
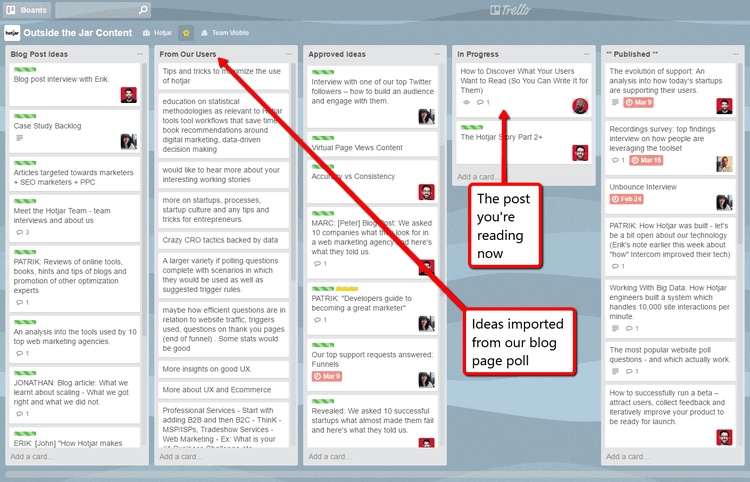
We use our Trello board as a “big idea hub.” It helps us decide the general direction we want to head in for new content and is largely based on user feedback.
When we're mapping out our week, we pick a few ideas from the Trello board, take a look at our “Survey Response” spreadsheet (below), and dissect data from Google Analytics also to help us spot trends and patterns in user behavior.
Armed with this knowledge, we now have the ability to create content knowing that it's the type of content our users will engage with.
The detailed way: our survey analysis spreadsheet
This takes a bit more time than a Trello board but it’s time well spent. Trust me. We created a template to help sort and rank poll responses by percentage and topic. This will help you notice more than just individual answers - you'll start to notice trends and patterns (e.g. a high percentage of our users asked for more content around User experience and UX design).
You can download the template here. All the instructions on how to use it are included.

Now it’s your turn
This post began with a problem: not knowing what to write about or how to create engaging content.
As I've hopefully shown you, when you combine data (from online tools like Hotjar and Google Analytics) with user insight gathered from feedback polls - the problem kind of solves itself.
So be of good cheer, you're not the only one looking for ideas on what to blog about in 2016. During an average month, tens of thousands of people searched Google for the following terms:
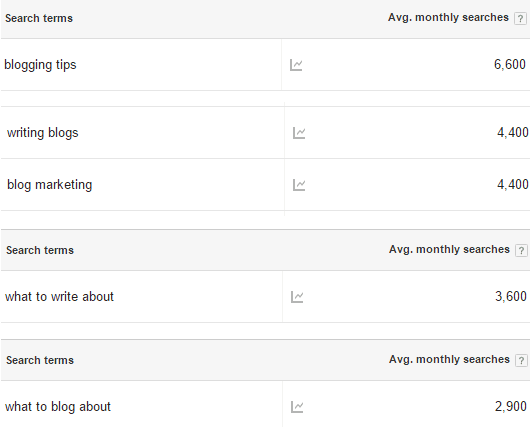
But still, at the end of the day, your users won't tell you "what to write." Only you should decide that. What they will do however is point you in the right direction.
By listening to user feedback and discovering what type of content is "engaging" or not (via metrics from analytical tools) you can align it with your business' vision (here's how we do that) and expect to get all the insights you'll ever need.
Ready to try it out? Sign in to Hotjar and get started.
Related articles

Marketing
6 traits of top marketing leaders (and how to cultivate them in yourself)
Stepping into a marketing leadership role can stir up a mix of emotions: excitement, optimism, and, often, a gnawing doubt. "Do I have the right skills to truly lead and inspire?" If you've ever wrestled with these uncertainties, you're not alone.
Hotjar team

Marketing
The 7 best BI tools for marketers in 2024 (and how to use them)
Whether you're sifting through campaign attribution data or reviewing performance reports from different sources, extracting meaningful business insights from vast amounts of data is an often daunting—yet critical—task many marketers face. So how do you efficiently evaluate your results and communicate key learnings?
This is where business intelligence (BI) tools come in, transforming raw data into actionable insights that drive informed, customer-centric decisions.
Hotjar team

Marketing
6 marketing trends that will shape the future of ecommerce in 2023
Today, marketing trends evolve at the speed of technology. Ecommerce businesses that fail to update their marketing strategies to meet consumers where they are in 2023 will be left out of the conversations that drive brand success.

Geoff Whiting