Learn / Blog / Article
The 7 best BI tools for marketers in 2024 (and how to use them)
Whether you're sifting through campaign attribution data or reviewing performance reports from different sources, extracting meaningful business insights from vast amounts of data is an often daunting—yet critical—task many marketers face. So how do you efficiently evaluate your results and communicate key learnings?
This is where business intelligence (BI) tools come in, transforming raw data into actionable insights that drive informed, customer-centric decisions.


In this article, we compare seven business intelligence software and their unique abilities to support different marketing and business goals. You'll walk away with an understanding of:
The distinct benefits and features of each BI tool
How adding BI tools to your marketing strategy improves customer satisfaction
Practical examples of how to use different BI tools
Transform your BI data into user-friendly insights
Delight your customers and optimize your business goals with Hotjar.

1. HubSpot
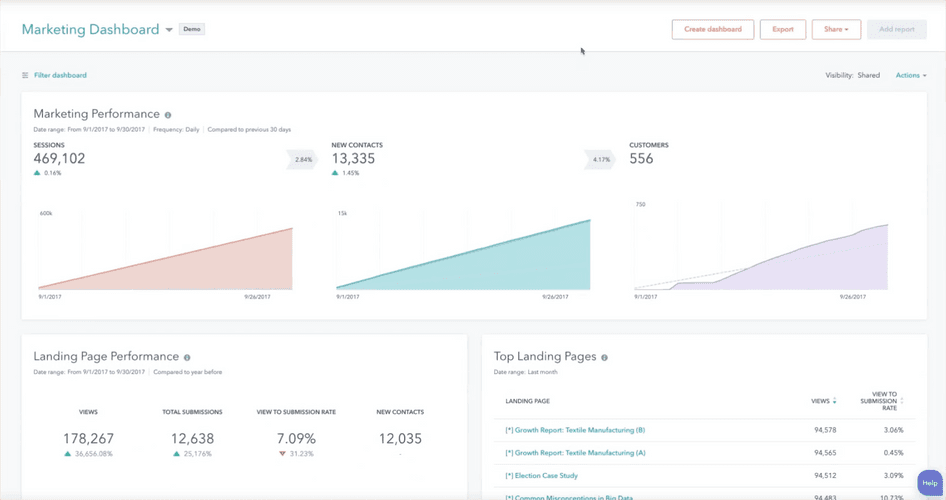
While HubSpot is widely recognized for its CRM capabilities, its Marketing Analytics and Dashboard software is a compelling BI tool for teams seeking a unified, easy-to-use interface, helping you manage content, automate marketing, evaluate site performance, and track the customer journey—without the need for SQL or coding.
Unlike many other platforms, HubSpot's marketing dashboard is designed to facilitate a deep understanding of BI through the lens of customer behavior, empowering marketers to develop targeted strategies that effectively attract, engage, and delight users.
Key features and benefits of using HubSpot for business intelligence
Multi-touch attribution: use HubSpot's multi-touch revenue attribution model to see how marketing touchpoints work together so you can drive overall revenue and campaign performance
Custom report builder: use the Custom Report Builder to consolidate cross-functional data sources—contacts, company profiles, landing page data, blog reports, and email text—into one unified location, without the need for spreadsheets
Behavior analytics: integrate HubSpot with behavior analytics platforms like Hotjar to gain an even more robust understanding of the customer experience by connecting measurable, numerical quantitative data with observational, visual qualitative data
💡 Pro tip: use the Hotjar-HubSpot integration to sharpen your marketing strategy and deliver an even more targeted experience to your customers. Here are three ways to get started:
Watch Hotjar session recordings directly in your HubSpot contact timeline to see how individual customers interact with your campaign—then use this information to tailor your content and messaging strategy
Trigger segmented HubSpot campaigns based on Hotjar user behavior data—like rage-clicks, u-turns, duration, and referrer URLs—to curate a more personalized user experience (UX), based on known customer pain points
Set up automations alerting your sales team of new Hotjar recordings for active prospects, using parameters like 'recording occurred', 'lead status', and 'contract value' for swift, context-rich notifications
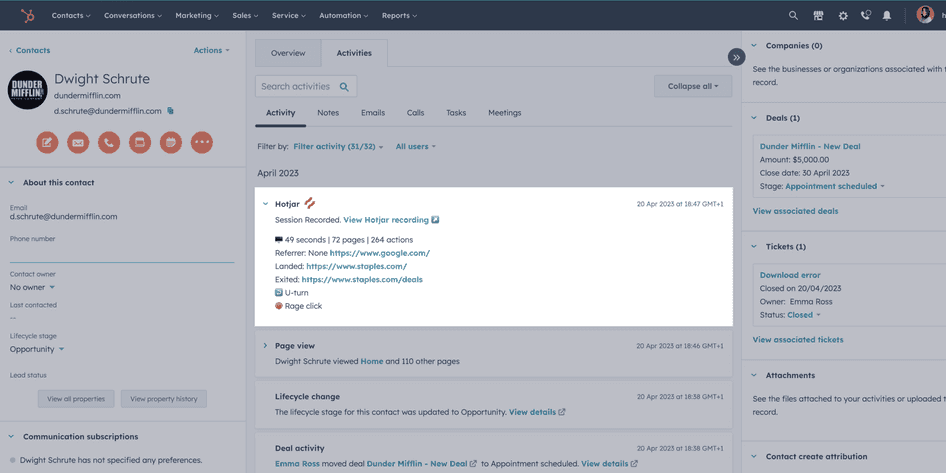
Find your customer's session recording from Hotjar linked directly in the HubSpot contact timeline
2. Sisense
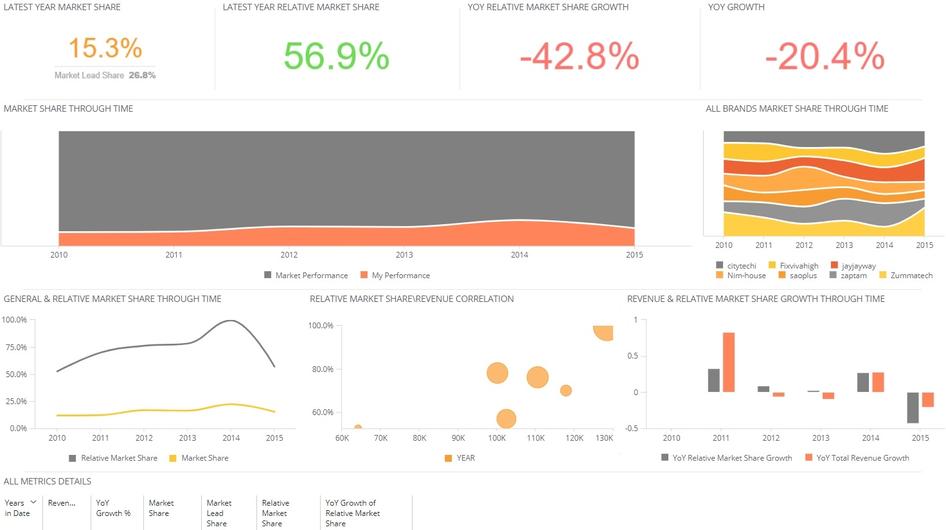
When it comes to BI tools that support scalability for rapidly growing businesses, Sisense is an excellent option.
It helps marketers efficiently leverage Big Data to shape strategies, understand their market share, and continuously delight customers, regardless of fluctuations in company size.
Key features and benefits of using Sisense for business intelligence
In-Chip® technology: use Sisense’s In-Chip® technology, which quickly processes high-volume data, to make rapid decisions and keep up in a fast-paced environment
Cloud-native architecture: harness the unlimited storage of Sisense's cloud-native architecture, ensuring your marketing operations scale effortlessly in the cloud, without having to worry about unexpected surges in data volume or customers
Dashboard library: choose from an expansive list of interactive dashboard options—such as market share, Google Adwords, and customer experience—depending on your campaign goals and number of data inputs
📊 Pro tip: balance Sisense's quantitative data analysis with Hotjar's qualitative insights.
While BI tools like Sisense offer a robust, numbers-driven approach to synthesizing high-volume data, it's easy to get caught up in overanalyzing the numbers and lose sight of what matters the most: your customer.
That's where the Hotjar Dashboard comes in, providing qualitative context about the 'why' and 'how' behind the numbers, as it relates to your users.
The Hotjar Dashboard complements Sisense's high-volume data processing by combining quantitative and qualitative insights—letting you view heatmaps of your top pages or watch recordings of your most-clicked buttons and links—ensuring your team makes product and business decisions based on real customer experiences.
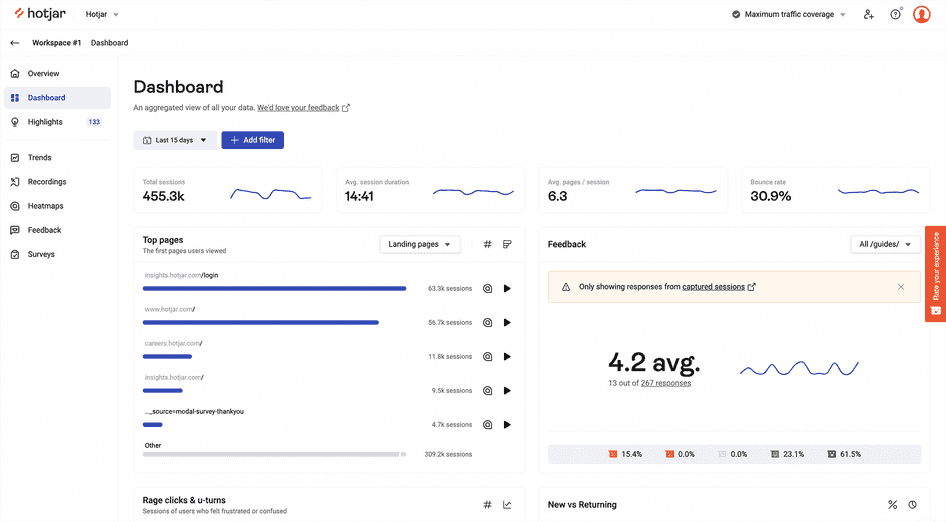
The Hotjar Dashboard provides an aggregated view of qualitative and quantitative data, keeping you closely connected to your customers
3. SimilarWeb
SimilarWeb is a competitive business intelligence platform that specializes in web analytics, giving you an in-depth look into competitors' website traffic, audience demographics, and user behavior.
SimilarWeb also provides benchmarking capabilities, enabling you to analyze competitors' online strategies, performance, and market positioning. For marketing teams, this illuminates the competitive landscape, inspires new strategies, and helps identify potential opportunities—or threats.
Key features and benefits of using SimilarWeb for business intelligence
Industry benchmarks: use the Industry Analysis tool to track industry trends, identify gaps in your own marketing approach, and stay ahead of the competition
Top pages: use the Popular Pages feature to analyze high-traffic content on your competitors' websites. Determine which topics, formats, and strategies resonate with their audience the most—and then use this information to enhance your content and messaging strategy.
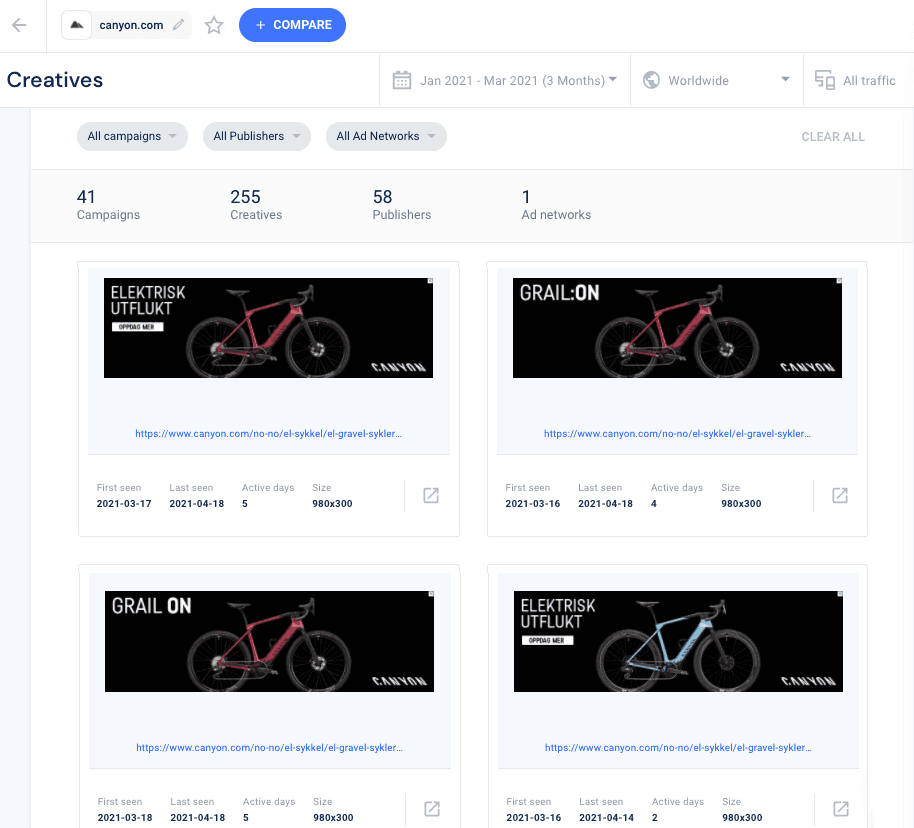
Competitor advertising analysis: use the Ad Creatives tool to understand your competitors' best-performing ads. Analyze ad content, advertising platforms, and audience segments to optimize your own marketing efforts and drive customer engagement.
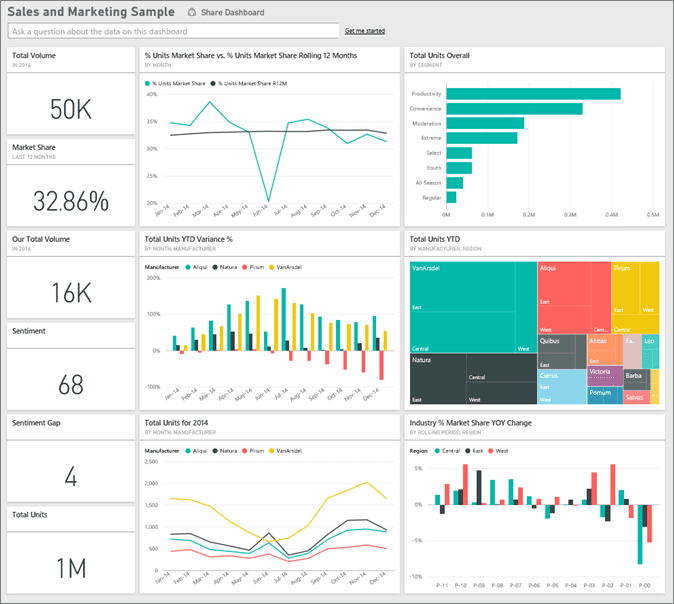
4. Tableau
Tableau is a popular enterprise BI platform with advanced data visualization and storytelling capabilities.
With a focus on transforming complex data sets into easily digestible—and beautifully designed—formats, Tableau empowers marketing teams to effectively convey crucial learnings cross-company, wrapped in an engaging style.
Key features and benefits of using Tableau for business intelligence
Intuitive user interface: promote cross-departmental collaboration by transforming unstructured marketing data into interactive charts, maps, presentations, and dashboards that are easy to share and understand
Data storytelling: win stakeholder buy-in by clearly communicating the context behind campaign numbers with advanced data storytelling features that seamlessly integrate with data science programming languages like R, Python, and MATLAB
Real-time visualization: proactively stay ahead of your campaign by monitoring performance changes in real time with dashboards that automatically refresh
📚 Pro tip: level up your BI data storytelling with Hotjar Trends.
When Tableau flags a change in user behavior patterns, like a drop in your marketing campaign's page conversion rate, analyzing hundreds or even thousands of the associated data points to pinpoint the issue could take several hours—or days.
This is where Hotjar Trends comes in. Integrating with Tableau via tray.io, Hotjar Trends instantly shows you the individual heatmaps and session recordings correlated with the change initially detected by Tableau—so you can understand the ‘why’ behind those behavior patterns to further reinforce your data storytelling strategy and troubleshoot solutions.
When there’s a spike or dip in Tableau BI data, Hotjar helps you identify the 'why' behind it
5. Cognos Analytics
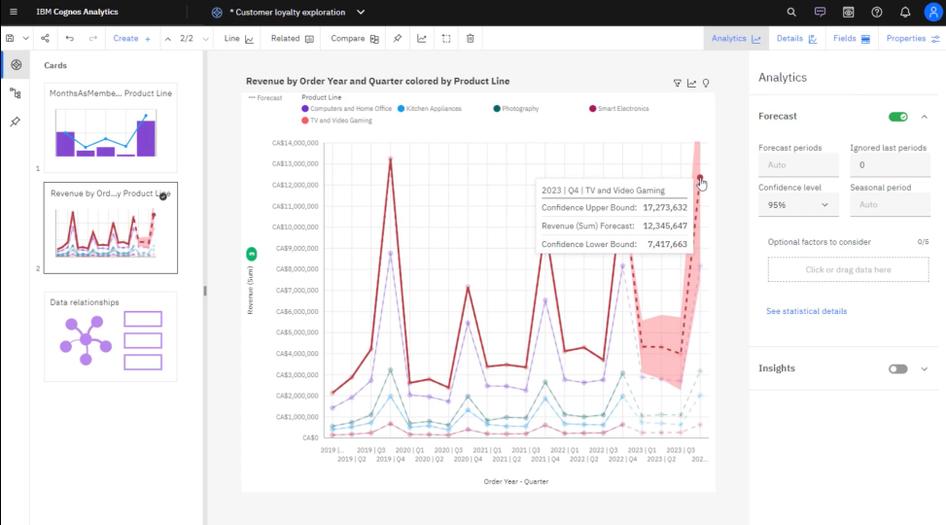
Cognos Analytics is a web-based, self-service software from IBM that takes BI a step further with advanced, AI-driven predictive analytics capabilities.
It provides an accurate, trusted, and complete picture of overall business performance, and leverages historical data and statistical algorithms to help marketers forecast trends. For example, Cognos's ability to predict customer trends empowers marketers to preemptively build timely campaigns that resonate with their target audience.
Key features and benefits of using Cognos Analytics for business intelligence
Predictive analysis: use Cognos's AI capabilities and what-if analysis to run simulations based on historical data before making campaign decisions to anticipate trends and identify potential risks
Machine-learning self-service: accelerate decision-making processes with self-service features that empower you to extract data insights and pinpoint patterns, without having to rely on data science teams
Natural language interactions: use the Natural Language Processing (NLP) feature to interact with your data in everyday language, simplifying the exploration of vast and complex customer data sets to help you make intuitive and efficient decisions
🏆 Pro tip: make the most of Cognos's predictive analysis capabilities with Hotjar Surveys and concept testing.
After reviewing Cognos's predictive analysis, leverage those key takeaways to build and test new content for your marketing campaign that is timely and relevant. Here’s how:
Use Hotjar's on-page surveys to collect user feedback and understand your customers’ perception of your new content
Test new creative assets with A/B tests or use concept testing to identify what variations—like different copy and graphics—most effectively capture your customer's interest
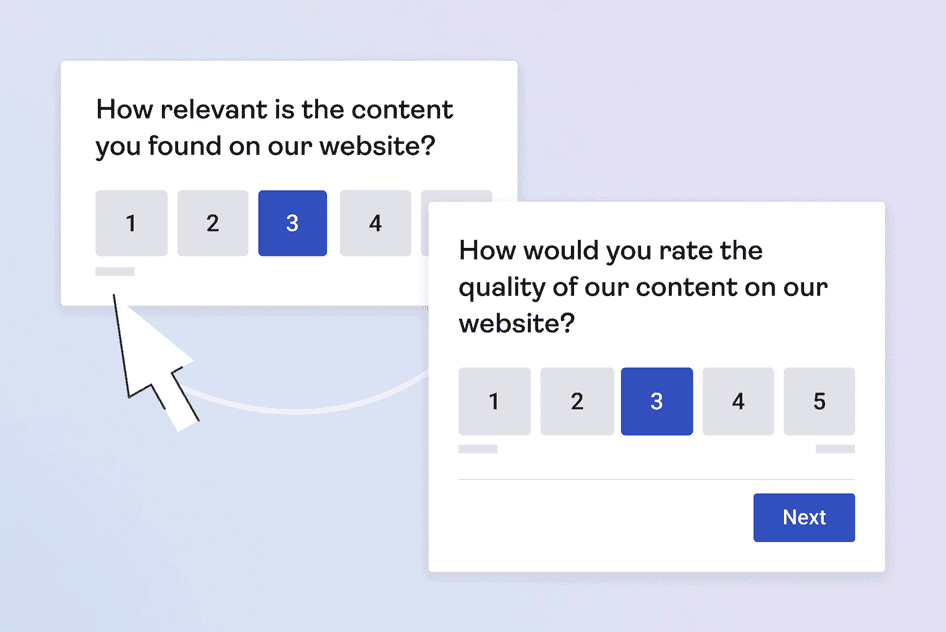
Ask users what they think of your new content using Hotjar Surveys
6. Microsoft Power BI
Power BI, developed by Microsoft, is a data visualization tool that seamlessly integrates with other Microsoft products, making it especially beneficial for teams already using (or planning to use) a Microsoft-based infrastructure. Power BI also stands out for its pricing and affordability, making it a strong option for teams with tight budgets.
Key features and benefits of using Power BI for business intelligence
Customer voice feature: combine Power BI with Microsoft's Customer Voice tool to efficiently analyze customer audio feedback and identify opportunities to improve UX or hone in on newly-identified pain points
Office 365 interconnectivity: enhance team transparency and communication by integrating data from other Office 365 tools like Outlook, OneDrive, and SharePoint
Cortana integration: use Microsoft's voice-activated digital assistant integration to verbally ask questions about your marketing data, making the data exploration process more intuitive and hands-free
7. Mixpanel
While Mixpanel primarily shines as a customer analytics platform, it holds a significant place in the BI landscape due to its ability to track and understand user behavior across multiple touchpoints. This makes Mixpanel especially useful for marketing teams working with products or services that involve several interactions before a user converts.
Key features and benefits of using Mixpanel for business intelligence
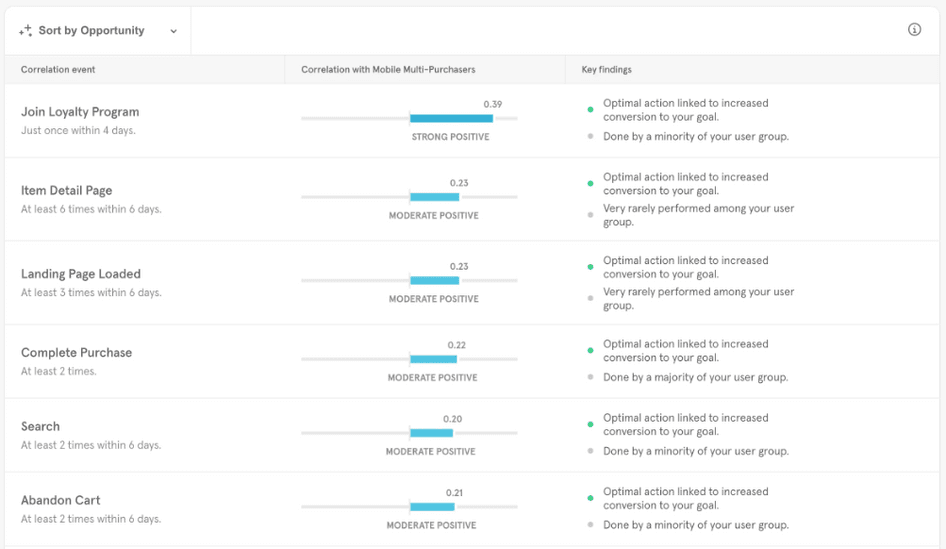
High-impact touchpoint analysis: use the Signal feature to determine which touchpoints, such as a product feature or a web page, have the greatest influence on user conversion to prioritize your optimization efforts
Multi-touch user journey timeline: filter user actions like button clicks, form submissions, or video plays to map out common multi-touch paths that users take before converting
Automatic event tracking: track user actions without needing to manually define or code each individual event
🔎 Pro tip: use the Hotjar-Mixpanel integration to get a deeper understanding of how user behavior impacts overall marketing performance.
By showing what's happening behind the numbers, this integration empowers marketing teams to:
Understand drop-offs: hone in on where drop-offs happen in your marketing funnel by reviewing recordings and heatmaps associated with specific Mixpanel events
Identify solutions: combine drop-off data with Hotjar’s existing filters—like rage clicks—so you can watch recordings of frustrated users performing a specific action and identify solutions
Collect timely feedback: ask users about their experience, goals, and frustrations by triggering a survey when they complete a key Mixpanel event in your product—so you can confidently understand their needs and ways to improve
Heatmaps identify areas of user frustration that lead to drop-offs in your marketing funnel
Use BI tools to improve your marketing performance and optimize UX
Integrating BI software into your marketing toolkit offers a direct and efficient method to bolster your campaign strategy with actionable insights.
But with so many tools available, taking the time to clearly define your business objectives and marketing goals is crucial. As a result, you and your team will spend more time delighting your customers with tailored, captivating experiences that authentically reflect their needs and preferences.
Dig deeper into BI data with Hotjar
Unlock the full potential of your BI tools with user behavior insights from Hotjar.
FAQs about BI tools
Related articles

Marketing
6 traits of top marketing leaders (and how to cultivate them in yourself)
Stepping into a marketing leadership role can stir up a mix of emotions: excitement, optimism, and, often, a gnawing doubt. "Do I have the right skills to truly lead and inspire?" If you've ever wrestled with these uncertainties, you're not alone.
Hotjar team

Marketing
6 marketing trends that will shape the future of ecommerce in 2023
Today, marketing trends evolve at the speed of technology. Ecommerce businesses that fail to update their marketing strategies to meet consumers where they are in 2023 will be left out of the conversations that drive brand success.

Geoff Whiting

Marketing
How Hotjar uses Hotjar: 9 powerful use cases
Hotjar’s heatmaps and recordings provide context to real data. Here’s how the Hotjar team uses their tools to improve site performance and marketing efforts.

Sharon Biggar