Learn / Blog / Article
7 ways real teams use Hotjar for growth (and how you can, too)
Signing up for Hotjar won’t magically optimize your website (maybe one day🤞). But, if you’re anything like the 25+ companies featured in this post, using Hotjar’s tools—like Heatmaps, Recordings, and Surveys—will give you the necessary insights to delight users and improve your metrics in the process.
Read on to learn how growing teams use Hotjar to improve conversion rates, spot bugs, and delight customers. Plus, we show you how you can iterate on their playbooks and get even more from your own optimizations.


Summary
Hotjar is used on over 1.3 million websites in 180+ countries. Here are some of the most popular ways teams use our tools to optimize their sites and products:
Spot bugs: watch recordings to find common user issues; add a feedback widget to your pages to let users report problems themselves
Increase conversions: look at heatmaps to see if CTAs are getting missed; trigger a survey to hear what customers need; monitor conversion funnels and click through to investigate drop-offs in session recordings
Improve UX: survey customers and monitor feedback scores; find the cause of rage clicks; recruit user interview participants to run tests and find usability issues
Reduce bounce and exit rate: visualize drop-offs in funnels; see what leads to exits by watching recordings; run an exit page survey to understand why people leave
Find what’s causing sudden drops: monitor custom trends; investigate changes by watching recordings; create clips and share highlights to take action fast
Reduce churn: trigger a churn survey to find out why people unsubscribe; survey users to learn their JTBD
Continuous discovery: Hotjar isn't just for one-off projects; teams use it to continually optimize their websites and products year-round
1. Spot bugs
While not the most glamorous optimization activity, we’re starting this list with bug-spotting because a lot of our customers are surprised by how quickly they found—sometimes without even meaning to—simple-to-fix website issues soon after installing Hotjar.
Here are some quick wins to inspire you to get bug-hunting right away:
Reviewing Hotjar recordings—replays of real user browsing sessions—during a website migration allowed the team at fashion retailer Matalan to find checkout bugs early on, leading to a 1.23% improvement in their checkout conversion rate
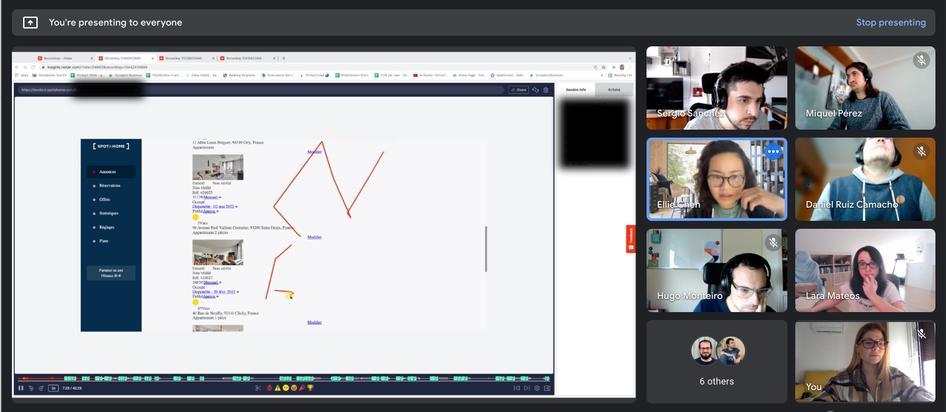
The team at Spotahome, an online rental platform, accidentally found a bug in the site’s booking process during one of their Hotjar Watch Parties (yes, that’s a thing). By reviewing session recordings as a cross-functional team, developers were able to spot (then fix) a broken button that wasn’t immediately obvious to the rest of the group.
Taskworld, a project planning and messaging app, used Hotjar Heatmaps to visualize where users clicked when trying to sign up. By seeing where users clicked the most, the team spotted a critical problem that was fixed in 5 minutes, boosting conversions by 40% in the process.

Manufacturing software company Intelliquip used session recordings to oversee the onboarding of 10,000 existing users onto a new portal. Jon Kern, Manager of Strategic Products, quickly found bugs (like users getting stuck in an email confirmation loop or confusing UI elements in the Spanish translation) and his team used an iterative process to roll out fixes before problems escalated.

Aside from making you consider investing in a new standing desk and treadmill combo, the number one thing we want you to take away from these success stories is this: if you’re not looking at what’s happening on your site (and listening to user feedback), you’re going to miss some obvious, quick-fix, revenue-leaching bugs.
Here are a couple more ways you can put Hotjar’s full suite to work and actively monitor for bugs:
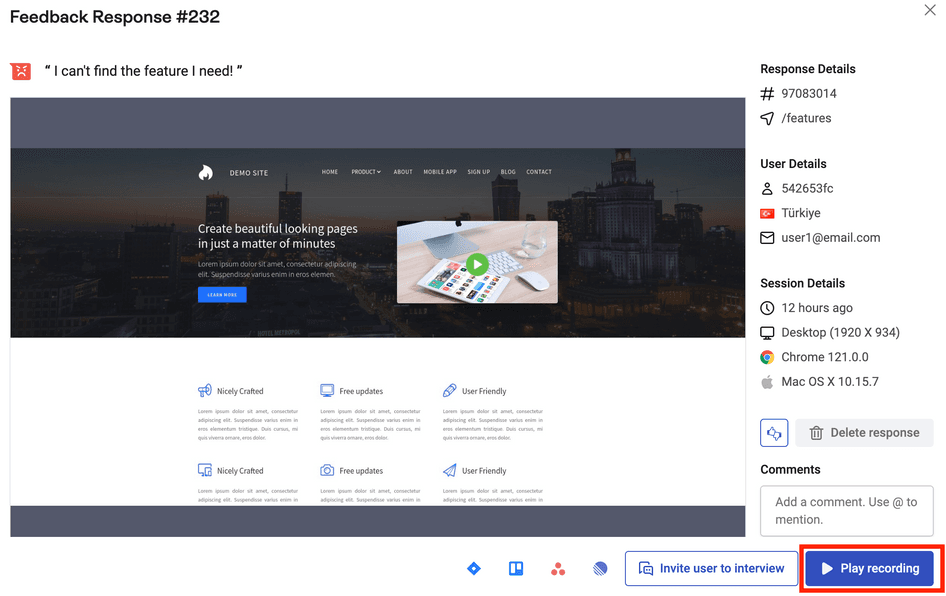
Use a Hotjar Feedback widget—a clickable button for any page—as a low-friction way to collect user feedback. When you see a comment about a problem or missing functionality (e.g. “This button doesn’t work!”), click through to view the related session recording so you can better understand what needs fixing.
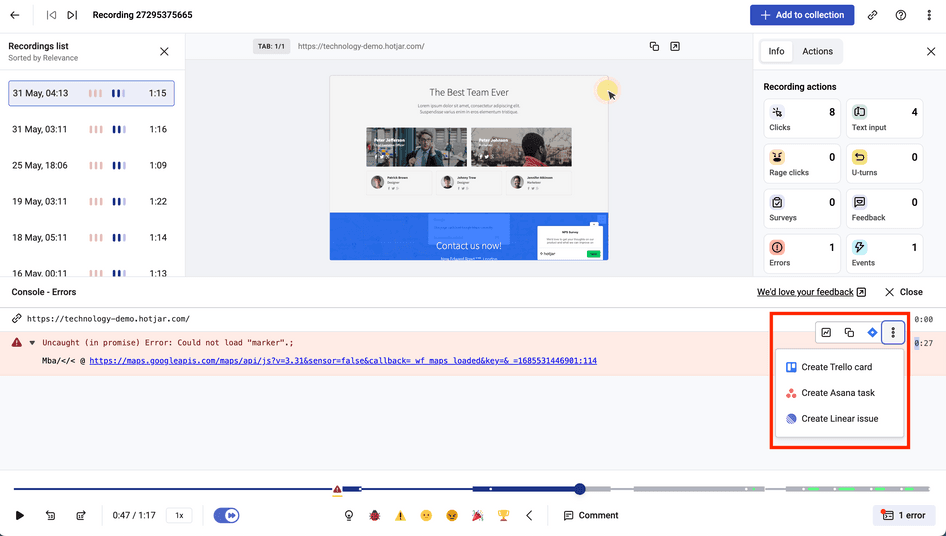
Use Hotjar’s console tracking feature to monitor for JavaScript errors. Click to create a Jira issue so developers can jump straight to the recording instead of needing to recreate the problem themselves
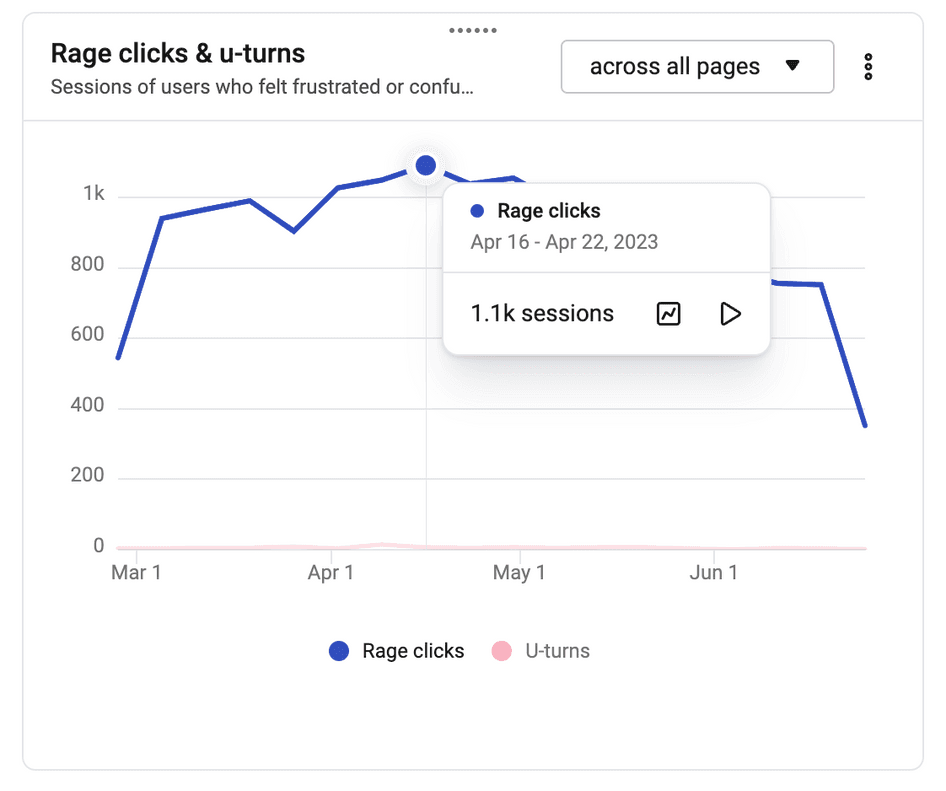
Monitor rage clicks in Hotjar Dashboards—customizable metrics dashboards—so you can quickly spot an unusual increase. If you see a spike, click the play icon to view related session recordings and see what led to the frustration.
Use Hotjar to grow like a pro
Hit your growth goals this year with insights from Heatmaps, Recordings, Feedback, and Funnels.

2. Increase conversions
Conversion rate means different things to different companies and we’ve seen teams approach increasing it in many, many different ways—from fixing bugs (see above!) to A/B testing redesigns.
Here are some of the diverse ways companies used Hotjar to increase their conversion rates—use them as a starting point for your own optimizations.
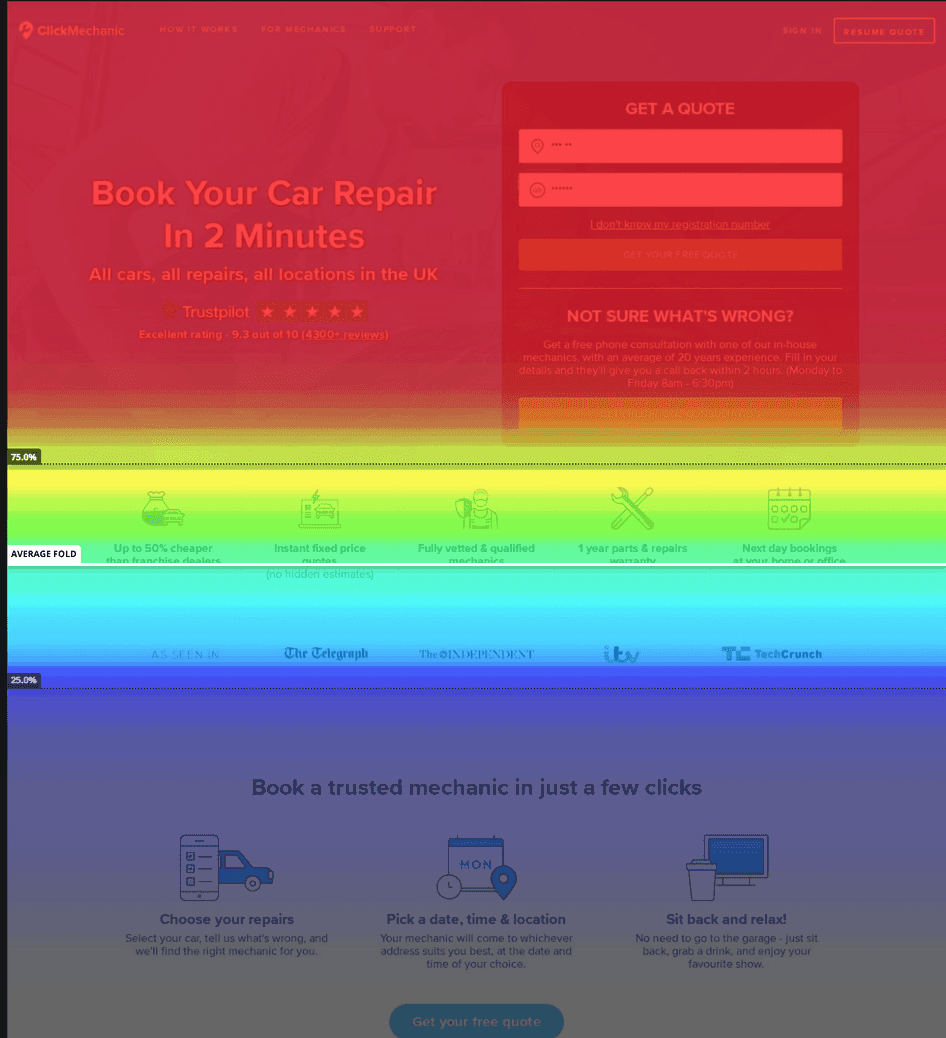
ClickMechanic, an auto repair marketplace, used scroll maps to discover that most landing page visitors didn’t scroll far down enough to see key CTAs. They redesigned the page and brought their ‘get a quote’ box above the fold, leading to a 15% boost in conversions.
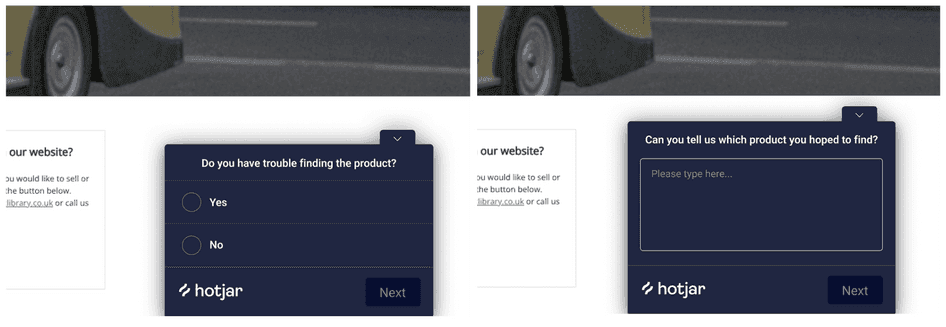
Web design agency NerdCow achieved a 300% increase in conversions for ecommerce site The Transport Library by watching session recordings (spotting users struggling with the search feature), then added a pop-over survey to search pages to get more context about what visitors were trying to find. Combining qualitative and quantitative insights, the team redesigned the search bar and added ‘new’ and ‘already viewed’ tags to listings, improving the search experience for visitors and leading to the conversion uplift.
Bannersnack, an online banner design tool, used heatmaps to visualize where visitors clicked on landing pages, then A/B tested changes while still monitoring clicks on new variants. After a few iterations, the team grew sign-up conversions by 25%.
Fleet management software company Vimcar used insights from click maps, scroll maps, and session recordings to learn that 75% of visitors didn’t scroll to a main CTA and users were clicking unlinked images. They rolled out quick fixes that increased leads by 24%.
Whichever metric you’re trying to improve, our customers have shown us that the best approach is to focus on understanding how users behave, not how your metrics do. Here’s a handy way to combine both:
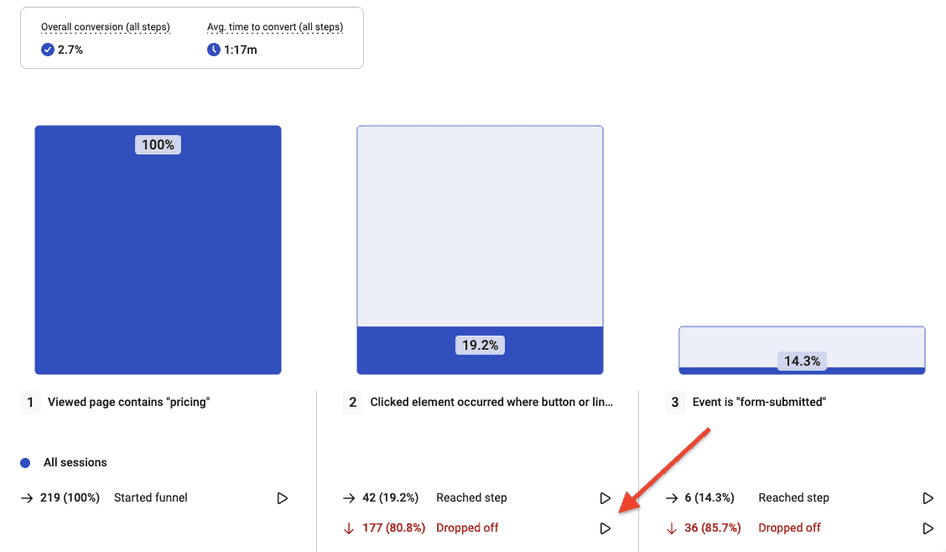
Track custom conversion rates in Hotjar Funnels, mapping the most common user journeys to your ideal outcome, like add-to-cart clicks, completed purchases, or sign-ups. Understand what leads to drop-offs by clicking straight through to relevant session recordings. For bonus points: track your key conversion funnels in Dashboards so you’ll be quick to react to sudden dips (or congratulate your team when things are trending up).
3. Improve UX
Improving user experience (UX) is not mutually exclusive from the other goals we’ve already covered above—better UX is often a by-product of other optimization efforts because happy users drive growth.
But if a better user experience is your primary goal, have a look at how our customers used Hotjar to understand their users:
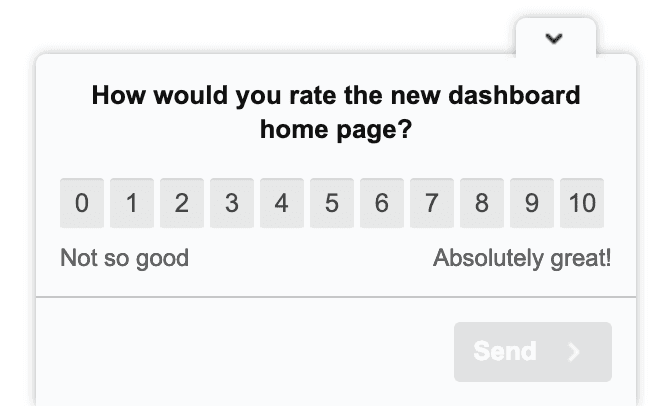
Online payment solution Razorpay used Hotjar Surveys to test the UX of a redesigned customer dashboard (smartly rolling the change out to 10% of users first). The simple pop-over survey asked users to rate the new dashboard and give context with an open-ended response. The team incorporated the feedback into new iterations and eventually raised the dashboard’s average rating from 6.2 to 8.7.
Every.org, a charity donation platform, used session recordings to identify areas of user frustration. Dave Sharp, Senior Product Designer, filtered recordings by rage clicks and found a pattern: users couldn’t click the ‘donate’ button before adding a credit card, resulting in confused users bouncing from the site. Dave changed the donation flow to have two steps instead of an all-in-one form (the supposed ‘best practice’), resulting in a 29.5% increase in donations.
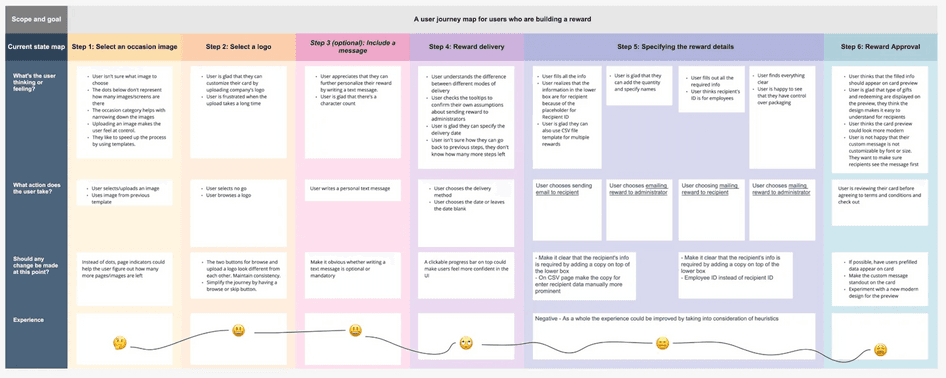
UX studio, a UI/UX design and research consultancy, used Hotjar Engage to recruit user interview participants for employee recognition platform Reward Builder, matching the company’s target audience (small business owners, logistics directors, sales representatives, and design leads). Through interviews and usability tests, the team created a user journey map that highlighted design-related usability issues.
European airline Ryanair used Hotjar Surveys to improve customer satisfaction (CSAT). Open-ended questions helped them understand common pain points to address in optimizations and closed-ended questions provided quantifiable CSAT metrics so they could track UX improvements and report changes to stakeholders.
The UX team at DashThis, a marketing reporting tool, watched session recordings to find common issues causing users to drop off the onboarding process (like a hidden functionality on certain screen resolutions). Several small tweaks led to a 140% increase in customer satisfaction, based on Net Promoter Score® survey feedback, while onboarding completion increased by 50%. Two metrics, one stone!
If you’re eager to start improving UX on your site or product, here are a couple more ways Hotjar makes the process more efficient:
Instead of manually sorting open-ended responses, use Hotjar’s AI features to generate a survey report highlighting key findings and quotes
Apply one-click sentiment analysis to open-ended survey responses to track changes in user sentiment over time
🎬 Peek behind the scenes: learn more about how we use Hotjar for interaction design in-house.
4. Reduce bounce and exit rates
The only businesses that want their customers bouncing are trampoline sellers. Here are some of the different approaches Hotjar customers have taken to reduce bounce rate and exits on their sites:
The team at Gogoprint, an online printing service provider, used Google Analytics to identify bounce rate problems, then used Hotjar Funnels to visualize where users dropped off in the customer journey. Then, by reviewing heatmaps and recordings, Piriya Kantong, Senior Online Marketing Analyst, identified a pricing table bug and A/B tested a fix, leading to a 7% decrease in page drop-off rate.
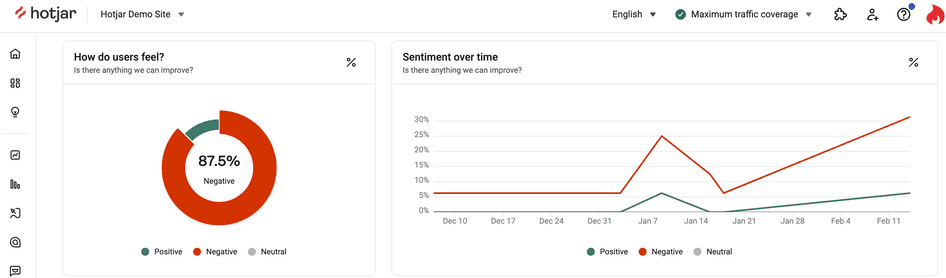
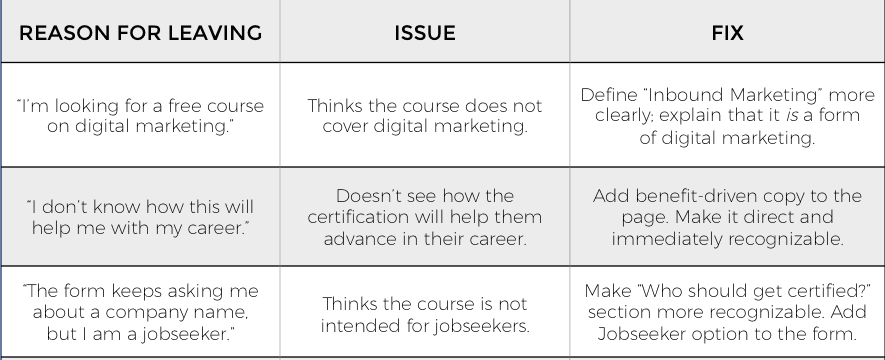
HubSpot Academy, HubSpot’s online training platform, used Hotjar Surveys to trigger an exit intent survey to find out why users were about to bounce. The results revealed a lot of unclear messaging. Eric Peters, Senior Growth Marketer, A/B tested improvements and winning variants led to a 10% uplift in conversions.
Here’s another exit survey success: UX and CRO agency Turum-burum triggered a survey when users were bouncing from fashion retailer Intertop’s checkout and discovered that 48.6% of respondents were unable to place orders due to confusing elements. After A/B testing fixes, the team decreased checkout bounce rate by 13.4%.
If high bounce rates are keeping you up at night, here are a few more ways to bring them down with Hotjar’s latest features:
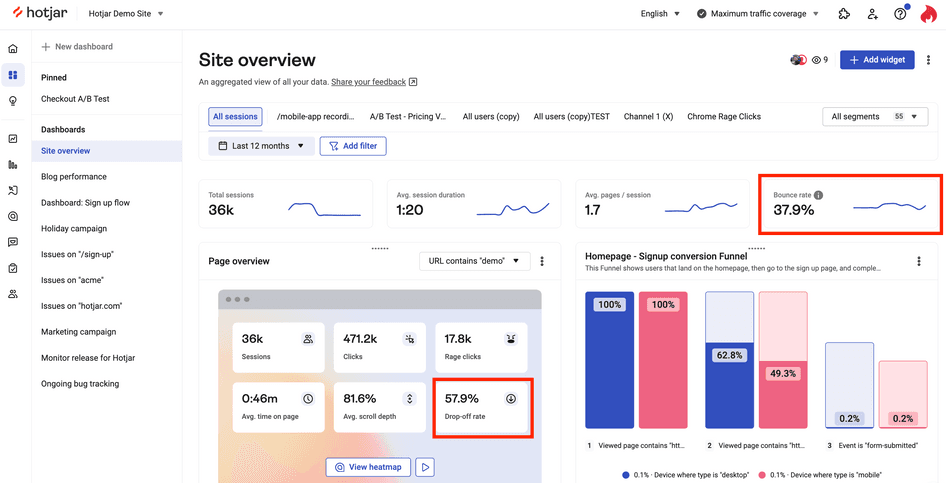
Use Hotjar for data analytics and monitor sitewide and page-specific bounce and drop-off rates in Dashboards, so you can spot sudden changes before they escalate
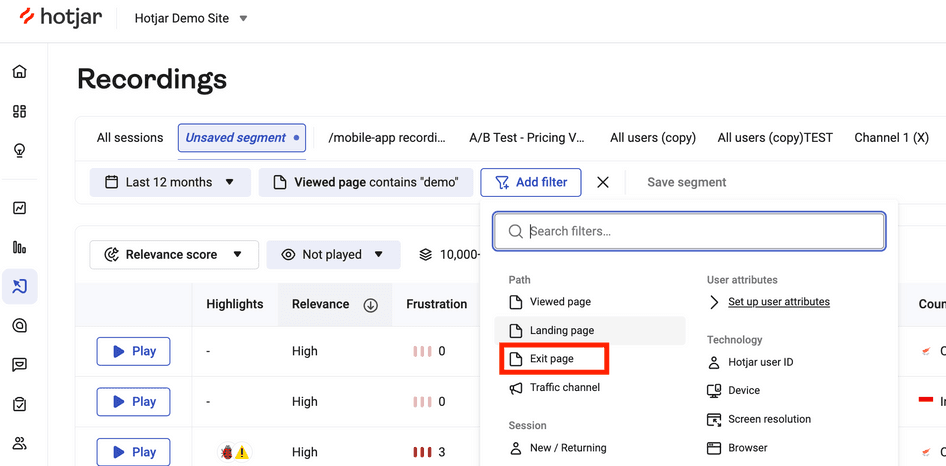
Filter recordings and heatmaps by ‘exit page’ to review sessions of users who bounced from any page you select. See what caused people to leave—did they rage-click in frustration, scroll up and down looking for something, or encounter a broken element?—so you can make the necessary improvements.
5. Find what’s causing sudden drops
Optimization is rarely a happy, linear path to continued growth. Here’s how Hotjar customers have dealt with those times when redesigns, rollouts, and an ever-changing technical landscape caused sudden drops in performance:
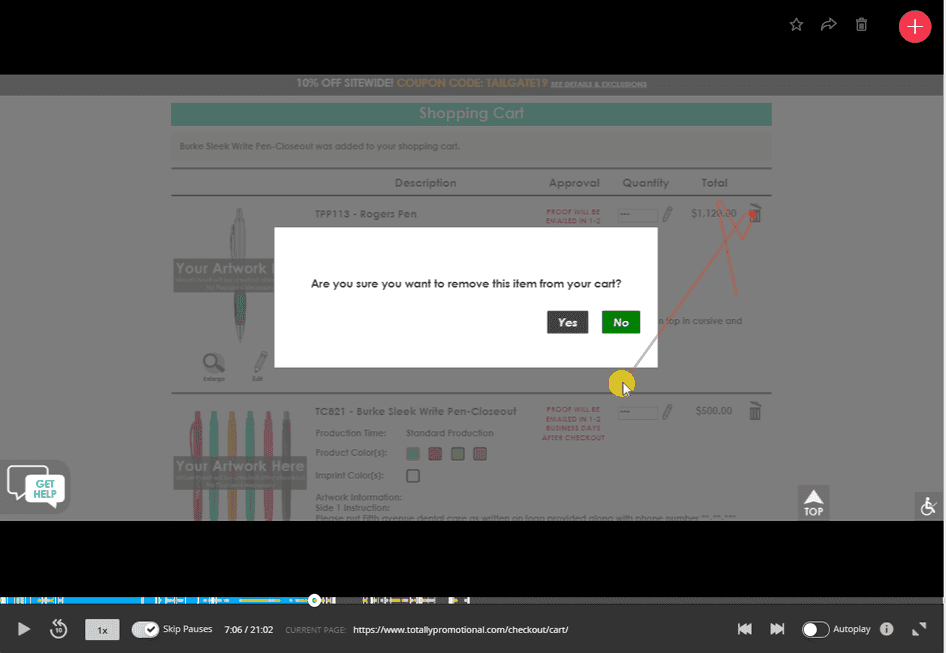
Totally Promotional, a promotional products retailer, used session recordings to troubleshoot underperforming sales of a new custom pen. Rachel Stephens, SEO & Customer Behavior Analyst, spotted issues in the order process and made changes that led to a 300% increase in pen sales.
MarTech SaaS startup Audiense used session recordings to investigate a sudden drop-off in sign-ups. The team found a broken password validator, fixed it within hours, and conversions returned to normal. Phew!
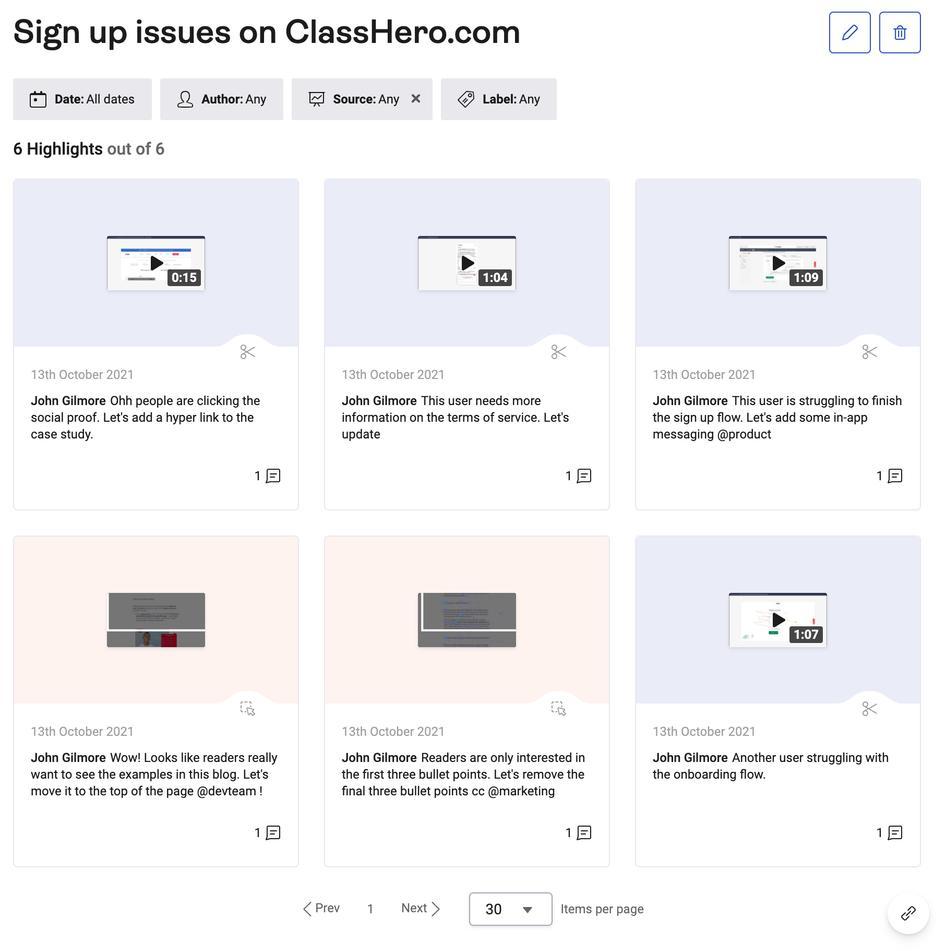
When John Gilmore, Sales Operations Manager at ClassHero, a math learning platform, saw their onboarding completion rate drop from 75% to 37%, he reviewed recordings and found issues with an auto-complete feature and broken drop-down fields. John then created highlights—shareable snippets of recordings and heatmaps—of every problem, and added tags and comments to let the product team know exactly what to fix (and how). Onboarding rates returned to normal in just a week.
As you’ve seen, recordings are the go-to Hotjar tool for troubleshooting dips because, as long as you’ve enabled session capture, they’re always on. You can go back in time, DeLorean style, to review the cause of a sudden drop in your key metrics.
Here’s another way to make better use of Hotjar’s features and catch problems before they snowball:
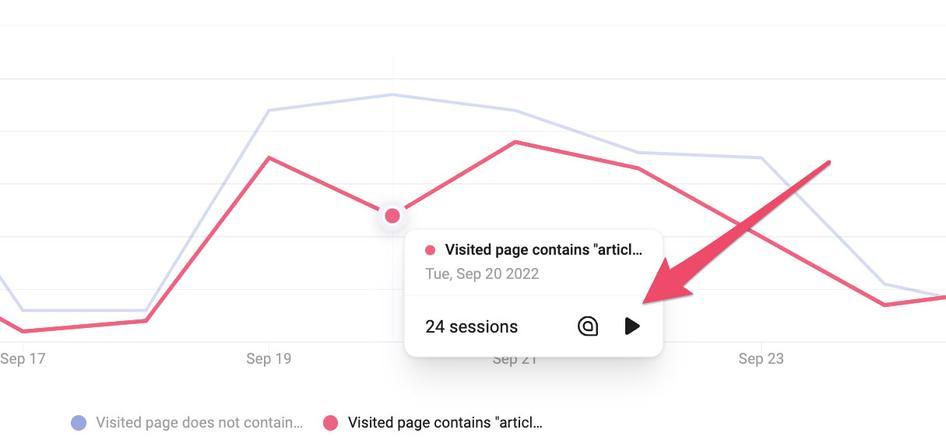
Create custom metrics in Hotjar Trends and monitor them in Hotjar Dashboards. If you spot a sudden change, you’ll be in the right place to click through to relevant recordings and heatmaps to find out what’s wrong.
6. Reduce churn
Reducing churn (or improving retention) is the primary goal for many of the product teams using Hotjar. If your stomach churns at the thought of losing your subscriber base to the c-word, these case studies will give you a couple of impactful ways to tackle it head-on:
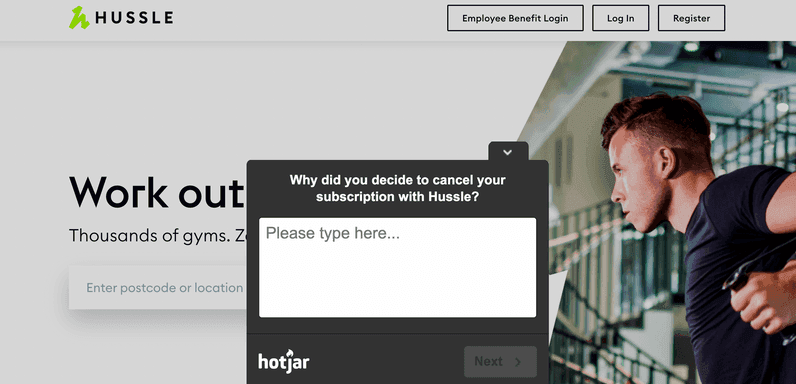
Hussle, an online gym marketplace, used Hotjar to trigger a churn survey right when users unsubscribed. Luke Calton, Product Lead, identified common reasons for churn (like prices being too high or users buying directly instead) and optimized the product accordingly (allowing users to buy single-gym memberships through the platform) to improve retention.
Ausmed, an online healthcare training platform, tackled retention by zooming all the way out and using Hotjar to survey existing users and find their core jobs to be done (JTBDs). Responses revealed the platform’s core benefit (ease of documenting continuing professional development), so the team then optimized the product experience to help users achieve value quickly.
Public sector club Boundless used Hotjar to survey users who didn’t renew their memberships. Results showed 25% of users were having problems with the renewal process. The team also watched session recordings to learn what exactly was leading users to quit. After rolling out optimizations, the rate of users experiencing issues during renewal dropped to 0%.
A few years back, we also had a bit of a churn problem at Hotjar (revenue churn was at 32% after one year 😬). The first thing we did to solve it…you guessed it: we added a churn survey! Knowing the three main reasons why accounts churned (project ended, data overwhelm, and usability issues) informed all our optimizations moving forward. And if you want to hear us talk at length about more of our mistakes, here are 7 ways we found and fixed UX fails using Hotjar.
💡 Pro tip: we’ve come a long way since word clouds—save time by generating a one-click summary of top churn survey findings with Hotjar’s AI survey report feature.
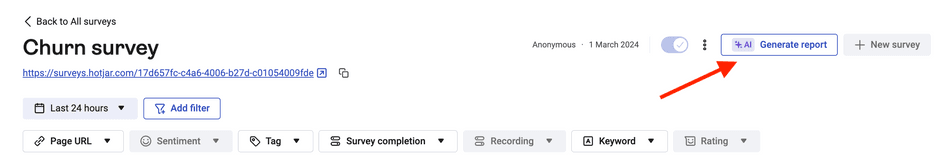
Get a summary of your survey responses and next steps with Hotjar AI
7. Continuous discovery
Growing a website or product is not a one-and-done activity; it’s an iterative cycle of improvements. Another benefit of taking an ‘always-on’ approach to collecting user behavior data is that knowing your customers better helps inform and improve almost every business function, from marketing to customer support.
Here are a couple more ways smart teams used Hotjar to grow:
The team at GPS manufacturer TomTom used survey responses to write more compelling copy for email campaigns and landing pages, leading to a 491% increase in email CTR and a 49% increase in landing page conversions
The team at CadoMaestro, a personalized gift marketplace, surveyed users to quantify demand for new product offerings
The team behind digital agency Stream Creative used the benefits of Hotjar to attract new clients and add $120,000 in revenue—you can do the same by joining our partner program and earning up to 25% of referral revenue
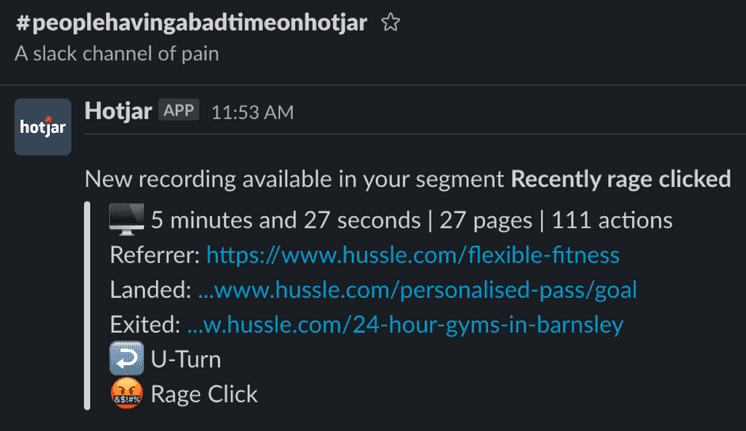
The team at Hussle used Hotjar’s Slack integration to get notified every time a new recording contained rage clicks, helping them get ahead of emerging issues before they affected more users
Add your success story to our growing list
If you’ve read this far, you’ve probably noticed that when teams use Hotjar to focus on improving one metric, like reducing bounce rate or increasing sign-ups, they often end up improving customer satisfaction and NPS, too. That’s because Hotjar’s tools are built around one core principle: growing by putting user needs first.
Whatever your North Star success metric is, Hotjar's mix of quantitative and qualitative tools gives you the right insights to reach it. It’s not quite magic, but our users are certainly impressed. And, most importantly, so are their users. 😁
Use Hotjar to grow like a pro
Hit your growth goals this year with insights from Heatmaps, Recordings, Feedback, and Funnels.