Learn / Blog / Article
10 ways to improve your data analytics processes using Hotjar
As your team's data partner, you empower colleagues to make predictions and decisions by seeking out valuable insights into your users, products, or services. But who—or what—empowers you? What data analytics tools do you rely on to accomplish your day-to-day work?
If you still need to find your go-to solution, try Hotjar.


Hotjar is more than just a tool: it’s a powerful, all-in-one platform for collecting, analyzing, and communicating user behavior and product experience data. And you don’t have to be a coding or design wizard to start telling a story with Hotjar analytics data.
All you need is inspiration and a few ideas for using our tools and features—like Recordings, Heatmaps, Surveys, Dashboards, and Trends—on the fly. Here are the ten best ways to help you get started.
Understand the reason behind user behavior by capturing Recordings and Heatmaps
Collect user data directly and quantify customer loyalty through an NPS survey
Build an evidence-based hypothesis for A/B tests based on exit survey responses
Get a high-level, visual view of user metrics via Dashboards
Compare and analyze important metrics across segments with Trends
Export UX and behavior data to other tools through the Hotjar API
Save meaningful insights in one place and share them later with Highlights
Find answers and solve problems fast
The Hotjar platform has the right tools and features you need to analyze data in a breeze.

10 ways Hotjar helps with data analytics
Imagine having access to multiple tools and features from one platform—all designed to complement one another and deliver enhanced insights. Now turn that imagination into reality by making the most of combined quantitative and qualitative analysis using Hotjar.
Let’s dive in.
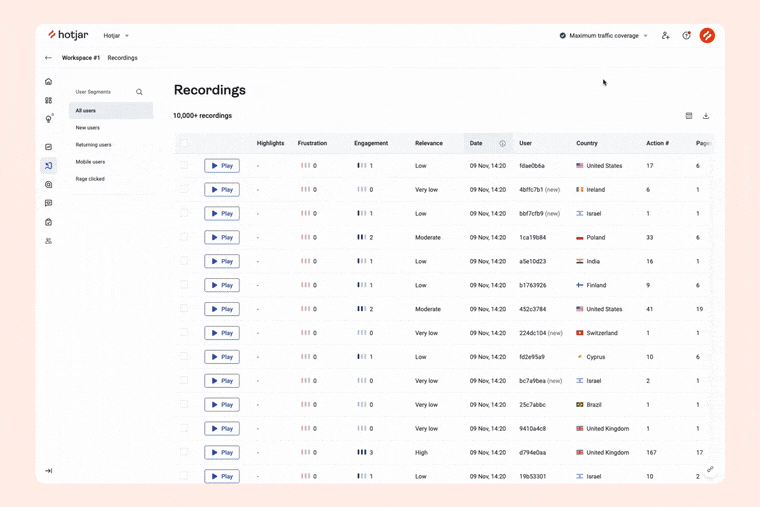
1. Understand the reason behind user behavior by capturing Recordings and Heatmaps
Traditional web analytics answers questions like How many people buy Product X? or Where do users drop off on our site? In other words, it tells you what is happening on your website or app.
Behavioral analytics takes it up a notch by showing you why something happened. Tools like Hotjar Recordings and Heatmaps capture user behavior and interactions so you can improve the experience accordingly—much like when you assist a confused shopper walking down the aisles of a brick-and-mortar store.
These are just a few ways to take advantage of these tools for data collection and analysis:
Heatmaps: for each of your key pages, such as your homepage or product page, see where users click on the most to ensure call-to-action (CTA) buttons, links, and other elements work as they should. You can also view scroll maps or Engagement Zones in heatmaps to learn the most engaging parts of your content.
Recordings: watch relevant session recordings to investigate why certain users rage click on an element or within an area (the button might be broken, or users may think the area is clickable when it’s not). Observe whether there’s a pattern among users dropping off without completing a purchase on your checkout page.
2. Collect user data directly and quantify customer loyalty through an NPS survey
Hotjar Surveys adds color and spice to the quantitative data you deal with every day. Let’s take the Net Promoter Score® (NPS®), a global standard in measuring customer satisfaction and loyalty. NPS asks respondents a single question:
On a scale from 0 to 10, how likely are you to recommend this product/company to a friend or colleague?
When you create an NPS survey in Hotjar, you can also directly inquire about your customers’ thoughts and experiences. This survey type enables you to ask and analyze open-ended questions, such as, What's the reason for your score? and What could we do to improve your experience?
People’s candid responses are a great source of qualitative insights, giving you an overview of what they love or hate.
💡 Did you know? Hotjar generates summary reports instantly with artificial intelligence (AI). Think of Hotjar AI as your survey assistant, scanning your findings and pinpointing user issues that need your urgent attention.
It takes me 10 or 15 minutes to put a survey together, then it goes live, and by the next day, I've got at least some data to answer my questions. This was the big surprise for me—surveys alone make the subscription worth it.
3. Keep your data clean and relevant using Events
You already know this: cleaning up your data is a crucial early step in the data analytics process. For example, it’s not best practice to contaminate your product, marketing, or customer experience analytics with data from employees within your own company who
Work remotely
Visit your site
Sign up for different campaigns and even convert
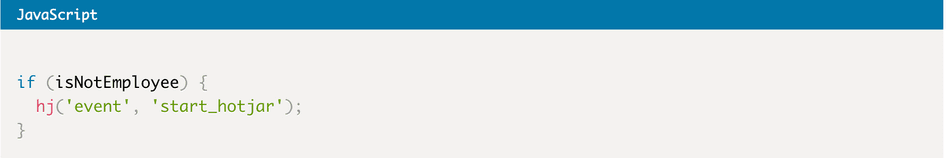
To help keep your data accurate, you can exclude your employees from Hotjar tracking using Events (instead of IP blocking). This involves assigning an employee cookie and adjusting your site’s code to send an event to Hotjar only if the employee cookie isn’t present. Check out the step-by-step instructions in our Help Center.
4. Build an evidence-based hypothesis for A/B tests based on exit survey responses
A/B testing or split testing begins with a hypothesis. For example, you propose to your development team: if we change X, it will enhance the user experience (UX) and, in turn, improve metric Y.
To formulate a hypothesis, you need to do some informal research. Dig into quantitative and qualitative data to come up with worthwhile ideas. For the latter, you can use Surveys to hear straight from customers about their actual experience with your site, product, or service.
With an exit intent survey, specifically, it’s easier to ask for the reason people drop off a certain page. Include an open-ended question to get clues from your customers on what you can improve.
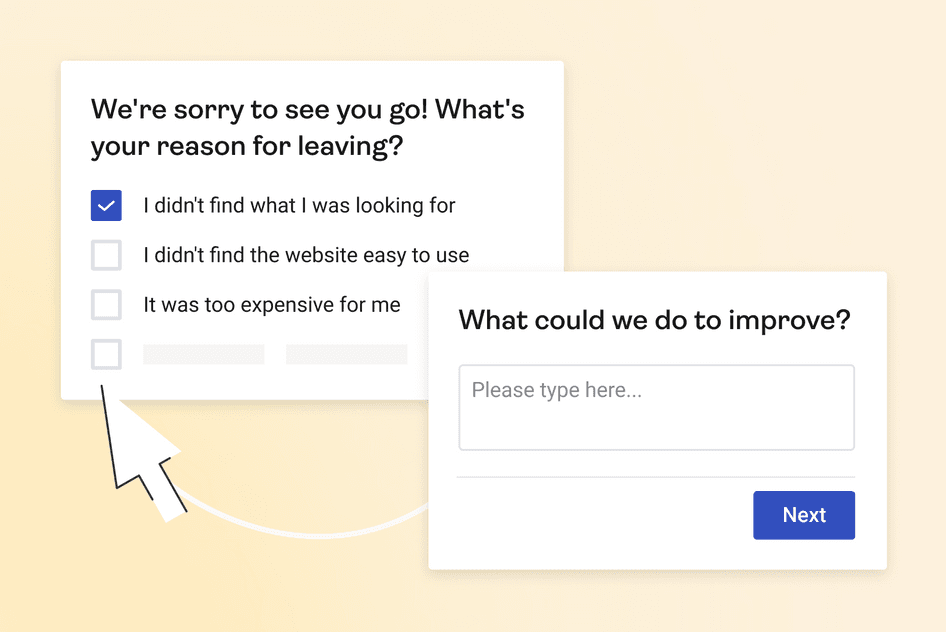
Whether it’s related to design, content, or offers, use the insights to envision a potential fix, run an A/B test between the old and new versions, and compare the results.
5. Validate assumptions by incorporating Hotjar Observe tools
You've already met the Hotjar Observe tools above: Recordings and Heatmaps. While quantitative data provides a snapshot of site or app activities, these two explain them.
So if Google Analytics numbers tell you something has gone wrong, read on to see how the Hotjar Observe tools replace your assumptions with context and clarity (note: these are real-life examples).
Totally Promotional, an online retailer and manufacturer of customized promotional products, used insights gleaned from Recordings to better meet user expectations. Once, after watching user recordings, it became clear to them that users didn’t understand their existing order process. So they switched a couple of things up—the format of their order form and the available information about their process. That change eliminated any possible confusion.
Cloud-based collaboration platform Taskworld studied Heatmaps to learn where users clicked in their signup process. This elevated their qualitative data analysis. For instance, they discovered a few issues that took five minutes to resolve. This quick fix boosted their conversion by 40%.
6. Get a high-level, visual view of user metrics via Dashboards
After learning about Recordings, Heatmaps, and Surveys (there are even more Hotjar features, as you'll discover in this section), you might wonder: where to begin? Well, it's time you tinker with your Dashboards.
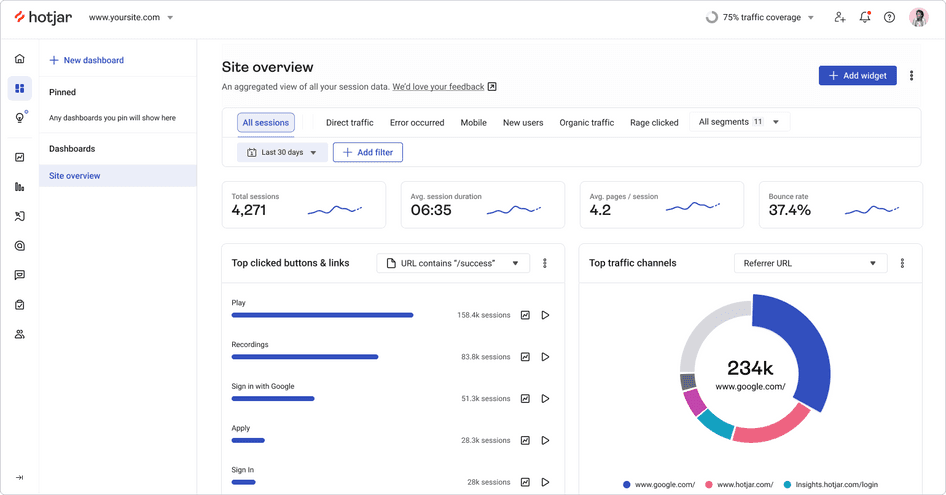
These aggregate, visual views of your most essential user metrics make it easy to identify patterns and trends. And without having to switch back and forth from your web analytics platform, like Google Analytics, you have quick access to the relevant recordings, heatmaps, or survey responses to understand what's going on behind the peaks and dips.
Dashboards seamlessly connects the dots between your quantitative and qualitative insights so you can find areas that need attention with ease. For data analysts making daily decisions, Dashboards help your team spot issues sooner, fix them faster, and prioritize your backlog more effectively.
7. Compare and analyze important metrics across segments with Trends
Hotjar enables you to group users into handy categories called user segments. In Trends, it’s possible to compare how different user segments behave on your key pages. You can select the audience segments based on the goals you want to achieve:
Small-business owners vs. medium-sized business marketers, to tailor onboarding experiences
Visitors clicking on an ad for a gaming laptop vs. visitors clicking on an ad for a Black Friday sale, to direct them to the most relevant landing pages
Visitors who completed a purchase vs. visitors who abandoned at checkout, to improve your strategy for increasing paying customers
Trends lets you uncover richer, more targeted insights from such comparisons. And it presents them nicely through a chart of your choice: line, pie, or bar.

A sample pie chart in Hotjar Trends
8. Find and fix conversion pitfalls using Funnels
What does your conversion funnel look like? Build it in Funnels by adding up to ten steps based on sessions that viewed a page, clicked an element, or triggered an event. You can track the overall conversion rate and average time to convert. Or get granular and see the percentage of users who convert and drop off for each step.
You can also zoom in on the drop-offs, identifying where users drop off in the customer journey and jumping into relevant recordings to watch the actual behavior behind them. This can reveal UX issues, which affect your conversions—and, in turn, enables you to resolve those issues quickly and improve your results.
9. Export UX and behavior data to other tools through the Hotjar API
Sending Hotjar data to your own database is available via the Hotjar application programming interface (API). What does the Hotjar API allow you to export, and where? Here are a few examples:
Automatically export survey response data to a complementary analysis tool
Export survey response data to your data warehouse, blending it with other sources for enhanced insights
Sync survey response data with your preferred business intelligence reporting tool to create reports, dashboards, and data visualizations
Also, you can automate users’ personal data deletion at scale with the user lookup API. This makes compliance with the General Data Protection Regulation (GDPR) easier—i.e. GDPR requires you to grant a user’s request for their personal data to be deleted.
10. Save meaningful insights in one place and share them later with Highlights
You don’t have to leave the Hotjar platform to collect the qualitative insights you need to support your quantitative data analysis. Copy-pasting URLs to share those insights isn’t even necessary. Highlights puts all of them in one place for easier sharing and analysis.
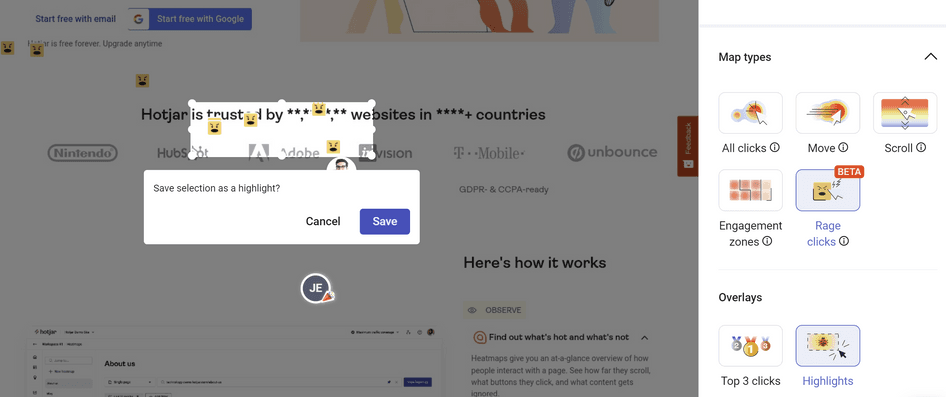
Grab snippets of your most valuable recordings and heatmaps
Label them for faster issue identification, assumption validation, and fix prioritization
Group them into collections you can share with your peers, bosses, and other stakeholders
In short: Highlights is the best way to stay organized, increasing your chances of getting buy-in for your most impactful insights.
Get all the analytics tools and features you need in one platform
As one of our satisfied customers said: Hotjar turns data into life.
We couldn’t agree more. If that’s not what we’re doing, why are we even here? 😉 Hotjar is designed to make data analytics efficient, effective, and enjoyable for data analysts. It also simplifies and makes the process accessible to more users, from business owners to product managers to digital marketers.
Hotjar lets you go granular and really understand the individuals using the page. In other words, it turns data into life.
It's really hard to dive into analytics. It's so nice to have one tool that tells me exactly what it is I have to change. Hotjar for me simplifies the process of analytics. Instead of having numbers that explain how people use my website I have graphic visualizations of it, like Heatmaps and Recordings.
After reviewing Google Analytics data, installing Hotjar is one of the first steps we take in every client engagement. It’s the window we use to understand the customer journey.
There's nothing left to say because we've laid it all out for you in ten terrific ways. Just one more thing as we pass the ball to you: we can’t wait for you to try Hotjar and give your users the best experience possible.
Find answers and solve problems fast
The Hotjar platform has the right tools and features you need to analyze data in a breeze.
FAQs about Hotjar analytics
Related articles

Behavior analytics
How to use the Hotjar-AB Tasty integration: 3 powerful use cases
Figuring out exactly what your users need involves two things: getting to know them and some old-fashioned trial and error.
With the Hotjar-AB Tasty integration, we’ve got you covered on both counts. Hotjar helps you understand user behavior, and AB Tasty lets you create experiments and personalizations on your site. Learn how these tools work together to create a digital experience that’s enjoyable for your users and excellent for your conversions.

Behavior analytics
The best way to track scroll depth (it’s not Google Analytics 4)
Knowing which parts of a web page bore, engage, or persuade your website visitors can be a superpower for digital marketers, UX designers, product teams, and ecommerce managers.
Tracking scroll depth gives you this power, providing actionable insights to improve the user experience (UX) by revealing your site visitors’ scrolling behavior.

Ayush Sood

Behavior analytics
7 best Mixpanel alternatives to understand your users
Mixpanel is an analytics platform that excels in collecting quantitative user data. But sometimes, product managers, marketers, and website owners need more—the 'why' behind the 'what’. The good news is there are plenty of Mixpanel alternatives that combine quantitative analytics with powerful qualitative insights.

Hotjar team