Learn / Guides / Holiday readiness guide
How to use Hotjar during busy seasons to boost sales and conversions
Hotjar insights let you take advantage of the wealth of data available during peak seasons to improve the user experience (UX) and ultimately increase sales and conversions.
You know peak seasons come with the golden opportunity to gather plenty of first-party data.
Legitimately collect valuable information and maximize user experience insights. Learn how your customers think, feel, and interact with your site as hundreds (or thousands) of them flock to it. The end goal: improve conversions and increase sales.
But if getting started got you stuck, a little help from a user behavior analytics tool can go a long way. Here are some definite steps you can take to process the wealth of data awaiting in the midst of high-traffic times.
Exceptional UX elevates businesses
Make data-driven UX decisions and delight high-intent customers during peak traffic seasons.

Nothing beats creating user-centric products, services, and experiences to amplify sales and conversions.
Hotjar is a source of behavior analytics solutions that let you optimize and deliver an excellent UX during a traffic surge. And these same tools remain available throughout the year to sustain your growth goals—bonus!
Through the quantitative and qualitative data you find on Hotjar, you can:
Hotjar analytics in action
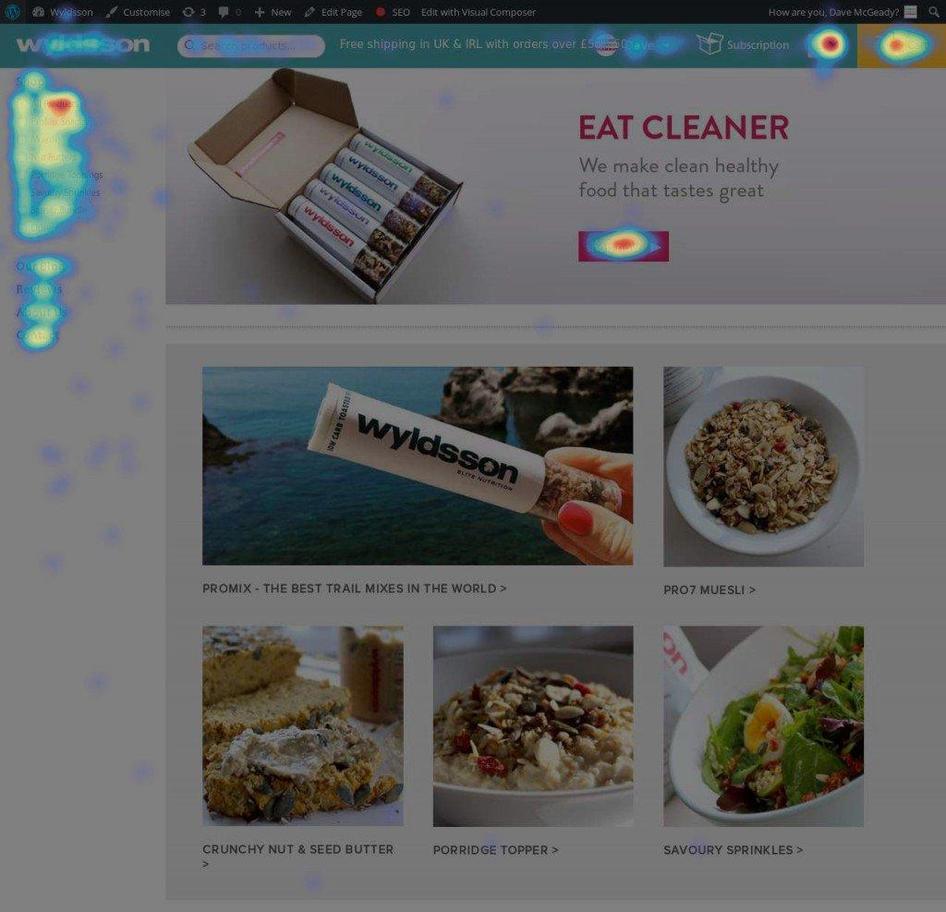
Healthy snack brand Wyldsson was able to instantly increase sales by 30% after using Heatmaps and Recordings.
This result was a complete overturning of the massive drop in conversion rates they endured during a high-traffic, busy period.

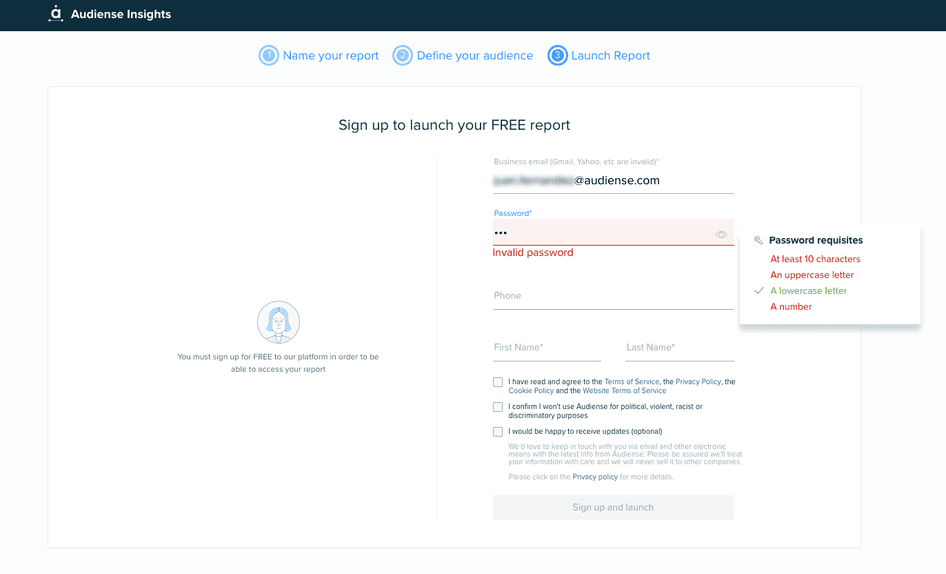
Through these Hotjar tools, they identified why users were leaving the site without buying. The deceptively simple reason: a confusing and annoying step in the login process.
The team then wasted no time fixing the issue, monitoring the outcome, and using Hotjar to continue testing. With this approach, they were able to make user-centric changes proven to greatly impact their conversion rates.
Peak traffic period ready: 6 ways to improve UX through Hotjar
1. Launch Surveys to hear straight from users
Capture user feedback during high seasons using any of Hotjar’s survey templates. You can also create your own survey from scratch, adding as many custom questions as needed.
Even a single-question survey can provide quick insights into how you are doing or what you should do. Consider a simple question like: what’s one thing you wish our website offered that it doesn’t already?
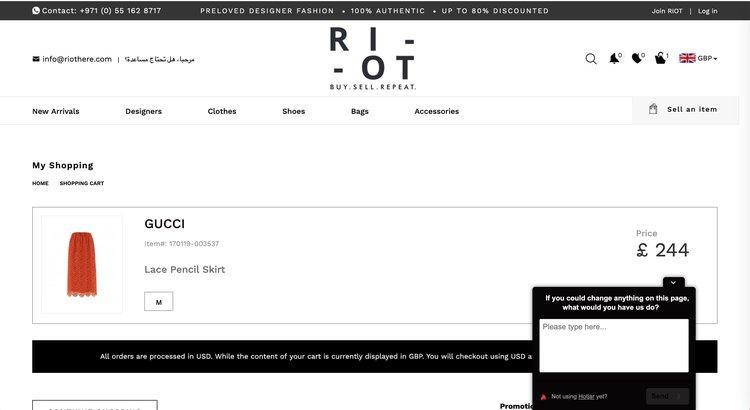
What you can do with Surveys: frustrated visitors will leave your website and choose your competitor instead. When this happens, trigger an exit intent survey to show on the most-exited pages. Ask visitors why they’re leaving and what you could do to improve.
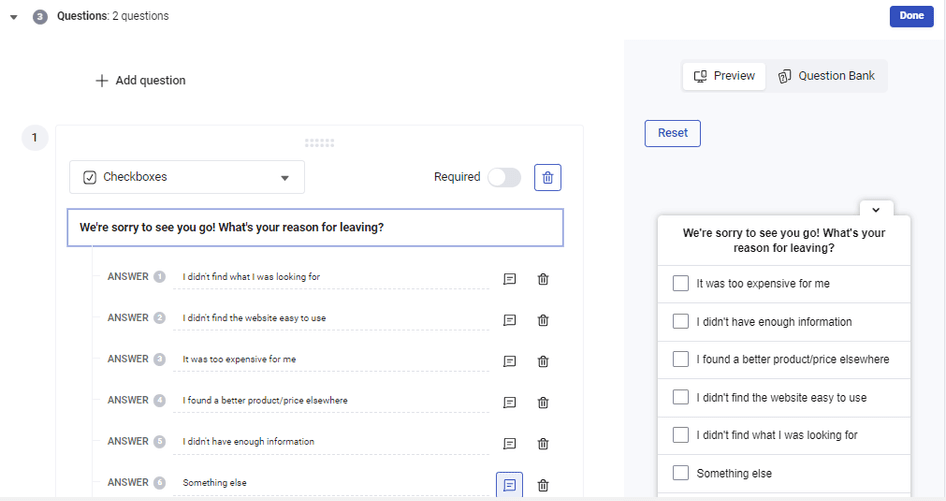
Look for a pattern in their responses to find the source of their frustration. And then prioritize a fix to prevent more users from bouncing off your page before they could perform a desired action.
2. Monitor the checkout flow using Feedback
The Feedback tool allows you to get visual feedback in the voice of the customer. It appears as a widget—a nifty interactive button—on your website that lets people rate their experience and provide additional context.
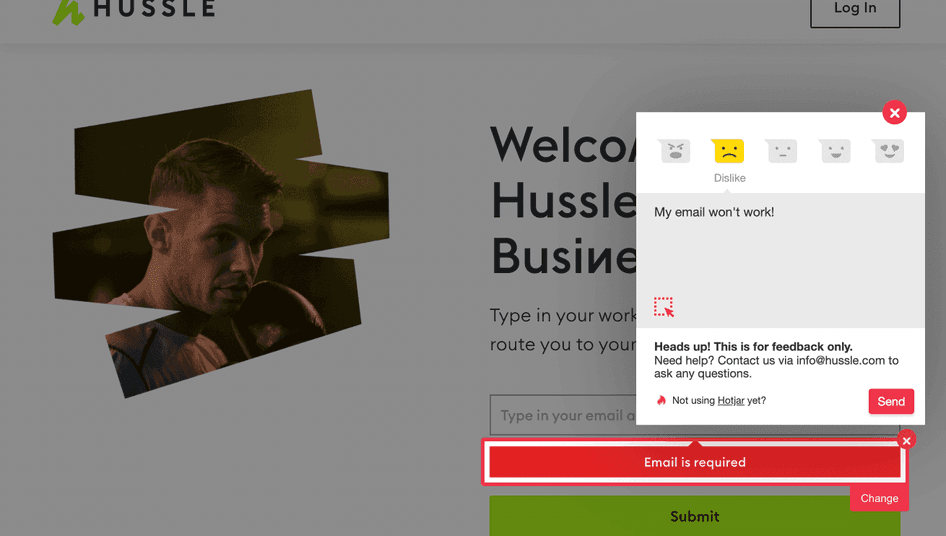
What you can do with Feedback: set up a Feedback widget on the checkout flow to ensure you can get in-the-moment user feedback for any issues they might encounter.
This way, you can see whether or not a page element is causing problems and spot a serious issue before it affects hundreds of users—or more. Immediately identify a solution to stop users from hitting a snag as they try to complete the checkout process on your site.
💡Pro tip: integrate your Slack account to Hotjar, so you can receive alerts and stay aware of the most important user feedback.
3. Stay on top of what’s happening on your site with Dashboard and Trends
The Hotjar Dashboard offers a visual overview of some of your most valuable metrics, while Trends helps you spot patterns in user behaviors and understand your metrics on a deeper level.
What you can do with Dashboard and Trends: keep an eye on your most important metrics on the dashboard to easily spot trends and quickly solve issues.
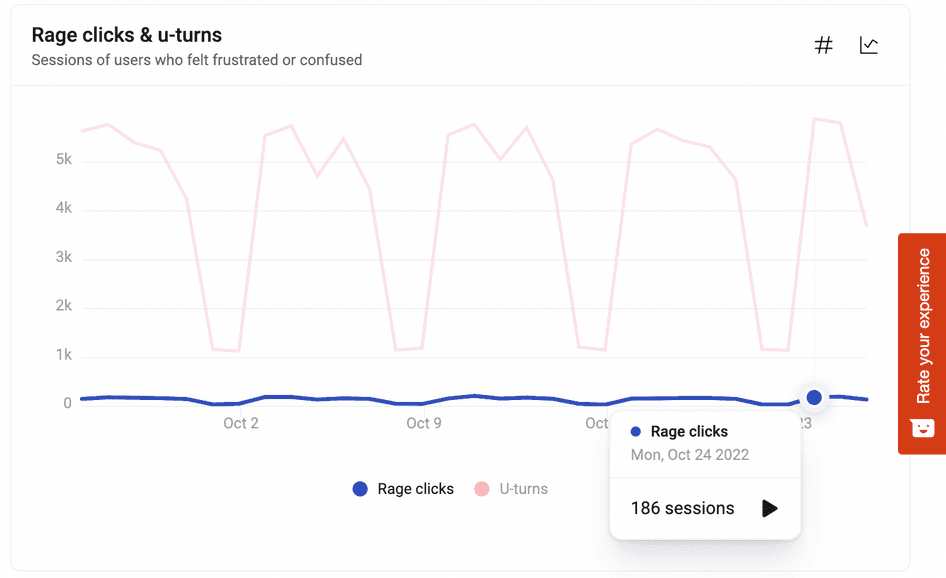
For instance, the last thing you would want for your ecommerce customer experience (CX) is a broken checkout button—the cause of many abandoned carts and a huge drop in traffic. Thankfully, the chart showing rage clicks (a frustration signal, shown as repeated clicks or taps on page elements) will tell you if there is an issue, so you can get it fixed before it's too late.
💡Pro tip: customize your dashboard for the holiday season so that you can easily find all the relevant metrics. Switching between multiple analytics tools is a time-sink when you’re already very busy catering to the influx of customers.
4. Glean insights into user behavior and page performance through Heatmaps
A heatmap lets you analyze complex site data through color-coded representations. The visual cues vary by hue or intensity, allowing you to understand the represented values in seconds.
What you can do with heatmaps: expect a spike in new user count when the holiday season starts, which means it’s important to keep track of first-time users’ experience on your site.
Go to your heatmaps and filter by ‘new users’ to see how this segment is behaving on your most important pages. Returning users would already be familiar with your site, but maybe your new users would need guidance to find their way to the checkout page.
Here’s another way to use heatmaps: busy periods bestow additional traffic to less popular pages. So during this time, you might have a bunch of pages with more heat data than they had previously.
This event creates the perfect opportunity to analyze pages that didn't get much traffic earlier in the year. You now have the chance to collect essential information about what and how to improve.
5. Watch Recordings to validate your assumptions and drive results
Session recordings are renderings of real user actions—such as clicks, scrolls, and taps—on a website. They are used to gain a better understanding of how users interact with a site, making it easier to spot issues, optimize UX, and enhance conversion rates as a result.
What you can do with Recordings: spot small issues and improve your conversion rate immensely. There are two ways to go about this:
Jump into your recordings if you detect an increase in rage clicks and u-turns (instances where users go to a page and then quickly return to the previous one) or any other important metric in your dashboard or trends.
Even if everything seems fine, block some time daily to watch recordings. Set the relevance score ‘high’ and ‘very high’, use the visited page filter, and view the most relevant session replays on your important pages from the last 24 hours.
6. Achieve more by combining Hotjar features and tools
The best part of being on the Hotjar platform is you can complement one tool with another. This capability enables you to know when users hit a snag and fix it, get buy-in for your improvement ideas, and ultimately polish the conversion process.
So while you’re in the swing of things, tap into the power combos available on Hotjar:
If you have a Hotjar NPS survey or Feedback widget set up, filter the recordings by ‘hate’ comments and detractors to find out why they're unhappy. Even if users don't reveal much in those surveys, the recordings might help you find the reason they're frustrated and decide what to fix.
Lots of campaigns come with the holiday season! So filter sessions relevant to seasonal campaigns. Use the referrer URL filter or events to isolate the sessions that occurred as a result of a campaign, and see if users coming from that campaign are experiencing the site as expected.
Complement your Heatmap analysis with Recordings. Don't forget to give the ‘View recordings’ button a plug. This tool can help validate the assumptions you make when you analyze a heatmap.
Save clips using Hotjar Highlights so you can get back to non-urgent but important matters once the busy season is over (more on this in the following chapter, so stay tuned!).
Attract returning customers, in and out of season
There you have it: Hotjar tools and features are built to sustain your sales and conversion goals during busy seasons. You can use them alternately, or to complement each other, depending on your needs during high-traffic periods.
So, don’t just sit on that first-party data when the peak season comes. With Hotjar, you can mine it and glean meaningful insights that can help you improve the user experience. Remember: happy, satisfied customers will keep coming back, no matter the time. And through continued user research and UX testing, you can give them plenty of reasons to do just that.
Access meaningful business insights
Understand your customers and their needs, and let your business provide the solution. Hotjar makes it possible to deliver a user experience that benefits your bottom line.