Learn / Guides / Net Promoter Score® guide
How to calculate your Net Promoter Score®: formulas, methods & excel template
If you’re on a quest to decipher the Net Promoter Score® calculation (and the math behind it), look no further.
Calculate (and improve) your NPS® today
Use Hotjar’s free NPS® survey and built-in score calculator to effortlessly track your NPS so you can focus on improving the customer experience—and your bottom line.

What is the NPS formula? (+ how to Calculate NPS)
The standard NPS formula is to subtract the percentage of detractors from the percentage of promoters. So, to calculate NPS, first ask your customer base the standard NPS question: “How likely are you to recommend us on a scale from 0 to 10?” If 80% of respondents are promoters and 10% are detractors, then you have an NPS of 70.

The NPS formula
The formula only makes sense if you know what the promoter and detractor labels truly mean—and how they get assigned in the first place.

What is a promoter in NPS?
A promoter is anybody who answers the question "How likely are you to recommend this product/service/company to a friend or colleague?" with a score of 9 or 10.
As your most enthusiastic and loyal customers, promoters are likely to act as your brand ambassadors and rack up word of mouth referrals, which in turn helps fuel growth.
What is a detractor in NPS?
A detractor is anybody who answers the question "How likely are you to recommend this product/service/company to a friend or colleague?" with a score between 0 and 6 (included).
They’re obviously not your biggest fans. But it’s worse than that: not only are they not likely to recommend you to others—they’re the first candidates for leaving you, and they might even actively discourage other people away from you. One of your main goals is making sure you have fewer detractors than promoters.
What about passives?
Sat in the middle of detractors and promoters are the passives, who answered the NPS question with a score of 7 or 8. Technically, you should look at them as old or new customers who are ‘passively satisfied’ with your product or service but are not supremely loyal to it, which means they can be snatched away by the competition.
💡 Pro tip: passives are not directly included in the NPS calculation, but don’tunderestimate their importance. They’re so close to being promoters, especially when they give you a score of 8, that any time spent investigating what you could do to win them over is time well spent. Consider it an opportunity to collect and analyze their customer feedback.
3 NPS calculation methods
We’re going to take you through three main methods for calculating your NPS, using:
A spreadsheet/Excel
An online calculator
A survey tool with an NPS feature
We’re also adding a bonus method that shows you the math behind the NPS formula so you can calculate it with pen and paper…should you ever want to!
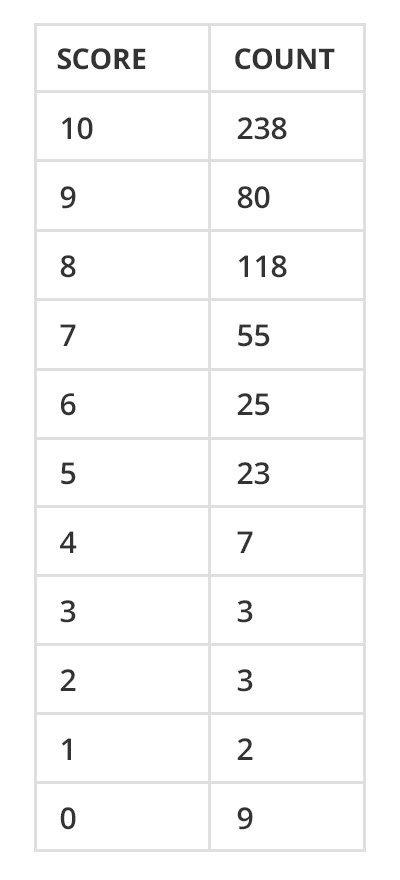
The example calculation we use draws from a real dataset of 563 responses collected over 30 days with our own NPS survey:
1. How to calculate your NPS in Excel/Google Sheets
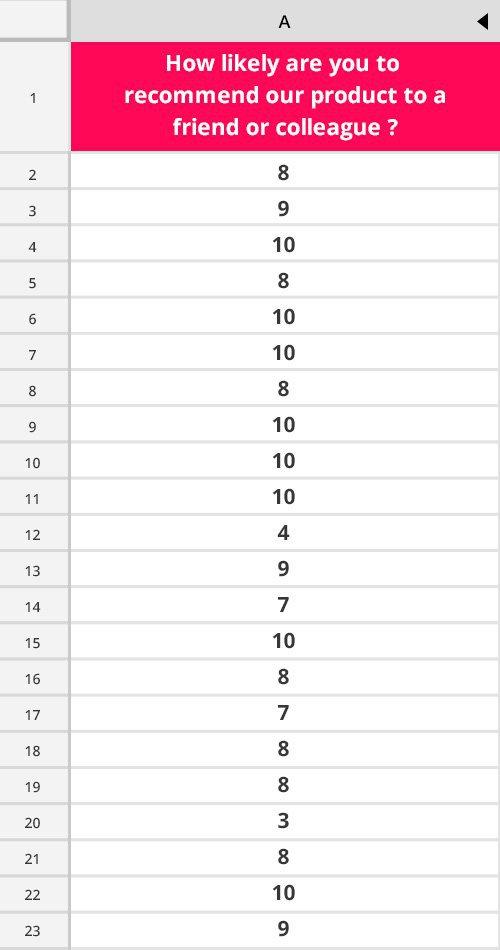
The Excel or Google Sheets spreadsheet method is best when your raw NPS data is just rows of numbers between 0 and 10 that need to be categorized as promoters, detractors, and passives:
How to calculate NPS in Excel:
Add up the promoters—those who scored 9 and 10
Add up the detractors—those who scored 0 to 6 (included)
Divide the number of promoters by the total number of responses to calculate the percentage
Repeat this process for detractors
Apply the NPS formula: percentage of promoters minus percentage of detractors
Excel template for calculating NPS
To expedite the process, we created a spreadsheet template that already has the NPS formula ready to go. Here’s how to use it:
Make a copy of the spreadsheet template or download it as an .XLS file
Export the data from your NPS survey results into a .CSV or .XLS file

Copy the data from your results file and paste it into the template sheet named ‘NPS calculation’, in the cell marked with <Copy/Paste your scores here>:
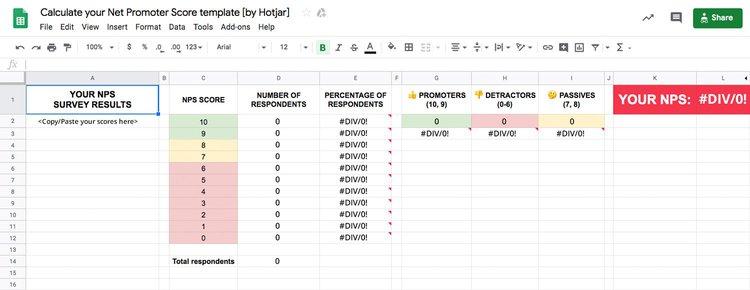
After you paste your scores, the formula in the spreadsheet will automatically
Display the count for each score from 10 to 0
Count your total number of respondents, promoters, detractors, and passives
Calculate and display your NPS
We also added a sheet called ‘NPS calculation - example dataset’ to the template so you can see how it works. Try to change a few numbers here and there and see how that affects the NPS. As you make sense of the numbers, you might find yourself wondering what a good Net Promoter Score® looks like. Well, it actually varies vastly across industry, but a score of 60 or higher is generally a very good NPS (read this guide’s chapter on NPS benchmarks and why this metric is relative).
2. How to calculate your NPS with an online calculator
If you’ve already added up the number of responses received by each 0–10 score, you can let an online NPS calculator do the math for you.
Use Hotjar's NPS calculator below by simply entering the corresponding data from your NPS survey results:
Calculate (and improve) your NPS® today
Use Hotjar’s free NPS® survey and built-in score calculator to effortlessly track your NPS so you can focus on improving the customer experience—and your bottom line.
3. How to calculate your NPS with a survey tool
Before calculating your NPS score, you’ll first need to pose the NPS question to your customers using a survey tool. If you collect your NPS data with an online survey tool, the good news is that it might already have an auto-calculate function built in that lets you get your NPS in one click.
The NPS software that powers Hotjar Surveys, for example, automates the Net Promoter Score® calculation and lets you easily track your score from Dashboards. We even have a pre-built NPS survey template that you can set up in seconds and strategically place on your website to pose the NPS question at crucial touchpoints along the customer journey.
This is what the Hotjar NPS survey looks like in action:

A pop-up NPS question, asked with Hotjar Surveys
Track your NPS
If you want to know how to improve your NPS, you need to track how it changes over time. Thankfully, NPS survey tools like Hotjar cut out the time it would take you to continually calculate your NPS by hand.
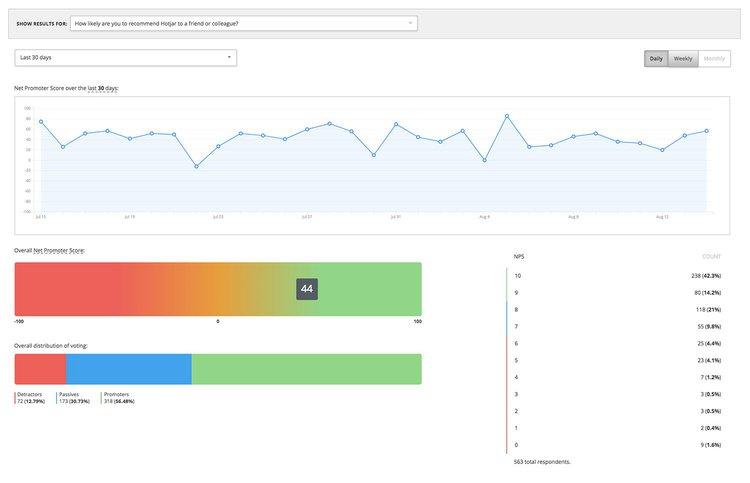
Hotjar’s NPS dashboard widget enables you to track real-time changes to your score, so you can keep tabs on it daily or visualize trends over longer periods. This guide includes a chapter on how to track NPS that goes into more detail, but here’s what NPS results looks like on the Hotjar Dashboard:
Two main benefits of using a survey tool like Hotjar to calculate your NPS:
You don’t have to do any data exporting or copy-pasting, which saves you a little time and removes the potential for errors
Both the spreadsheet and the calculator give you a snapshot of the current situation; an NPS survey tool also helps you track changes, trace daily NPS fluctuations for the previous 30 days, and weekly/monthly fluctuations for the past 12 months.
💡 Pro tip: to make the most of your Hotjar NPS survey, you can follow up the NPS scale with an open-ended question—ask your detractors what would improve their score and your promoters what would wow them. Check out our survey question bank for further follow-up question ideas, or try running a tandem customer satisfaction (CSAT) survey to dive right into the customer experience.

An example NPS survey
And with Hotjar’s AI for surveys, there’s no need to worry about high survey response rates that leave you sifting through every single answer overwhelmed: the AI will prepare an automated summary report of your survey results that includes key insights, survey respondent quotes, and actionable next steps to take.
4. Bonus method: the math behind the NPS calculation
If you’re interested in how the NPS formula works—or if you ever find yourself wanting to calculate it with just pen and paper—here’s the math behind it:
The promoters are counted by adding up the number of 9 and 10 responses (using the same dataset as the examples above, we have 238 + 80 = 318 promoters)
The same process is repeated for detractors, by adding up the number of responses from and including 0 to 6 (in our case, that’s 9 + 2 + 3 + 3 +7 +23 + 25 = 72 detractors)
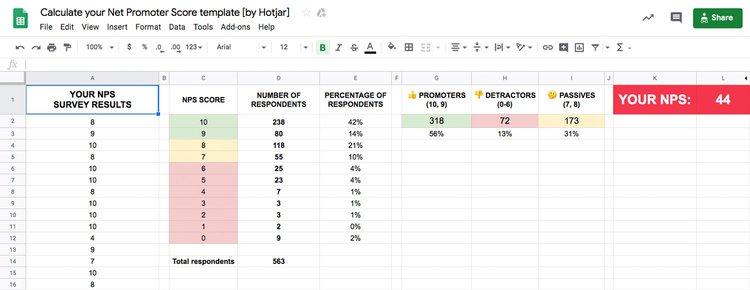
The percentage of promoters is then calculated by dividing the number of promoters by the total number of responses (our dataset brings us to 318/563 = 0.56, or 56% when expressed as a percentage)
The same process is repeated for detractors, dividing the number of detractors by the total number of responses (for us, that’s 72/563 = 0.12 or 12%)
Finally, the NPS formula is applied: percentage of promoters minus percentage of detractors (in our case: 56-12 = 44). And that’s how you calculate your NPS manually.
Net Promoter, Net Promoter System, Net Promoter Score, NPS and the NPS-related emoticons are registered trademarks of Bain & Company, Inc., Fred Reichheld and Satmetrix Systems, Inc.
Calculate (and improve) your NPS® today
Use Hotjar’s free NPS® survey and built-in score calculator to effortlessly track your NPS so you can focus on improving the customer experience—and your bottom line.