Learn / Guides / Net Promoter Score® guide
Tracking your NPS®: why it matters and how it’s done
Just as a single snapshot of a tennis match can’t help you predict the tournament’s winner, a single NPS survey result won’t give you the context and insight you need to make impactful decisions. One score tells you where you currently stand, and you can compare that to your industry average...but that’s about it!
The power of Net Promoter Score® as a metric comes from collecting and tracking customer satisfaction over time. It’s all about observing trends and evaluating the impact of your efforts so you can double down on what works.
Summary
Knowing your most recent Net Promoter Score® won’t get you very far—you need to track how it changes over time to effectively meet your customers’ needs. This article explains
How to track your overall NPS score
How tracking NPS helps you grow your business
How to track your NPS
Running a Net Promoter Score® survey is the first step to measuring how happy your users are with your product, so you need to put some thought into how and when you poll your customer base.
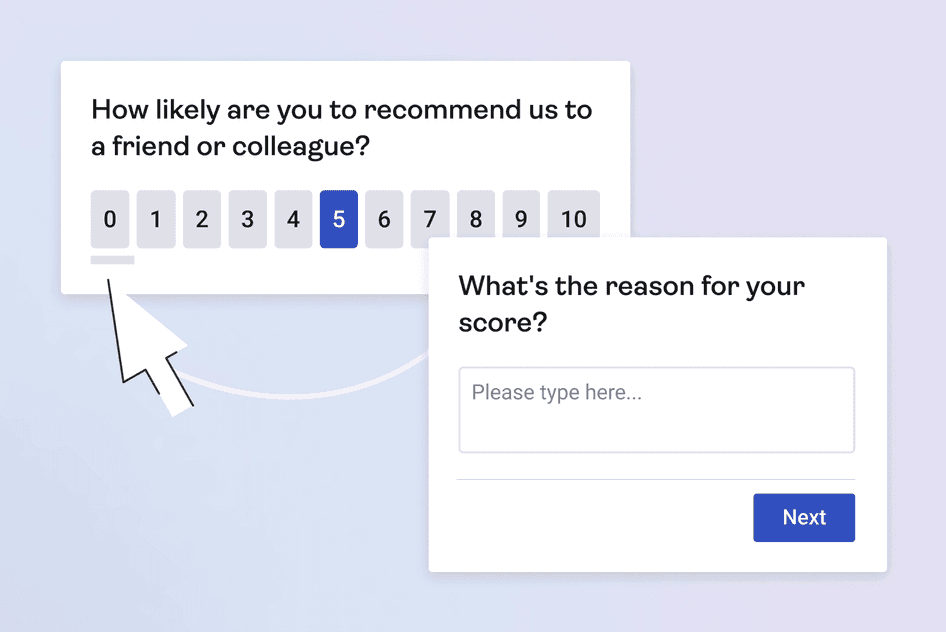
Remember, NPS surveys consist of more than one single question:
How likely are you to recommend this product/company to a friend or colleague on a scale from 0 to 10? (the standard NPS question)
What’s the main reason for your score?
What could we do better?
📖Read our chapter on NPS survey questions for more ways to ask follow-up questions.
💡 Pro tip: use Hotjar to strategically embed an NPS survey anywhere on your website or display it as a pop-up at key touchpoints along the customer journey. Stick to simple questions, and if you want to expedite the survey-building process, we’ve got an NPS survey template to get you started.
Once you get some survey responses, the next step is to calculate your NPS score. Most online survey tools will do this automatically (check out our chapter on the NPS calculation if you’re unfamiliar with how it works).
Now, it’s finally time to start monitoring your NPS results, and the way you go about this will vary depending on the type of question you ask. Here’s how to track both closed-ended and open-ended data.
Tracking survey answers for closed-ended NPS questions
Tracking closed-ended survey questions is relatively simple and is usually done automatically by the NPS program you choose to set up your surveys. As the tool collects NPS data, it offers you a visualization like the one below, which helps you understand trends over a specific period.
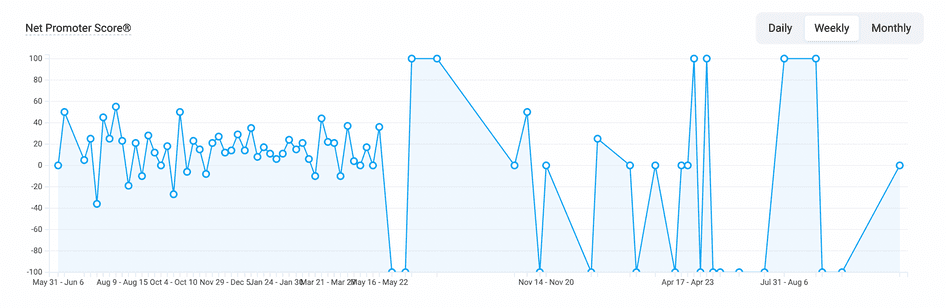
For example, Hotjar’s NPS software lets you filter by the last seven, 15, 30, 90, or 180 days and even gives you a 12-month visualization to get a big-picture view of how your Net Promoter Score® is trending over time. Similarly, you can zoom in and see how scores are distributed by charting weekly or even daily data points on the graph.
💡 Pro tip: easily keep track your Net Promoter Score® by adding the NPS widget to your Hotjar Dashboards. Better yet, every Hotjar plan accommodates an unlimited number of team members (yes, even the free one!): invite your whole team to join and get them in the habit of checking your NPS score to keep the feedback loop running smoothly and ensure user sentiment is a company-wide priority.
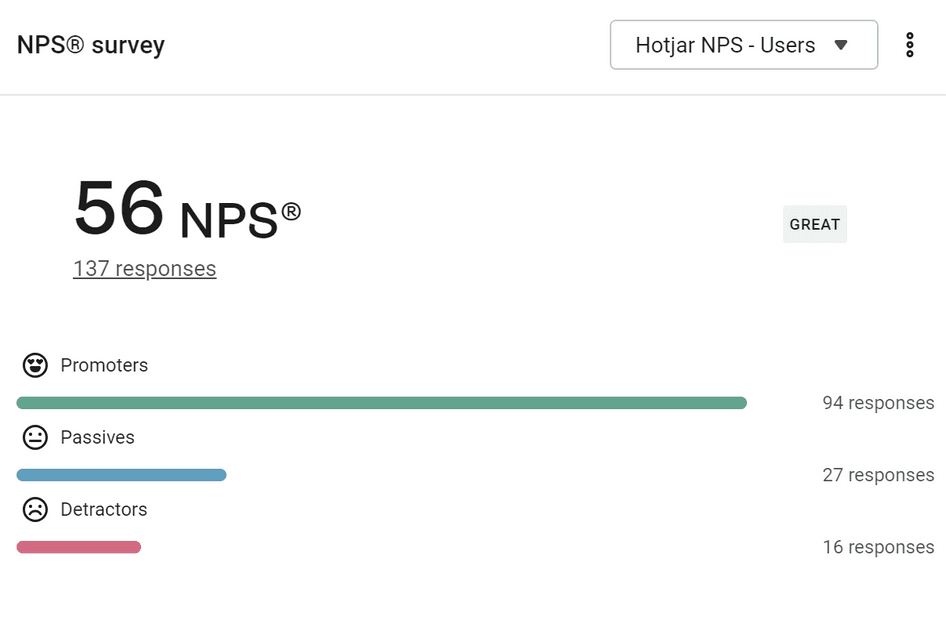
This Hotjar Dashboards widget lets you track NPS in real time
Tracking survey answers for open-ended NPS questions
Tracking customer responses from follow-up NPS questions is a bit more challenging, but this data is key to improving your product—if you don’t know what went wrong, you’ll never be able to fix it.
The good news is that we’ve created a guide to help you analyze open-ended questions in 5 simple steps, and we promise it’s easier than it sounds! All it takes is a Hotjar account and a working knowledge of Excel or Google Sheets to start processing your NPS feedback.
And if you’re really in a time crunch, try Hotjar AI for Surveys: not only will our AI generate an NPS survey for you, but it’ll also prepare a summary report that analyzes your NPS response data, providing key findings, quotes, and suggested next steps to take based on the user feedback you receive. This feature will come in handy to track your score over time—because the longer you run your NPS survey, the more your response rates grow.
Tracking NPS: how Apple boosted revenue by $25 million in one year
Apple retail stores tracked NPS on a scale of 0–10, and unhappy customers who rated their experience between 0 and 6 (detractors) received a follow-up call from the store manager. In some cases, managers couldn’t get ahold of the customer, so Apple also tracked the difference between customers who spoke with the manager and those who didn’t.
Over the next two years of detractor-tracking, it turned out that people who spoke to a manager spent substantially more than those who didn’t. In fact, every hour the store manager spent on the phone translated to $1,000 in extra revenue—which amounted to $25 million (USD) after one year.
❗The following example is from Reichheld’s The Ultimate Question 2.0: How Net Promoter Companies Thrive in a Customer-Driven World.
How tracking NPS helps you grow your business
When Fred Reichheld and his team at Bain & Company developed the Net Promoter System, they tested out all sorts of questions related to customer loyalty and engagement. They discovered that the Net Promoter Score had a greater correlation to growth than any other metric they studied.
Here's how tracking NPS regularly helps your business thrive.
NPS is a benchmark for improvement
Tracking your NPS benchmarks over time lets you evaluate whether the changes you implement in your website or product have an impact. Not only does NPS tracking let you gauge how loyal customers are (especially after major product updates), it gives you a sense of what they’re not satisfied with so you can improve your offerings, know how to wow new customers, and increase customer loyalty in the future.
Plus, you can track NPS to see how customer feedback varies across different segments, such as
Major customer demographics or psychographics
Cohorts of customers who responded to specific messaging
Customers who deal with different divisions within your company, like sales or support
Customers who use certain product lines exclusively
💡 Pro tip: NPS isn’t the only way to gauge customer sentiment. Use Hotjar to run a customer satisfaction (CSAT) or Customer Effort Score (CES) survey—for free.
NPS unites everyone around a single metric
When leaders focus solely on revenue and profit, employees tend to follow their example. If jobs are tied to revenue or profit, people can naturally tend to prioritize earnings over the customer experience.
NPS unites everyone around a common goal—customer-centricity—and this leads to reduced customer churn and more sustainable growth year over year.
Even if you’re already sold on the value of NPS, you might get pushback from team members who are more focused on immediate return. Fortunately, you can win over skeptics (especially CFOs) by calculating the return on investment of your NPS projects.
Net Promoter, Net Promoter System, Net Promoter Score, NPS and the NPS-related emoticons are registered trademarks of Bain & Company, Inc., Fred Reichheld and Satmetrix Systems, Inc.