Learn / Guides / Session recordings
How to use recordings to understand how users interact with your site
When you want to understand your users, Hotjar Recordings give you insights no other tool can. They let you take an up-close look at individual journeys on your website, so you can find new ways to serve customers and improve conversions.

Why wonder what your users are doing? Recordings give you the power to see exactly how people navigate your website or product. Every single user interaction is important, taking you closer to (or further from) a conversion. But having access to these insights is just the first step. You also need to leverage them in the right way to grow your business.
Read on to find out why recordings are essential for effective user behavior analytics—and how you can use them to optimize your online presence.
See what your users are doing
Hotjar lets you view recordings of your website visitors, then use filters to see the most relevant journeys with a few clicks.

What are recordings?
Recordings, sometimes called ‘session replays’ or ‘session recordings’, are video replays of the journeys users take through your website.
They give you a window into what an individual user did—including every mouse movement, click, and scroll. It’s like you’re in the room with a friend, watching them browse a web page.
❓Did you know? Hotjar Recordings let you see customer behavior up close without interfering with users’ privacy rights. Because Hotjar conceals personal information (like credit card numbers), you’ll only see a user’s behavior, not their sensitive data. Check out some recording examples to see how Hotjar customers are using them.
Why do online businesses need Hotjar Recordings?
To create better journeys for your customers, you must understand how they experience your website—what they do on it, what’s working, and what’s going wrong.
Using tools like Google Analytics (GA) to analyze your quantitative data is a great first step. By identifying trends in how users navigate your site, you can see where users visit, convert, and drop off.
However, this won’t tell you why users behave the way they do.
Recordings let you see your website through users’ eyes
Because recordings give you a first-person view of how individual users act on your website, they’re perfect for identifying:
Why users get lost or confused
What grabs (and keeps) their attention
How they interact with different elements on your site
Which elements of your site aren’t working correctly
In a nutshell, you can combine recordings insights with your quantitative data—like GA metrics—to get the full picture of what your users are doing and why.
And when you add data from other behavior analytics tools available in Hotjar, like Heatmaps and Surveys, you can answer the toughest questions about your users.
Recordings help you get buy-in for your ideas
You’ve got great ideas for how recordings improve site conversions. But when your team has limited resources, you must also convince others that your suggestions are worth investing in.
Getting this crucial buy-in from your team is much easier when you’ve got data to back you up. This is where recordings are like a secret weapon: not only are recordings easy to share, but their visual nature means you can show your colleagues exactly what users are experiencing.
Case study: developing empathy across the company
Marlin is a US-based company selling software and hardware for digital signs. Their technology is great for industries like manufacturing and hospitality, where organizations need to give visual updates to their visitors and staff.
The team at Marlin uses Hotjar Recordings for three main tasks:
Quickly spotting and fixing bugs in its software
Building empathy to create better features and user experience (UX)
Creating better sales messages based on observations of how customers use their software
Stephen Ippolito, Marlin’s Product Manager, watches Recordings for 30 minutes every Friday before sharing key findings with his colleagues. His team finds Hotjar Recordings so helpful, they even broadcast them on internal displays the whole company can see.
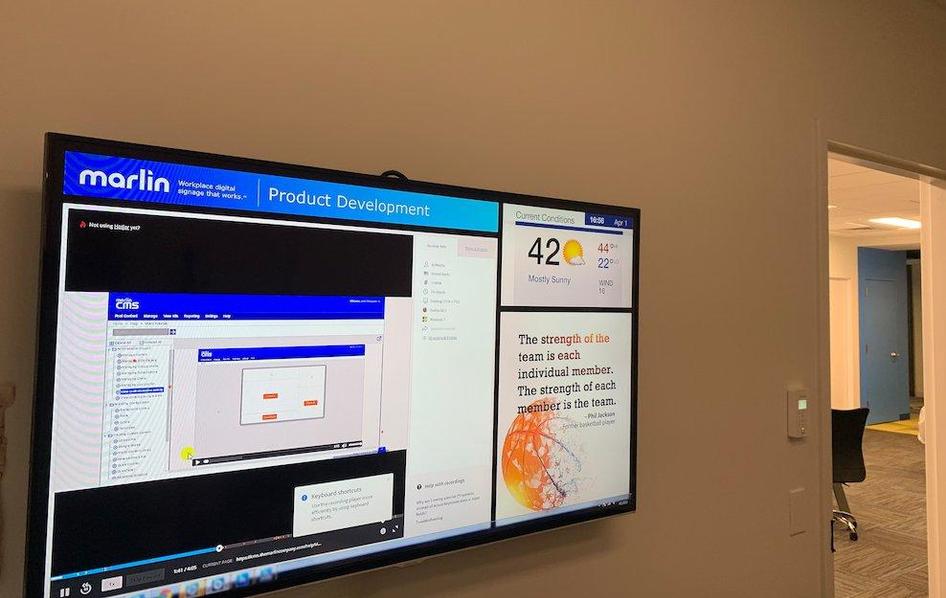
Check out the full customer story for more inspiration.
Our developers don't talk to customers. Showing them Hotjar recordings of user sessions makes them empathetic when our users stumble, and it gives them a sense of pride when they see a user complete a task they just worked on.
7 ways recordings help you understand your users
Recordings are helpful in a range of scenarios, from usability testing and post-launch product research to bug-fixing. Let’s take a closer look at some ways you can learn from them.
1. See how users interact with elements on your page
No matter how well-designed your page is, your users may navigate it in baffling ways you could never have expected. And when users are interacting with elements in ways you didn’t intend, it usually means something’s going wrong.
Unexpected interactions could include:
Clicking images, words, or graphics that aren’t clickable
Scrolling past key information or call-to-action (CTA) buttons
Revisiting sections multiple times (indicating possible confusion)
Struggling to fill in forms
Encountering bugs or user interface (UI) issues when clicking website elements
Recordings let you spot these unexpected behaviors, so you can fix issues and deliver an all-round easier experience.
💡Pro tip: are you part of a SaaS product team? Watching Recordings can also help you gauge how well users are adopting new features. For example, if you’ve launched a highly-requested feature but users aren’t trying it, the feature might need additional signposting.
Case study: uncovering hidden obstacles
Jeff Bronson, a business analyst at Ecommerce Warriors, was helping an ecommerce store deal with a drop in sales. Reviewing Hotjar Recordings for the site, Jeff noticed users were struggling to add products to the shopping cart:
“On product pages with size options, it wasn’t obvious that a size needed to be selected in order to proceed with the purchase. So the shopper kept trying to click ‘add to bag’ with nothing happening. You’ll see by the red dots, in this recording it took someone over three click attempts before figuring out the size-selection process.”
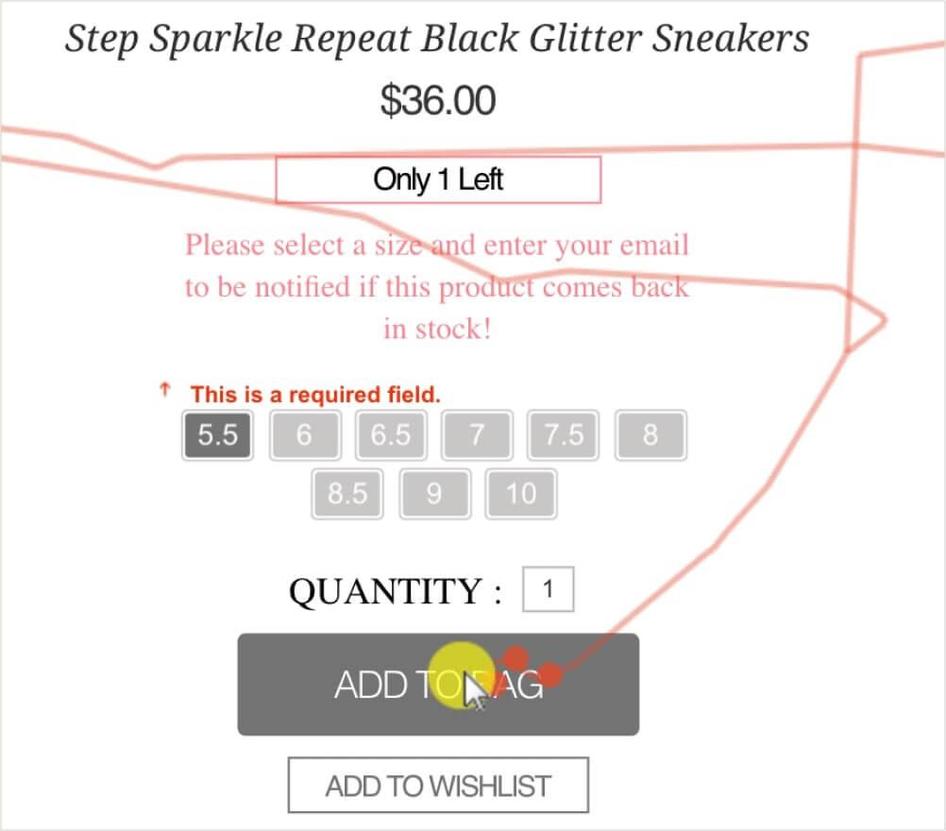
Following this insight (and others), Jeff was able to make key recommendations for how his client could simplify the customers’ journey.
Read the full Ecommerce Warriors case study to learn more.
Showing clients analytical numbers about what happened and where isn’t always enough. When I introduced visual insights into ‘why’ shoppers behave certain ways, specifically session recordings, I saw jaws drop and excitement build.
2. Compare the journeys of users who did and didn’t convert
Conversion rate optimization for your website is like detective work. The reasons your users converted (or didn’t) aren't always obvious. You’ll need to find ‘clues’ in their behavior. 🕵️♀️
With Hotjar Events, you can filter recordings by a key conversion action—like when a user clicks a key button. Then, compare journeys from users who clicked vs. those who didn’t.
This can help you find ‘conversion clues’, like:
Non-converting users don’t read your FAQ section, but converting users do. This suggests that users have a key question they need to answer before converting. Answering this question earlier in the journey could improve conversions.
Non-converting users type in the search bar, but converting users don’t. A trend like this could indicate that your search bar is returning unhelpful results and confusing your visitors.
Comparing journeys is particularly helpful when you’re trying to improve conversions by A/B testing different pages.
Use Hotjar to filter your recordings according to which A/B variant your users saw. Then, combine this with other filters to find the most relevant recordings in less time.
3. See what users did just before they dropped off or abandoned their shopping cart
When you’re reviewing journey data using traditional analytics tools, you might find users are dropping off from a specific page. There could be many reasons they’re leaving—but you’ll need to dig deeper to find out.
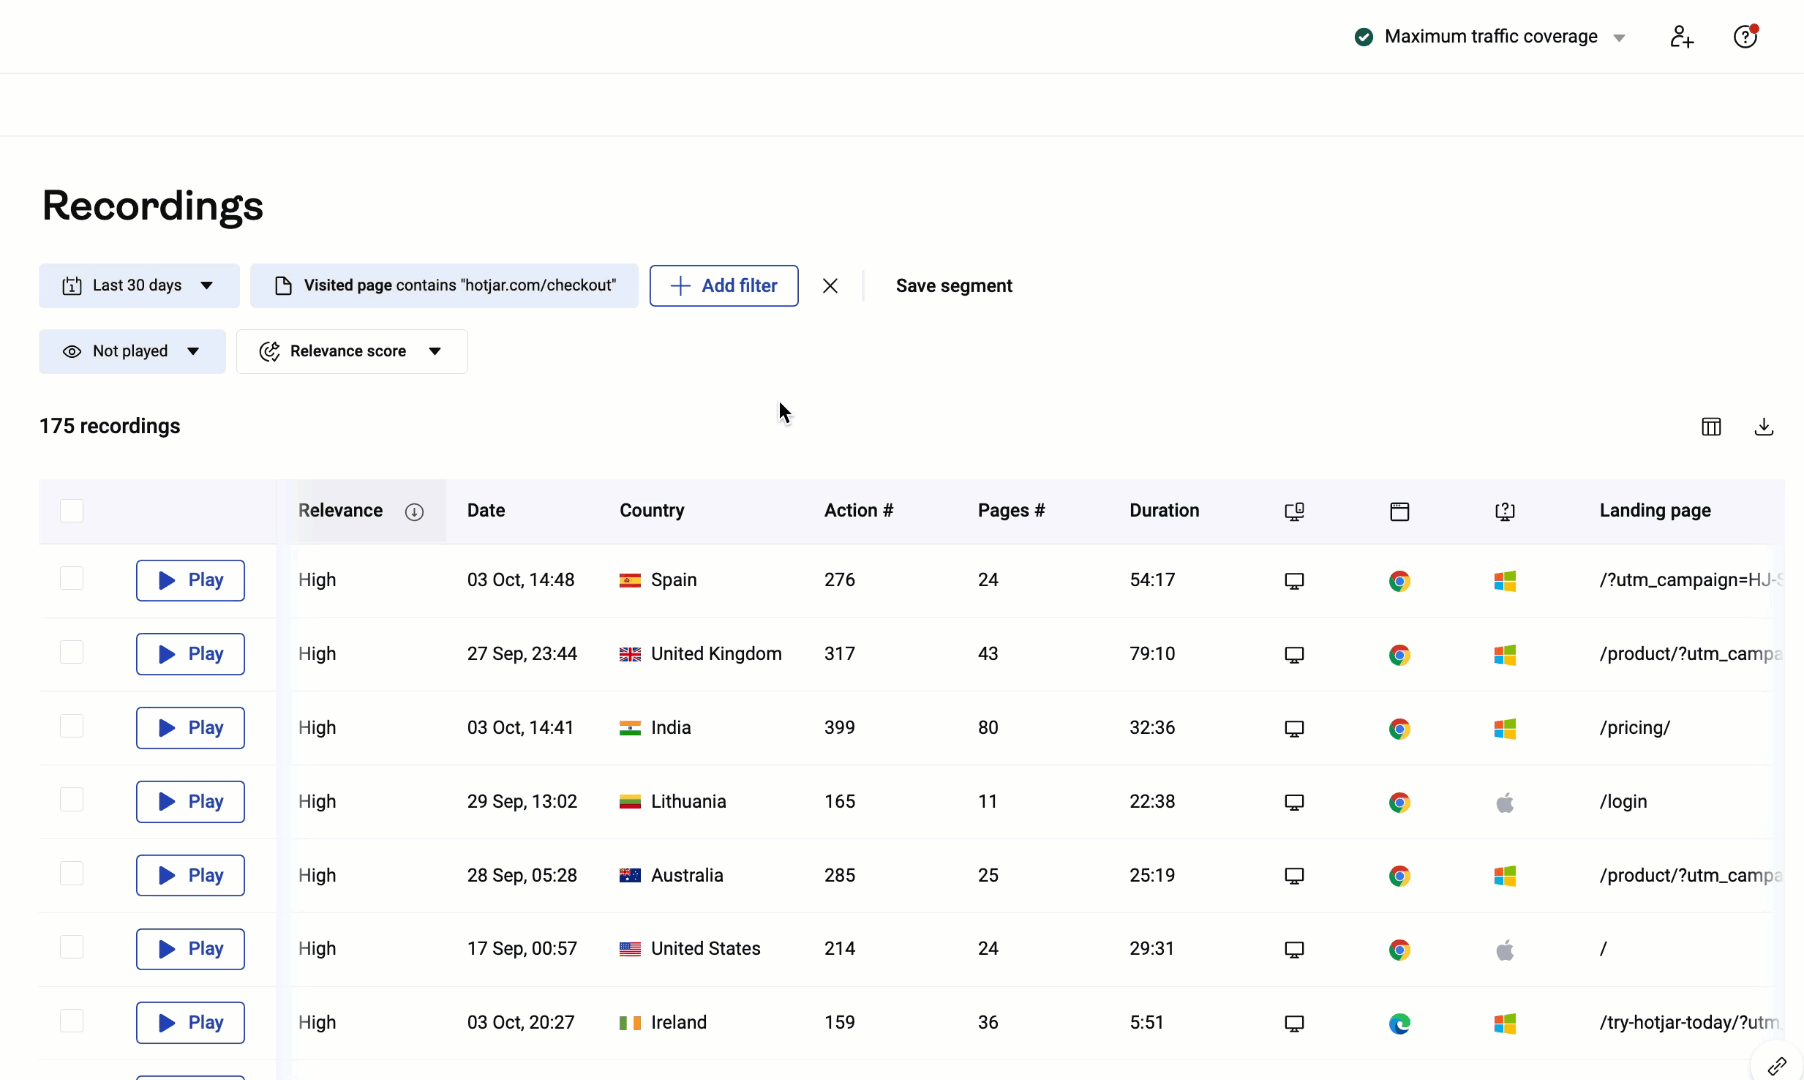
This is a great time to sync data with Hotjar via our Google Analytics integration, filtering your recordings by pages people visited or using Events to filter by specific user actions.
A Hotjar user sets up filters based on Google Analytics data
So: what does this teach you?
Recordings might show that, just before they leave, users are:
Clicking an ‘Add to cart’ button that doesn't work
Watching a product explainer video that displays badly on mobile devices
Immediately scrolling down to your price but stopping before they notice you offer payment plans
All these findings give you a good indication of what’s causing the visitor to leave. By fixing these issues, you could keep visitors on your site longer—hopefully long enough to become paying customers!
Remember, there are loads of ways to combine Hotjar Recordings with other qualitative and quantitative data. Read our advanced recording tips to learn more.
💡Pro tip: when you need more help understanding why users drop off, set an exit intent Survey to appear when they’re about to close the page.
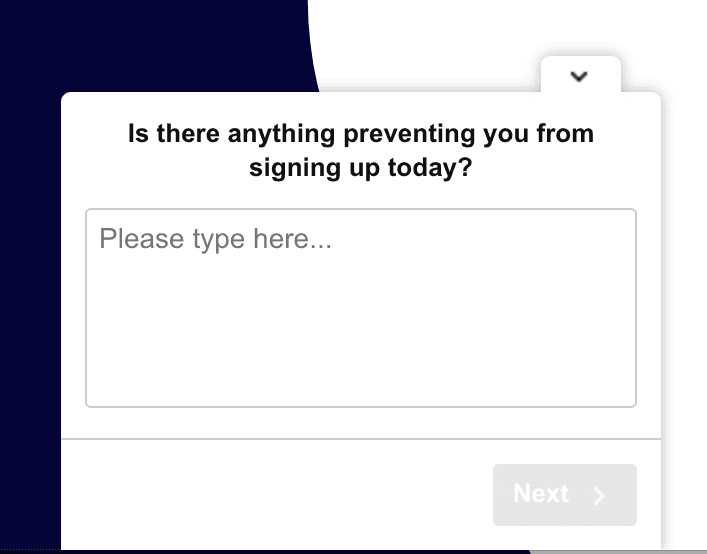
Design tool Miro used this exit survey on their sign-up page
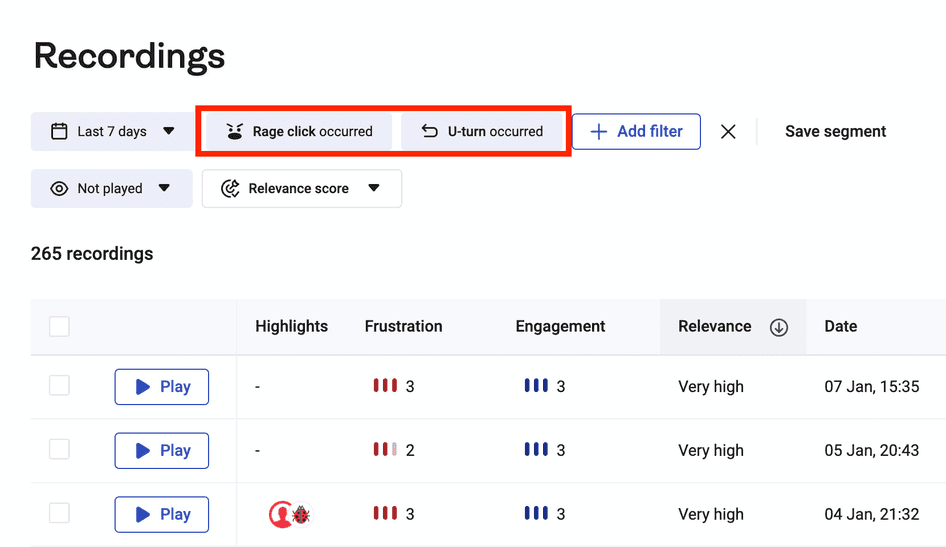
4. Zero in on journeys that include signs of frustration and uncertainty
When something isn’t working on your website, there will often be tell-tale signs in your users’ behavior.
Common signs of frustration and uncertainty include:
Rage clicks: when users click multiple times in rapid succession (usually indicating a broken link or poor UI)
U-turns: when users navigate to a page and then quickly turn back to the previous one (indicating they’re lost or struggling to find the right information)
With Hotjar, you don’t need to sift through thousands of recordings to find journeys that include rage clicks or u-turns. Instead, filter recordings by those specific behaviors—then conduct a Recording analysis to find out what was bothering these users.
5. See why users are taking an unusually long time to complete an action
When you’re looking for user behavior clues to learn from, you might investigate the amount of time users spend on a page.
If your quantitative data suggests that, on average, people spend a significantly longer time on one key page than others, it’s time for a closer look.
On lead generation pages: long average page views times are an indication that there may be UI issues with the form.
On checkout pages: it could indicate that customers are wary about submitting card details, or that your payment process is buggy
On product menu screens: long page views could suggest that your product list is overly complex and users can’t find what they need
By viewing recordings, you can look further into the user journeys on those specific pages. Try watching what users are doing to find out exactly what’s keeping them on the page for so long.
💡Pro tip: with Hotjar, you can use filters to find Recordings from a specific page. When playing back Recordings, you can also skip long periods of inactivity (which could mean the user simply got up to make a cup of tea).
6. Understand how journeys vary between audience segments
As an online business, you might want to understand how well your website serves different ‘types’ of users. Looking closer into their journeys can help you find new ways to optimize your site for them. For example:
7. Discover how to optimize onboarding in your SaaS app
For SaaS businesses, a great onboarding experience can be the difference between a brand advocate and a lost customer. Make onboarding as helpful and intuitive as possible, and you’ll get users off to a flying start with your app.
When it’s time to evaluate your onboarding sequence, recordings show you what’s working (or not) for your users.
Watch them to find out:
Which tutorials and tips your users skip
How long they take to progress through each stage
Where they look for help
Which features they explore first
By identifying trends in user behavior, you’ll be able to find new opportunities for optimizing your onboarding experience.
Case study: optimizing onboarding journeys
Marketing app DashThis found that 60% of its users faced difficulties setting up integrations during onboarding. Because integrations are integral to the DashThis service, the company used Hotjar Recordings and Surveys to investigate further.
The data revealed users didn’t know where to click to add integrations. On some smaller screen resolutions, key buttons were completely hidden at the bottom of the page. What’s more, the DashThis integrations list wasn’t displayed in a way that was intuitive for users.
Increasing completion rates by 50%
With these insights, DashThis got to work making the buttons bigger and bolder. And to accommodate those with a smaller screen resolution, they added buttons higher on the page. Finally, they modified the list layout, added a search bar, and incorporated other content to guide the user step by step.
Following the changes, completion rates of the onboarding funnel increased by a whopping 50% in just a couple of months. What’s more, DashThis saw a 140% increase in customer satisfaction from the Net Promoter Score® (NPS) surveys it sends to users after their free trial period.
Read the full DashThis case study to learn more.
See what your users see
Recordings are one of the best tools available for understanding your users. By letting you see your website through your users’ eyes, they help you develop deeper empathy for them. And when combined with other data—like heatmaps, surveys, and traditional analytics reports—they let you understand both how users behave and why.
Analyzing recordings is a major aha moment for any online business, and you don’t have to sift through thousands of files to home in on critical insights. Instead, use Hotjar’s filters and integrations to find the most relevant recordings with a few clicks. You’ll get game-changing data in less time, in a handy visual format that’s ready to share with your team.
Learn what your users need
With Recordings, Surveys, and our user interviewing tool, Hotjar Engage, find a wealth of new ways to improve customer experiences.