Learn / Blog / Article
10 ways Hotjar helps you optimize your website UX
To build a great website, you need to help users complete their goals effortlessly at each step of their journey. But how do you determine what users really want, and need, from the pages you’re working on?


Hotjar’s tools give product, marketing, and user experience (UX) teams a holistic view of their users from a single platform. Heatmaps, Recordings, Surveys, Feedback, and Interviews help you and your team at each stage of the UX design process—from researching user needs to testing website iterations.
Get feedback on your website designs
Use Hotjar to run usability tests or get focused feedback on your live website with pop-up surveys.

Great UX is about more than a good-looking website
Every business wants a sleek, professional website that is easy to navigate. But great UX design isn’t just a collection of nice visuals—it involves creating experiences and products that go beyond user expectations. Focusing on customer delight in this way enables you to build an emotional connection and win customer loyalty.
However, customer delight isn’t created overnight. Modern UX is a process of continuous evaluation and refinement of your website (and product) in an iterative manner. That means getting a 360-degree view of your users—and the ability to share it with your teammates.
Let’s explore how Hotjar helps you do exactly that. 🕵️♀️
1. Launch surveys to find out what users are looking for
Your users’ needs are always evolving—and the better you understand them, the better you can
Tailor your website messaging to speak to them
Optimize your site’s navigation around common user goals
Build products and services that solve user pain points
The Hotjar Surveys tool lets you launch different types of surveys to ask visitors quick questions. Use Surveys to find out what they’re looking for, and what’s missing on your site.
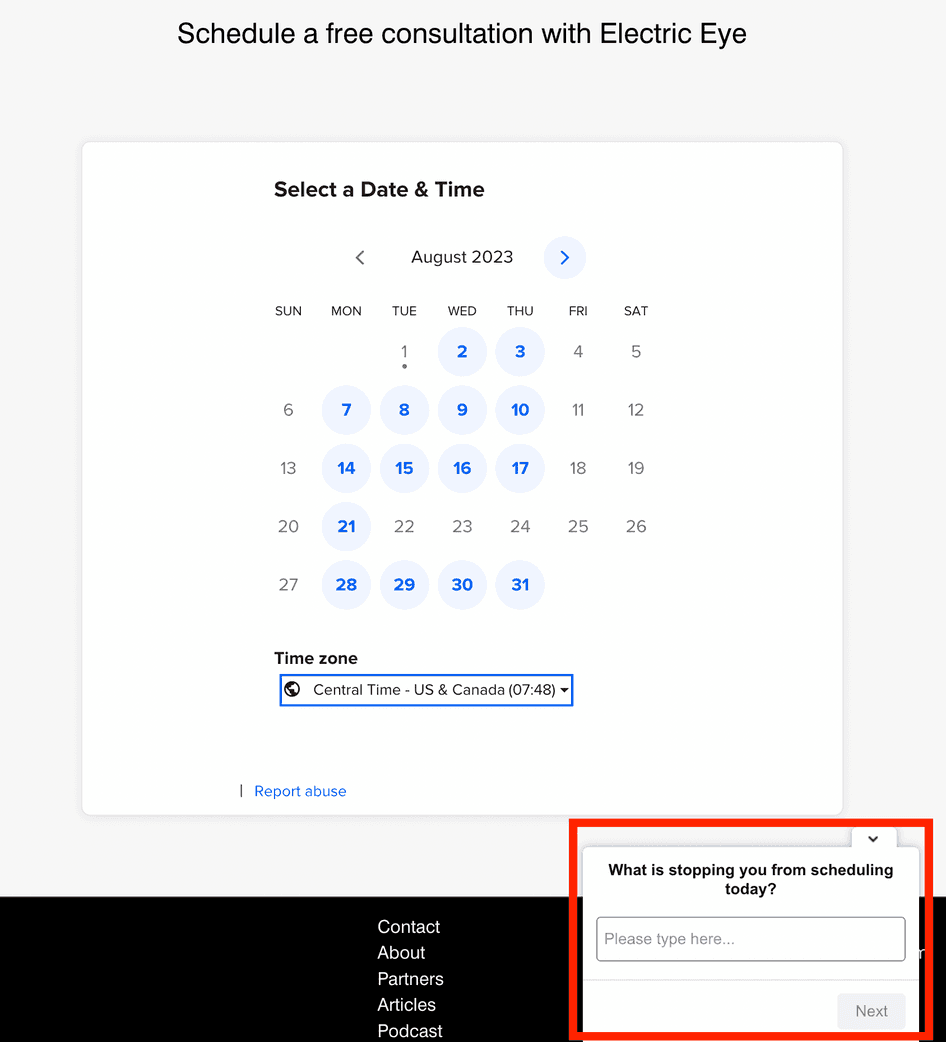
A Hotjar exit intent survey on ecommerce agency Electric Eye’s website
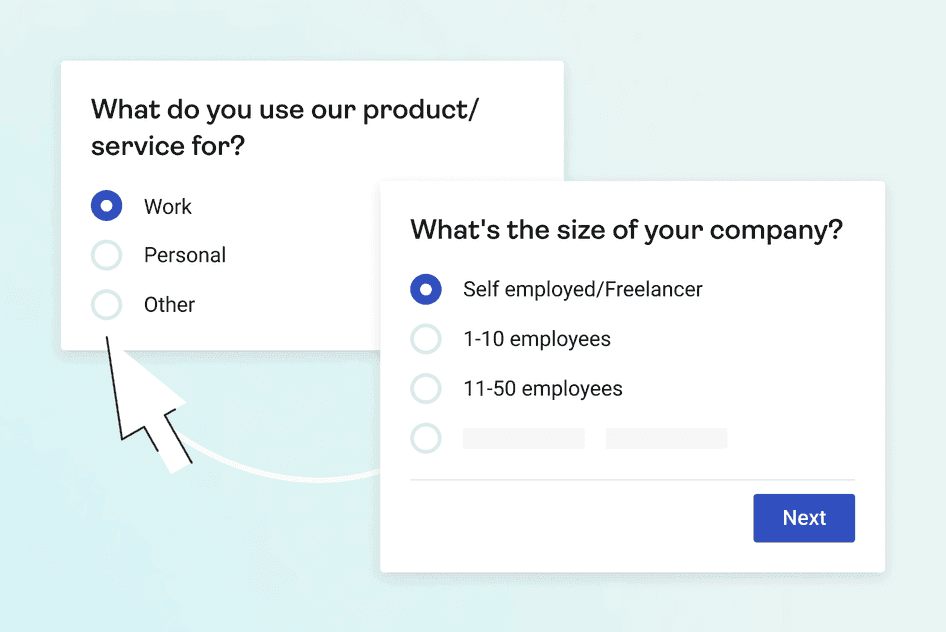
When you want to go one step further, add follow-up questions to segment users. By segmenting users, you create data-informed user personas and optimize the customer journey for each audience you serve.
When it comes to organizing survey results, Hotjar Surveys and Recordings are a match made in heaven: Hotjar connects survey responses with session recordings of the actual users who answered your surveys. So, for example, if a user says they can’t find what they need, you can view their recording to evaluate how they explored your site—and what they missed.
Have you tried Hotjar AI? 🤖
Setting up a survey is easier than ever before with Hotjar AI for Surveys.
Simply tell our AI-powered survey generator your UX research goal, then sit back as it creates the perfect survey for you, summarizes your findings, and gives you a list of next steps.
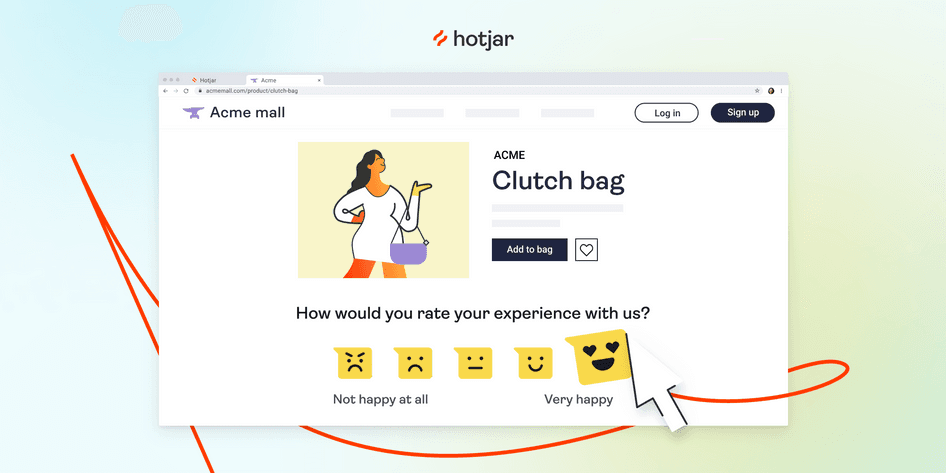
2. Get Feedback on live page design
Want to know what users think about a specific page? Hotjar Feedback shows you by inviting users to rate the page they’re browsing. (Why not tell us your thoughts about this page using Hotjar Feedback? It’s that little red tag to the right of the page. 👉)
There are tons of helpful things you can do with this data—like viewing aggregated scores to discover which pages get the worst ratings from users.
Hotjar Feedback also lets users highlight specific parts of the page they want to rate or comment on, giving you focused feedback on things like unclear pricing tables, distracting design elements, and other issues that only your users would notice.
💡 Pro tip: as with Surveys, Hotjar links any individual feedback response to the recording of the user’s journey. So when you want to understand a particular user response, review their specific journey to get all the context you need (and more).
3. Learn where users drop off
When users leave en masse from a particular page, it’s often a warning sign that the page has issues. To find which pages need content or design improvements the most, assessing drop-offs is a great place to start.
Hotjar Funnels shows you a handy visualization of your entire funnel, so you can easily see where your major conversion rate ‘leaks’ are.
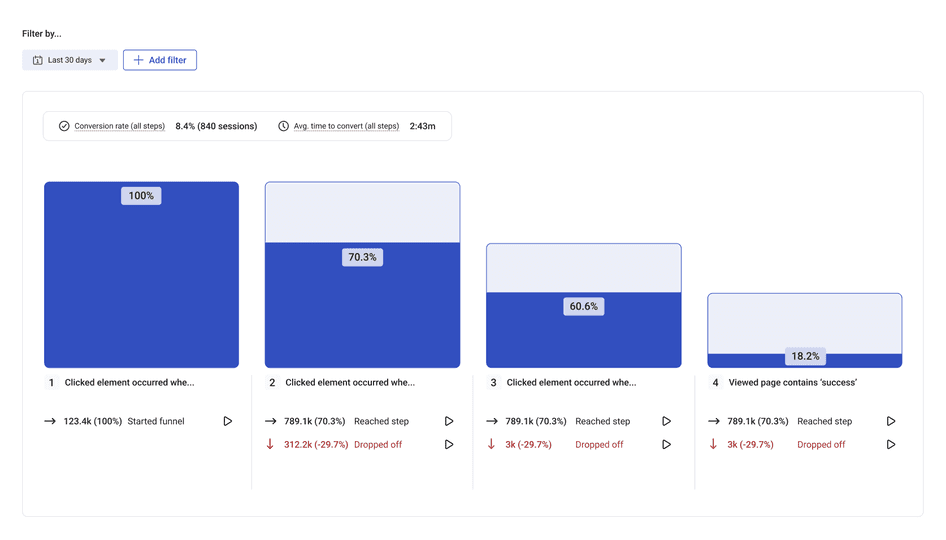
When you want to learn more about why users drop off, click on the ‘Play’ button to instantly bring up relevant recordings and heatmaps.
Hotjar reveals what numbers don’t. Funnels helped me identify where in the customer journey people drop off. Recorded user sessions let me understand what people see when they arrive on our website—what they click and what they don’t click. Heatmaps helped me identify where they spend most of their time and assess if they should be spending time there or not.
4. Find bugs and issues
Web analytics tools, like Google Analytics 4, tell you what users do on a particular page—but they won’t tell you why. When you want to get the deepest possible insights into exactly what’s happening on a page, session recordings have got you covered.
Recordings show you a video-like replay of an individual user’s journey in real time, so you see what they did and how your site appeared for them.
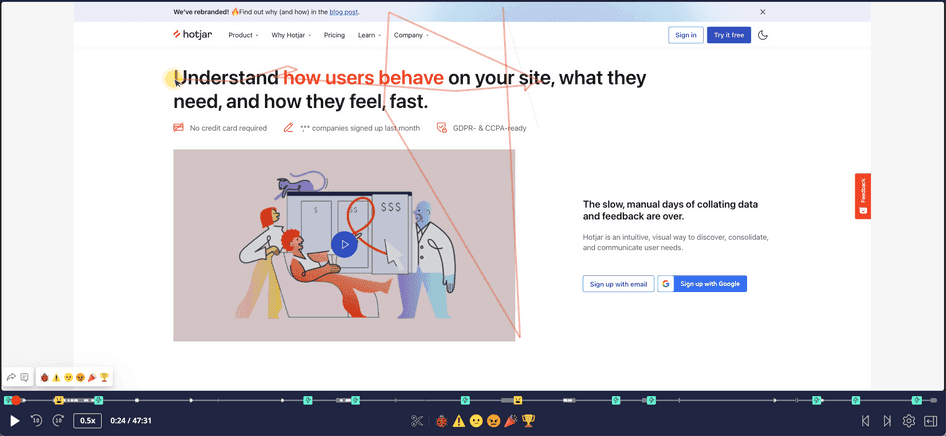
Because you see exactly what the user saw, recordings are great for
Uncovering bugs and design issues
Identifying where users get stuck or lost
Understanding how visitors explore your website
Hotjar also logs signs of frustration from individual user journeys, like when users rage click (repeatedly click on unclickable elements), u-turn (land on your page only to immediately return to their previous one), or leave negative feedback.
In your Hotjar Recordings dashboard, you’ll see a frustration score for each individual recording. Sort your recordings by this column to instantly view the journeys with the most signs of struggle—and find problematic pages faster.
For a UX designer, this is one of the most helpful features in uncovering bugs and common website problems.
Uncover sources of frustration with rage click heatmaps
Hotjar detects rage clicks—instances of users clicking multiple times in quick succession. Users typically rage click when something isn’t working, making it a reliable sign of user frustration.
You can use this to your advantage by creating rage click heatmaps. They show you which parts of the page frequently get rage clicked, so you can easily identify issues like broken links and non-functioning forms.

Rage click heatmaps help you identify problematic page elements in a flash
5. Evaluate page length and structure
You’ve worked hard to design an attractive page that’s easy to digest. But how do you know if visitors consume the content the way you expect them to?
Scroll maps (a type of heatmap available in Hotjar) aggregate data from all your users’ journeys to show how far down the page people scroll on average. This information can help you determine whether most users see content below the fold.
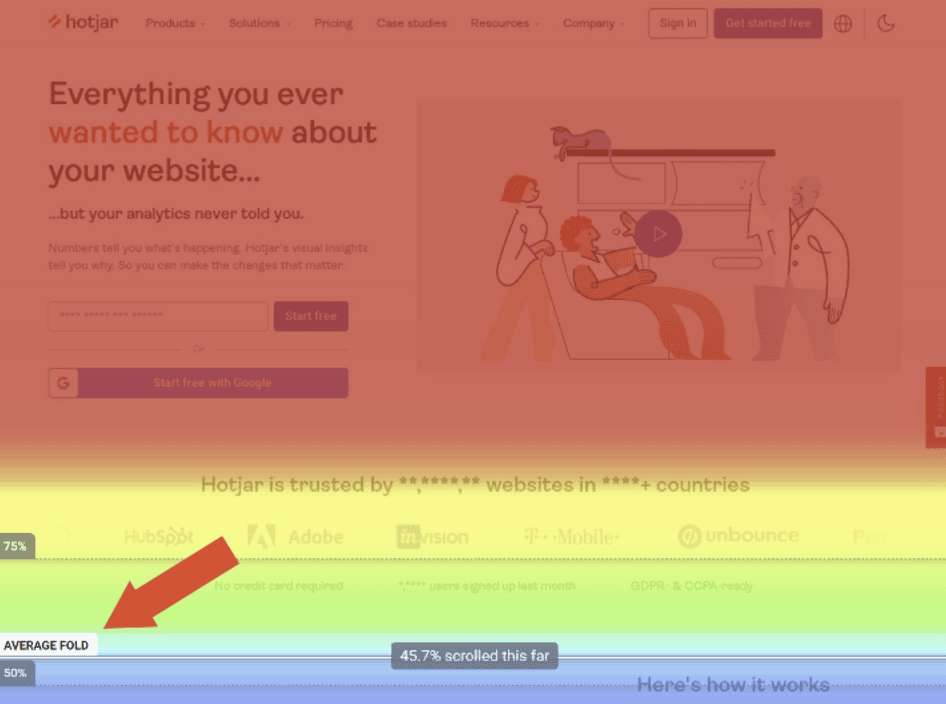
Scroll maps also show how many users make it to the content near the very bottom of the page—an insight that helps you evaluate the position of important content like
Call-to-action (CTA) buttons
Discount offers
Payment plans
Important product information
Ultimately, these heatmaps help you determine whether your page structure supports the user’s information journey—or holds them back.
6. See what grabs users’ attention
Hotjar aggregates data on where your users click (or tap, on mobile devices). You can then create click maps—a type of heatmap giving you a handy visualization of the parts of a page users click on most.
Analyzing click maps is a great way to see if users
Click on non-clickable page elements
Interact with sub-menus, footer menus, and drop-down menus
Show overwhelming interest in a particular link or part of the page
…and much more. By learning what grabs users’ interest on your landing page, you can remove distractions and simplify user journeys.
Learn more about user interest with Engagement Zones
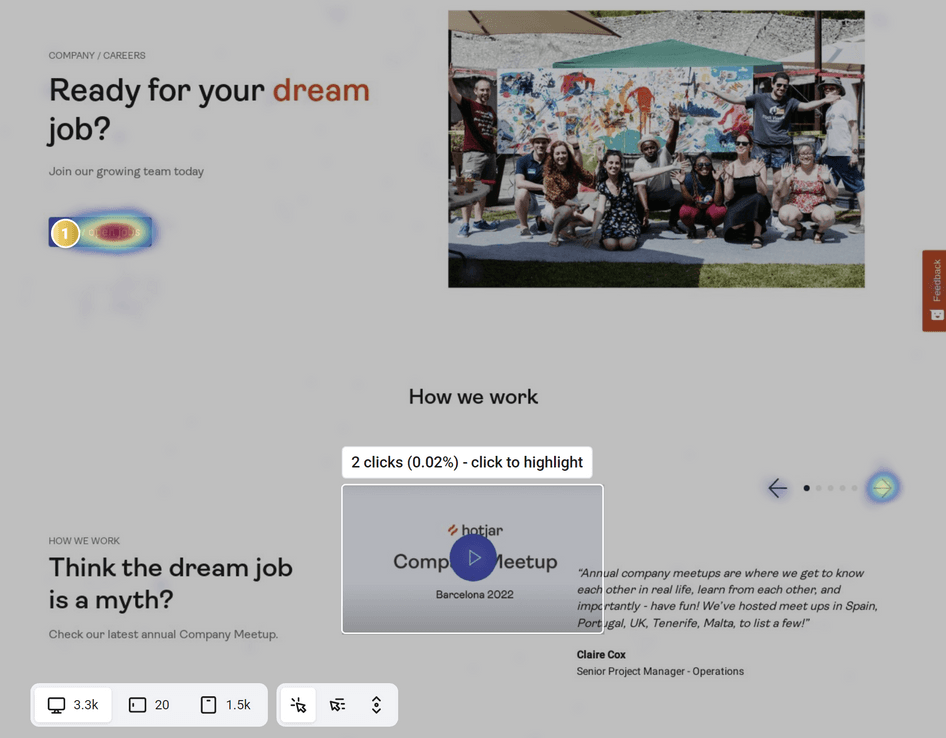
Hotjar offers several different types of heatmaps, including click maps, scroll maps, and move maps.
But did you know Hotjar also combines all three data types to simplify your analysis?
This new type of heatmap, called Engagement Zones, shows the areas of a page getting the most interaction from users—revealing what they’re most interested in and what they ignore.

On the above page, users engaged most with the menu bar and opening paragraph
7. Find out where users get lost
U-turns refer to the action of a user navigating to a page, then immediately turning back—often a sign that they’re lost or confused.
Hotjar lets you filter session recordings by u-turns, so you can take a closer look at individual journeys where they happened. This helps you sniff out problems with your navigation or page design.
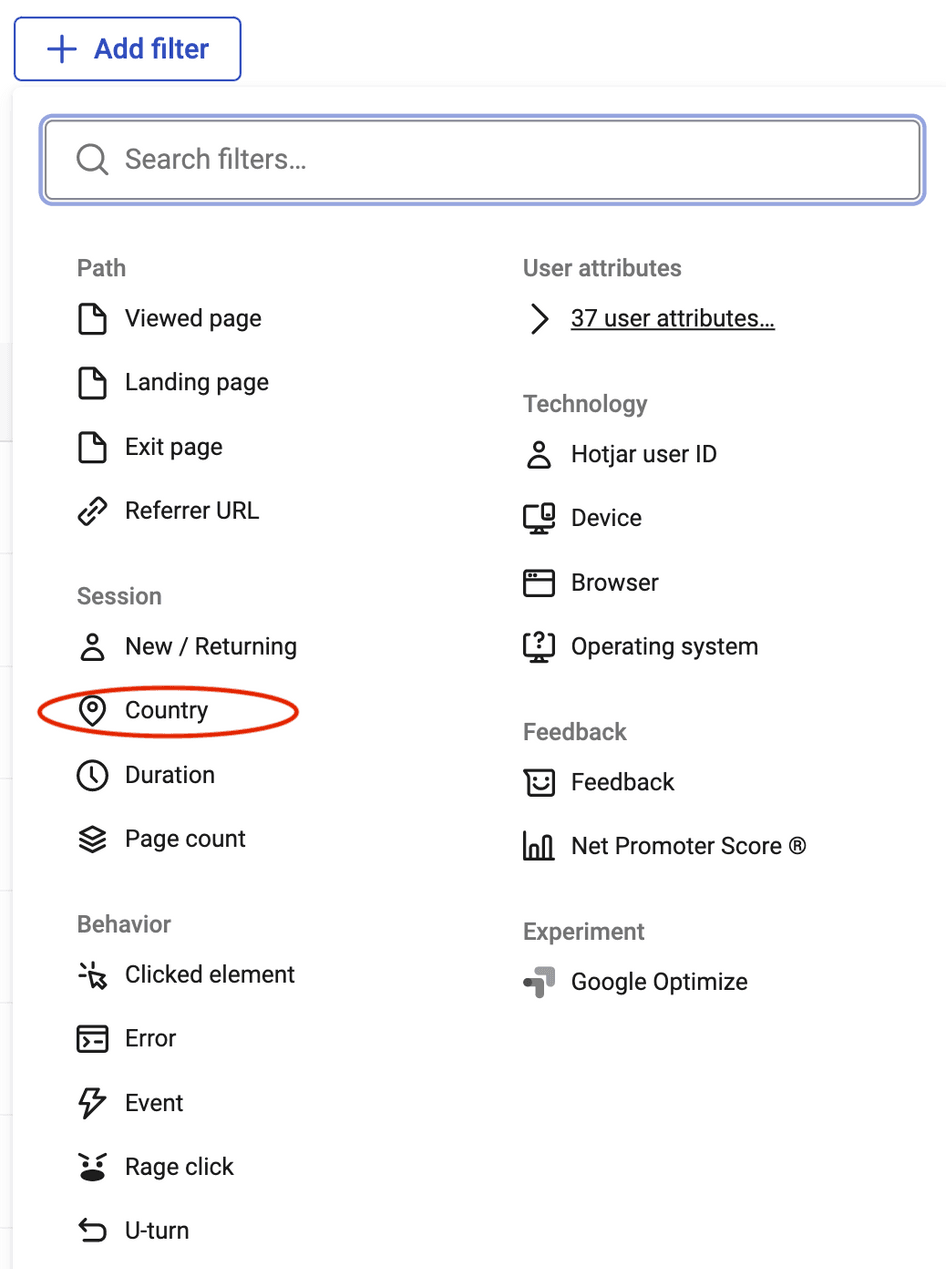
The Recordings dashboard gives you multiple ways to filter your recordings, including by u-turns and rage clicks
💡 Pro tip: when you’re making efforts to improve your navigation, track u-turns via Hotjar Trends. The Trends tool visualizes how often users do specific behaviors, so you can see the impact of your design improvements.
Trends lets you visualize events on-screen as line or bar charts
8. Recruit the right participants for usability testing
You’re already basing your UX decisions on user insights—and that’s a great start. But to delight your users, you need to see how they respond to your designs once they’re brought to life.
The best way to do that is by conducting usability testing with users from your target audience. By watching them navigate your website, you’ll identify issues and get focused feedback on your UX.
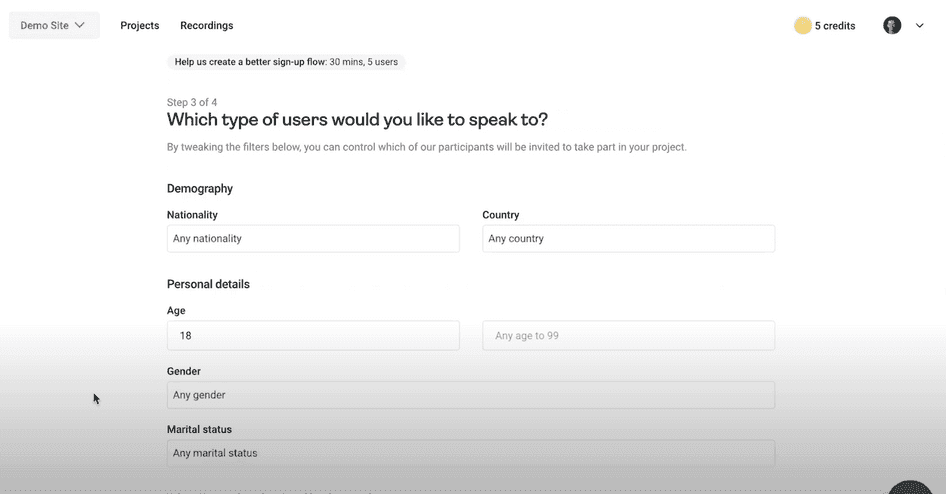
Hotjar’s interview tool, Engage, streamlines the process of recruiting usability testing participants from start to finish. Tell Engage your recruiting criteria, and it will automatically recruit and screen participants from our global pool of 200,000+ interviewees.
Alternatively, bring in participants from your own network by sending them an invite link directly from Hotjar.
💭 Did you know?
Engage also helps you schedule, host, and analyze testing sessions. Tell Engage when you’re available, and let it automatically schedule calls when you’re free.
Once the call starts, hit ‘Record’ to capture both audio and video. Engage creates an automated transcript after the call ends and lets you comment on the video to discuss critical findings with your team.
9. Get buy-in on ideas
When you have a great idea for improving your website’s UX, you need to get sign-off from your team—often easier said than done!
But if you’ve been using Hotjar in your UX process, you’ll already have some fantastic product experience (PX) insights, like
Recordings showing multiple users encountering the same website issue
Heatmaps revealing which buttons get the most clicks on your homepage
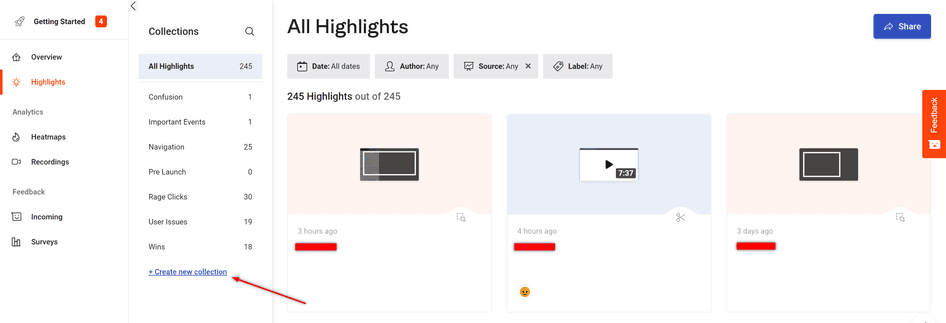
Data like this helps you present a strong case for implementing your ideas in the next website iteration. And with Highlights, a collaborative Hotjar feature made for teams, you can easily share findings with colleagues in just a few clicks.
Once you’ve created a highlight of an interesting behavior, organize these fragments of your session recordings and heatmaps into easily accessible folders called Collections. Share these collections with your team, so everyone can view and discuss the same data (without wading through an ocean of links).
💡 Pro tip: add comments to any highlight collection to give extra context to your teammates. Then, choose a label to show what type of highlight you’re sharing, whether it’s a bug, frustration, or conversion.
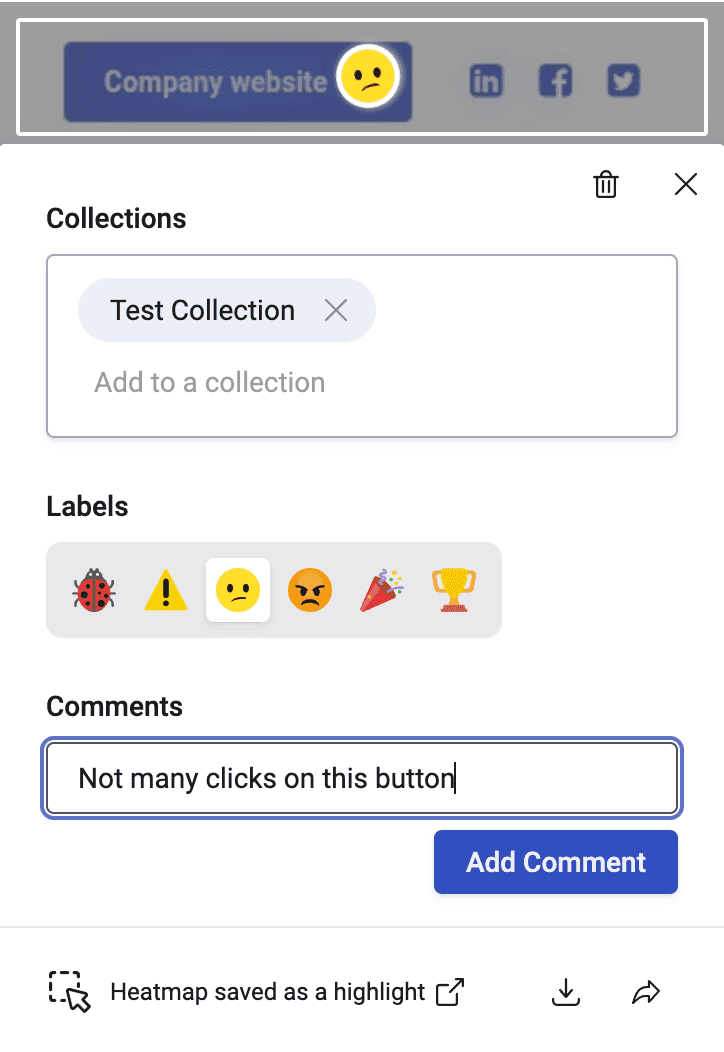
Label your highlight and add it to a collection
10. Understand A/B test results
After getting buy-in on your ideas for UX improvements, it’s time to put them into action. When you’re launching a new iteration of a web page, A/B testing can help you understand the impact of your changes.
A/B testing reveals which of your page variants performs better—but it won’t tell you why. And without knowing why one variant is winning, it can be difficult to extract meaningful conclusions from your tests.
Hotjar data tells you why one variant outperformed the other.
Heatmaps reveal what grabbed your users’ attention. For example, they might show that users didn’t click your main CTA because they weren’t scrolling down far enough to see it.
Recordings show you what users did before converting (or leaving). Filter your data to compare journeys of those who converted with journeys of those who didn’t.
Surveys let you ask users directly what they think of each page. Use these first-hand insights to support your other data.
With extra clarification on your A/B testing results, you can learn what works for your users—and why. This helps you build up your internal best practices so you can keep improving UX around user needs and preferences.
💡 Pro tip: when you’re setting up your A/B testing tools, consider using Hotjar’s Optimizely integration. This makes it easy to filter your session data by Optimizely experiments and launch surveys on each page variant.
Create better user experiences in less time
When you want to build website journeys that delight your customers, getting a complete view of your users is non-negotiable. Hotjar gives you all the user insights you need from a single platform, helping you join the dots between your data.
And because Hotjar makes it easy to share your findings, you can spend less time organizing data and more time taking action on it. That means getting UX, product, and marketing aligned on great ideas—and creating experiences your customers love.
Stay up to date with users
Hotjar can send user feedback to Miro, Figma, and Slack, helping you use the latest insights to inform your design work.
FAQs about Hotjar for UX design
Related articles

Solving common problems
How to evaluate the impact and reach of website bugs
Those pesky bugs. Even with the most meticulous checks possible, one or two usually make it through to production.
It’s vital to evaluate website bugs as they come up, so you know how urgently you need to fix them. Without taking a moment to assess impact, you’ll be shooting in the dark.
You might invest your precious resources in unnecessary work, or worse—underestimate the problem and cause frustrated users to take their business elsewhere.
Hotjar team

Solving common problems
Create an effective landing page using these free tools (video tutorial)
Your website is still one of your most important business tools, yet only 15% of websites average over 100,000 unique monthly visitors. In order to create successful websites that convert, consumers have access to an array of tools and features that promise to simplify their lives.
However, the overwhelming abundance of options can sometimes lead to more complications. Business owners often find themselves wondering, "How can I easily create a landing page that converts without design resources, IT support, or expensive optimization experts?"

Marc Hans

Solving common problems
10 ways Hotjar helps you understand your users better
Your sales are down; the well's running dry. What do you do to encourage people to buy from you: add a new product or service or multiply an existing product's features?
Increasing choices and features may be a business's automatic response to boost interest and, later on, conversion and sales. But more is needed to justify using company resources to create a solution that may or may not resonate with customers.
To achieve real, needle-moving change, you need to dig deeper and understand users better—what motivates or frustrates them and what hinders or helps them satisfy their 'jobs to be done'.
Hotjar team