Learn / Blog / Article
Qualitative vs. quantitative user research: the answers you will (and won’t) get from each
How much research did you conduct before launching your last marketing campaign? Or running your last A/B test? Who had the final say on your website redesign?
If you want to make better—more profitable—marketing decisions, you need research to back them. Qualitative and quantitative research both have a role to play: together, they give you a rich portrait of what your customers want and need.

Table of contents
The difference between qualitative and quantitative research
3 qualitative research methods & what you’ll learn from them
How to get buy-in for user research—no matter what kind you need to do
The difference between quantitative and qualitative research
Quantitative research is designed to gather data points in measurable, numerical form. Qualitative research relies on the observation and collection of non-numerical insights such as opinions and motivations. Essentially, quantitative research gives you hard data, while qualitative helps you explore more in-depth ideas.
For digital marketers, a common quantitative source is Google Analytics. Using GA and other traditional web analytics tools, you can see the raw number of visitors who came to your site, or the percentage of visitors who converted into leads or sales.
Qualitative sources include research methods like open-ended customer surveys. You can learn about common pain points of your buyers or which product features are most interesting to them. The answers describe the frustrations and desires of your target audience.
Not every source of research is quantitative or qualitative. For example, you may send out a standard Net Promoter Score survey to customers that includes both quantitative questions (e.g., how likely are they to recommend your product on a 0 to 10 scale) and qualitative questions (e.g., what is the reason for their score).
Using qualitative and quantitative sources together

Why is it useful to ask both types of questions? Because quantitative data usually answers the what but not the why:
Google Analytics tells you how many organic visitors came to your site but not why they clicked on your search result
Mailchimp delivers stats on clicks and open-rates but tells you nothing about the particular word or phrase in your subject line (or something else) that inspired the open.
Without qualitative research, you risk creating narrative fallacies that try to explain the why when there’s no data to support it.
'Huh', you may think. 'The bounce rate is really high for this service page. I bet it’s because the image we’re using isn’t very interesting. We should get new hero images.' That’s a narrative fallacy: a conclusion drawn without data. The bounce rate could be high because your tracking isn’t working well, the page has fewer internal links, the headline is confusing, or a hundred other reasons.
When you want to improve and optimize your website, narrative fallacies undermine your work. Instead of making changes or focusing tests on what the quantitative and qualitative data insights suggest, you test ideas based on intuition—and when you do so, fewer tests will generate a ‘lift’, wasting time and money.
Why quantitative and qualitative user research is important: 3 use cases
Research is the backbone of testing. That backbone supports six- and seven-figure business decisions like UX choices for major site relaunches and copy choices for million-dollar ad campaigns. There are three primary use cases:
1. Conversion optimization
On the surface, conversion optimization may seem simple: tweak a button color, change a call-to-action, and reap profits. But that’s not how it works, and why lists of conversion optimization ‘best practices’ are pretty useless.
As my boss Peep Laja likes to say,

“Reduce your prices to 99 cents for every product, and your conversion rates will go up immediately. But you’ll also probably go out of business.”
Conversion optimization is about much more than random site changes. It’s about doing the research to understand what your customers need, what makes them hesitate, and what they think about your product and site experience.
Once you know those answers, you’ll have a better idea of what to test and what to test first. It means more tests will deliver money-making improvements, and you’ll make the highest value changes first.
Editor’s note: at Hotjar, we use this Conversion Optimization Action Plan that you can copy and re-use as a template to give your optimization efforts more structure. Take a look at the full guide on how to fill it in and increase conversion rate using qualitative and quantitative sources.
Learn why your visitors aren’t converting
Hotjar shows you what keeps your visitors from buying, so you can make website changes based on real insights, not assumptions, and watch your conversion rate grow.

2. Site redesigns

Site redesigns are a huge risk. Too often, the decisions around a redesign are made by the highest paid person. If you’ve spent years making minor, data-backed changes to your site, you can quickly throw them away with a big redesign.
The difference between a major redesign and those small changes is known as a ‘radical’ versus ‘iterative’ redesign. If you can stick to iterative redesigns, you’re less likely to spend hundreds of thousands of dollars on a website that performs worse—maybe way worse.
Still, there are some situations when a major redesign is necessary:
Your company makes a major shift in product or brand
You hit the 'local maxima' for your site—the point at which you’ve exhausted all iterative opportunities
You don’t have enough traffic to get the data necessary to run A/B tests
Research is essential to both approaches. It’s also the best way to protect your site during a radical redesign. Quantitative and qualitative data can help justify the design and copy choices that are most likely to make users happy (and make your company more money).
3. Everything else
Great user research does more than just organize your tests or guide a site redesign. That same research can help you understand how to segment your email subscribers, which blog topics you should write about, which product features to highlight, or the copy that’s most likely to earn clicks on Google Ads.
So how do you gather all this data?
4 quantitative methods for research & what you’ll learn
Method 1: technical analysis
If you’re an SEO person, you may be most familiar with the technical analysis of a site. Most of this data lives in Google Analytics. The goal of technical analysis is to identify behind-the-scenes site issues that negatively impact the user experience.
For example, during a technical analysis, you may notice that product pages are exceptionally slow because the image sizes are too large. (You can check page speed directly in Google Analytics or in tools like Google PageSpeed Insights.) Or you may see that users of Android devices have a much higher bounce rate than users of Apple products.
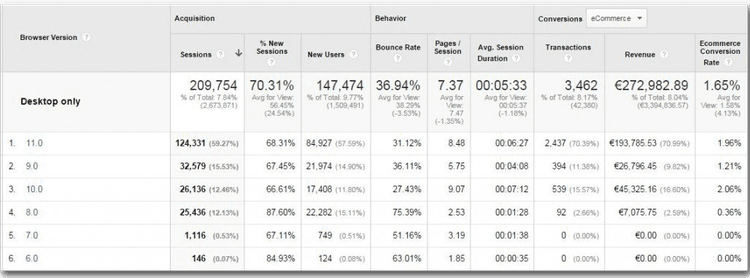
IN THIS EXAMPLE, IT’S EASY TO SEE THAT OLDER VERSIONS OF INTERNET EXPLORER HAVE FAR WORSE CONVERSION RATES—AN ISSUE THAT’S COSTING THIS COMPANY THOUSANDS IN REVENUE
For each component of technical analysis, you’ll come away with hard numbers—pages with load times above 10 seconds, devices with above-average bounce rates, browsers with below-average conversion rates, etc.
Method 2: digital analytics
The second component of quantitative research, digital analytics, also takes place (mainly) in Google Analytics. There are two goals:
Identify the most important parts of the site
Ignore the metrics that don’t matter
Before you dive into the data, make sure your tracking is set up properly. Is the tracking code on every page? Are there multiple tracking codes? Is Goal Tracking recording conversions correctly? Analyzing bad data is a waste of time.
(So is analyzing data that doesn’t matter. Metrics like 'Time on Page' are generally useless because they require a second interaction to record the time—the last page every user visits will likely record a Time on Page of 0 seconds.)
What is the most important action someone can take on your site? For B2B companies, it may be filling out a lead form. For e-commerce companies, it’s almost certainly completing a purchase. A review of your analytics can show you which pages are valuable and which ones ‘leak’ money.
For example, does a sticky bar on the homepage generate tons of leads? It may be worth testing on other pages. Does a particular product line have a high cart abandonment rate? You need to find out what’s causing uncertainty for buyers.
Ultimately, digital analytics should give you a good idea of what people do on your site, and how that compares to what you’d like them to do.
Method 3: mouse tracking
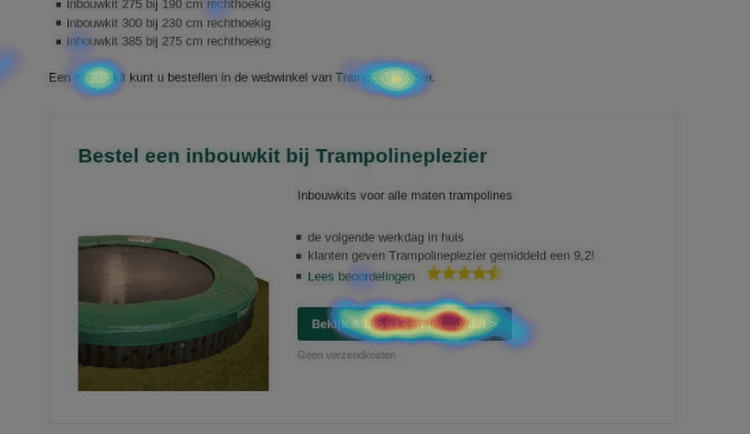
'HOVER MAPS' SHOW MOUSE MOVEMENTS AND 'CLICK MAPS' SHOW ATTEMPTED MOUSE CLICKS
Mouse tracking traces user movements on a website. Often, movements and interactions are layered on top of one another to create a heat map—red parts represent places with lots of activity; blue sections show areas that get ignored (by the mouse, at least). There are different types of heat map reports you can use:
Reports that show where the mouse moved are known as 'hover’ or ‘move maps'
‘Click maps', that highlight hotspots based on clicks
‘Scroll maps’ which use scroll tracking to record how far down the page users went
A fourth type of report is session replays, which log the ways individual users interact with and browse through different pages.
There are two common learnings from this type of analysis:
Identifying elements that visitors think are links but cannot be clicked. This is usually an easy issue to solve—simply expand or add a clickable area.
Seeing how far users make it 'below the fold', if at all. On many websites, users never scroll below the fold. Understanding if they scroll (and how far) can help you figure out where to put important content. You don’t want to leave critical information where no one sees it.
Method 4. user testing (quantitative feedback)

User testing allows real people to use and give feedback about your website, which in turn helps you collect quantitative and qualitative data (the latter is discussed in the next section).
Typically, you provide the user with a task and record their screen movements and narration as they complete the task. There are three types of tasks:
Broad: 'find a chef’s knife'
Specific: 'find a 10-inch Wusthof chef’s knife'
Funnel completion: 'find a chef’s knife and complete the purchase'
The quantitative feedback is usually the amount of time it takes a user to complete a task. For example, if you’re revamping your checkout process, you can time users on the old site and the new. If the new version reduces the checkout time by 30%, you know you’ve made progress.
If it takes longer than the previous version, the 'intuitive' design changes may not be so intuitive after all. The good news is that you have a chance to fix those issues now before pushing the new site live: you don’t want to realize your mistake only after revenue begins to decline.
3 qualitative research methods & what you’ll learn from them
Too often, marketers ignore qualitative research. It’s messier, and it can be expensive. But it’s also vital—you learn what your customers think and, critically, the words they use to describe their thoughts. Often, that information translates directly into high-converting copy.
These are the three primary qualitative methods of research:
Method 1: heuristic analysis
At the beginning of this article, I mentioned the danger of relying on opinion instead of research. While that’s true, an expert’s opinion still has value. That’s what a heuristic analysis is: an experience-based assessment of your website run by an expert, based on an evaluation framework. For example, here’s the one we use at CXL:
Relevancy: Does the page meet user expectations?
Clarity: Is the content/offer on the page as clear as possible?
Value: Is the page communicating value to the user? Can it do better?
Friction: What on the page is causing doubts, hesitations, or uncertainties?
Distraction: What on the page does not help the user take action?
The takeaways from a heuristic analysis are not absolutes. Instead, like other research components, they’re pieces of the puzzle.
Once you’ve conducted all your research, you’ll be able to see which other data points reinforce your heuristic takeaways.
Method 2: online surveys
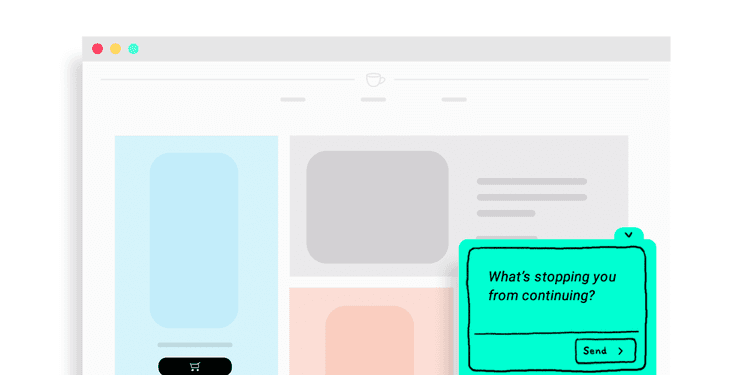
OPEN-ENDED EXIT SURVEYS CAN PROVIDE BITS OF INFORMATION ABOUT WHAT CAUSES FRICTION FOR USERS ON YOUR WEBSITE.
Surveys are a huge topic—enough to deserve way more than a section of a blog post. That said, here are a few guidelines.
If you want to survey site users, you can run on-page surveys or exit surveys:
On-page surveys typically target a subset of pages. For example, you could ask blog visitors which topics they’d like to learn more about.
Exit surveys prompt users to finish a survey just before they leave your site.
On-site surveys are best to gather smaller bits of qualitative research. If you want deeper feedback, you’ll need to conduct user interviews (by phone or focus group), send out a survey to email subscribers/customers, or pay for a research panel to push a survey to your target audience.
To make qualitative surveys successful:
Ask open-ended questions: you’ll learn more from open-ended research questions than you will from yes/no or multiple-choice questions. When it comes to qualitative feedback, you want to learn what customers really think—and to hear them explain it in their own words.
Avoid leading questions: it’s easy to guide customers toward an answer. For example, if you’re redesigning your website and ask, '”How easy was the checkout process?” you’ve already planted the word 'easy' in their head. It would be better to ask, “Describe your experience during checkout” or “How easy or hard was it to check out?”
Code your answers properly: coding is a manual process to group answers thematically and analyze them. Coding will help you spot the patterns in responses and, as a result, see how those patterns align with other data points.
Method 3: user testing (qualitative feedback)
The qualitative component of user testing is two-fold:
First, you can listen to users narrate their experience. User testing subjects are asked to 'think out loud' as they move through your website. By getting access to their thoughts, you learn how they feel about particular elements and more about why something is easy or hard.
Additionally, you can give user testing subjects a post-task survey. It’s best to deliver the survey as quickly as possible before memory fades.
How to get buy-in for user research—no matter what kind you need to do
It’s not easy to get buy-in for UX research: it can slow down a site relaunch and require a decent chunk of change. That doesn’t make it less essential.
One of the strongest cases you can make for user research is how much money it saves:
Development resources are expensive. Conducting research before coding a site design makes it more likely that early decisions will be the right ones. Recoding large sections of the site is more expensive than upfront research.
You’re already spending money on CRO and ads. If you’re already spending thousands or millions to optimize or promote a site, shouldn’t you invest a few thousand dollars to give CRO and ad teams the research they need to spend those resources wisely?
Building a culture of research
If you’re just getting started with user experience research, here’s an outline of the five-step process to make it part of your company’s culture:
Build an internal team of advocates. Almost every marketing team will use research—SEO, PPC, CRO, content, etc. Find members of other teams to support the cause and help make the case.
Create a framework/outline of the process. You’ll struggle to earn buy-in if you just ask for funds for 'research’. The methods outlined above will help you make more specific requests, including the tools you may need.
Make user research visible in your company. The benefits of research aren’t always visible—they may result in better test prioritization or blog topic selection. Posting outcomes of research (like user personas) around the office can help remind colleagues about the value of the effort.

MAILCHIMP DECORATES ITS WALLS WITH USER PERSONAS TO SHOWCASE THE VALUE OF RESEARCH (IMAGE SOURCE)
4. Prototype changes. This is 'iterative' redesign. Test potential site changes to see which features improve key outcomes. Just make sure you have enough traffic to get a valid sample size.
5. Build a proof of concept. A proof of concept connects your prototype to revenue. So, for example, if you want to redesign every product page, a test on a percentage of product pages can help estimate the potential revenue from a larger overhaul.
Once you’ve conducted your research, you can sift through all the data—quantitative and qualitative—to organize your findings. Those with the highest potential value should be tested or implemented first.
And just as you never stop testing, research doesn’t stop either. With every analytics check-up, session recording, or open-ended survey, you’ll learn something new.
If you use that information wisely, you’ll translate more knowledge into more revenue.
Learn why your visitors aren’t converting
Hotjar shows you what keeps your visitors from buying, so you can make website changes based on real insights, not assumptions, and watch your conversion rate grow.
Related articles

User research
5 tips to recruit user research participants that represent the real world
Whether you’re running focus groups for your pricing strategy or conducting usability testing for a new product, user interviews are one of the most effective research methods to get the needle-moving insights you need. But to discover meaningful data that helps you reach your goals, you need to connect with high-quality participants. This article shares five tips to help you optimize your recruiting efforts and find the right people for any type of research study.

Hotjar team

User research
How to instantly transcribe user interviews—and swiftly unlock actionable insights
After the thrill of a successful user interview, the chore of transcribing dialogue can feel like the ultimate anticlimax. Putting spoken words in writing takes several precious hours—time better invested in sharing your findings with your team or boss.
But the fact remains: you need a clear and accurate user interview transcript to analyze and report data effectively. Enter automatic transcription. This process instantly transcribes recorded dialogue in real time without human help. It ensures data integrity (and preserves your sanity), enabling you to unlock valuable insights in your research.

Shadz Loresco

User research
An 8-step guide to conducting empathetic (and insightful) customer interviews in mid-market companies
Customer interviews uncover your ideal users’ challenges and needs in their own words, providing in-depth customer experience insights that inform product development, new features, and decision-making. But to get the most out of your interviews, you need to approach them with empathy. This article explains how to conduct accessible, inclusive, and—above all—insightful interviews to create a smooth (and enjoyable!) process for you and your participants.
Hotjar team