Learn / Guides / Heatmaps guide
Click maps: how to use them to optimize your website (and why you should)
People can't use a website without clicking a mouse somewhere or tapping on a mobile device. Those clicks and taps help them navigate pages and find the products, services, or information they’re looking for.
But do YOU, as a website designer, marketer, or business owner, know exactly where your visitors click and tap? And do you know how to use that information to build a better website and experience?
That's where click maps come in.
In this quick article, you'll learn how to track where users click, the benefits and limitations of click maps, how you can use them to optimize UX, and how to set up click maps on your website or product page in just a couple of minutes.

What is a click map?
A click map (or clickmap) is a type of website heatmap that displays where users click the mouse cursor on a desktop device or tap the screen on mobile. Click maps help website owners track on-page user engagement, such as clicks on buttons, links, and images across a website, which in turn helps them optimize their pages and CTAs for better conversions.
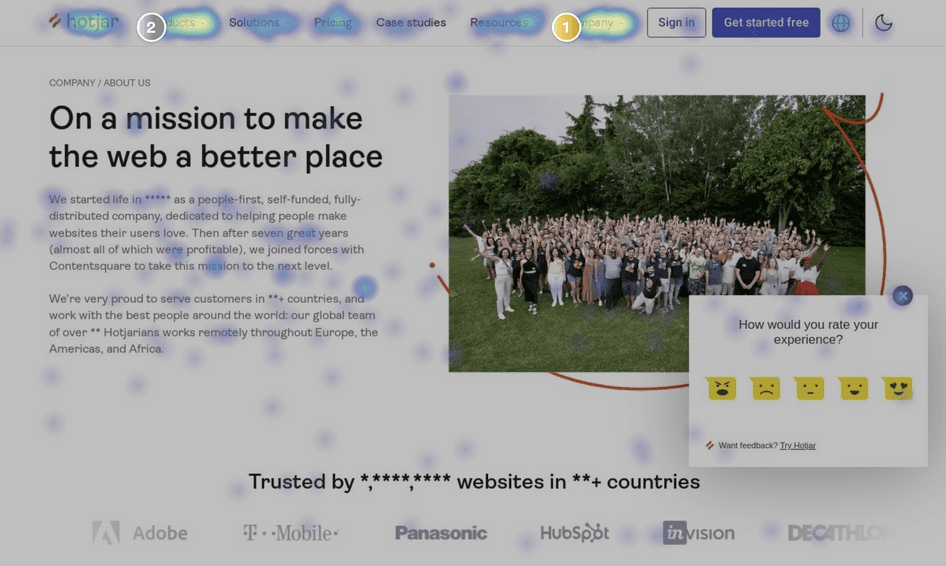
User experience designers and marketers use click maps to track user activity, identify opportunities to increase conversions, fix bugs, and improve website design through iterative testing. Click popularity is displayed using a color scale from red to blue (where the most popular points are ‘hot’ and represented in red), alongside quantitative data on the number of clicks and user click percentage on each webpage element.
Click maps vs. heatmaps
'Heatmaps' (or 'heat maps') is an umbrella term that describes different types of visual website analytics. Click maps are a specific type of heatmap (together with scroll maps and move maps) where the red or ‘hot’ dots show page elements that have been clicked on most frequently, while blue or ‘cold’ dots show the ones that have been clicked on the least. Any area that contains no color has never been clicked on.
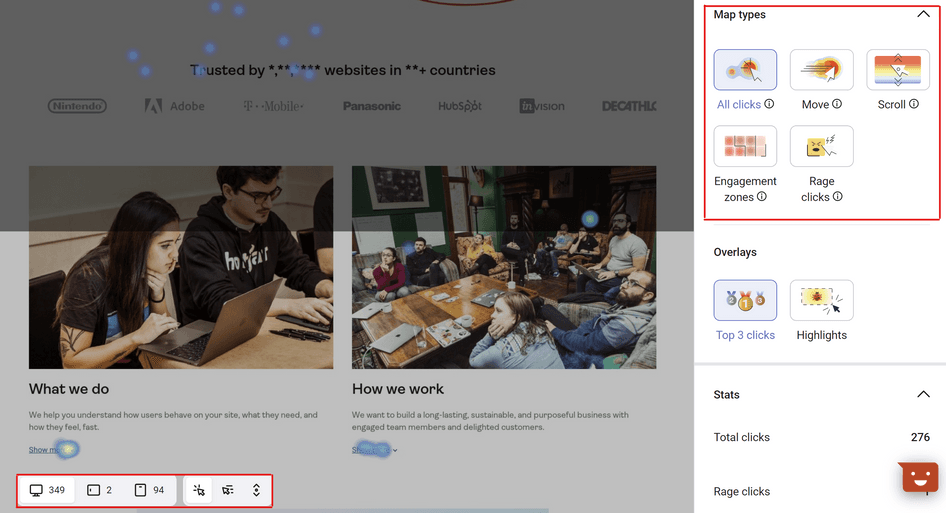
💡Did you know? You can visualize click, move, and scroll data in a single view using Hotjar Heatmaps.
The Engagement Zones heatmap grid view lets you know which areas of the page your users most interact with, at one glance.
Click maps vs. rage click maps
Rage click maps are a specific type of click map that show you exactly where rage clicks occur on a page, indicating usability issues (error clicks), bugs, or broken elements (dead clicks). They’re a particularly useful tool for identifying points of unnecessary friction and opportunities to improve UX to increase conversions.
Why use website click maps?
With click heat maps, you can:
See where website visitors click and tap
Identify underperforming CTAs that are getting ignored
Find potential bugs and product pain points
Visually showcase engagement data
Spot which on-page elements get the most clicks on variants when doing A/B testing
Click maps are a key click-tracking tool to help you spot elements where users engage (or don’t) with your pages to quantify user behavior patterns.
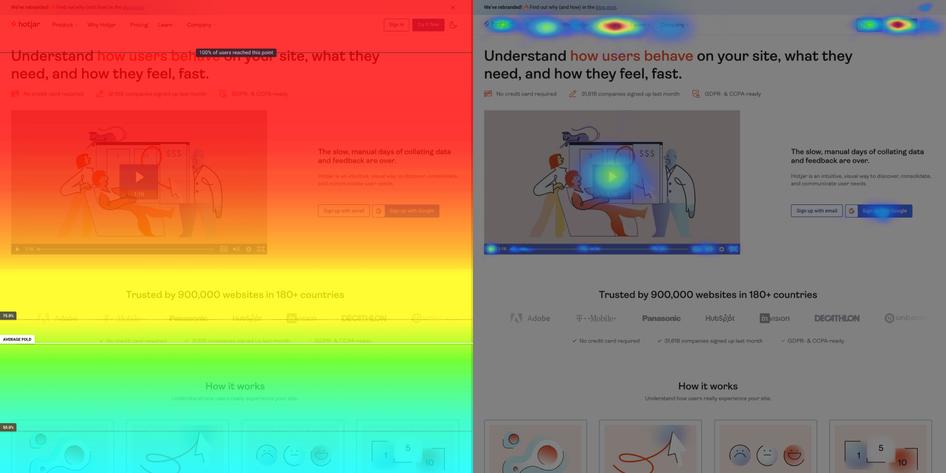
You'll see where visitors clicked on CTAs (calls-to-action) and unexpected elements, which in turn gives you a solid starting point to make product changes for UX improvement and CRO (conversion rate optimization). Look at this quick example:
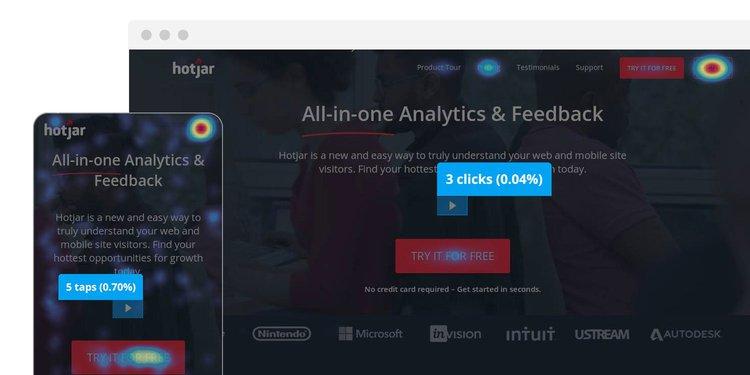
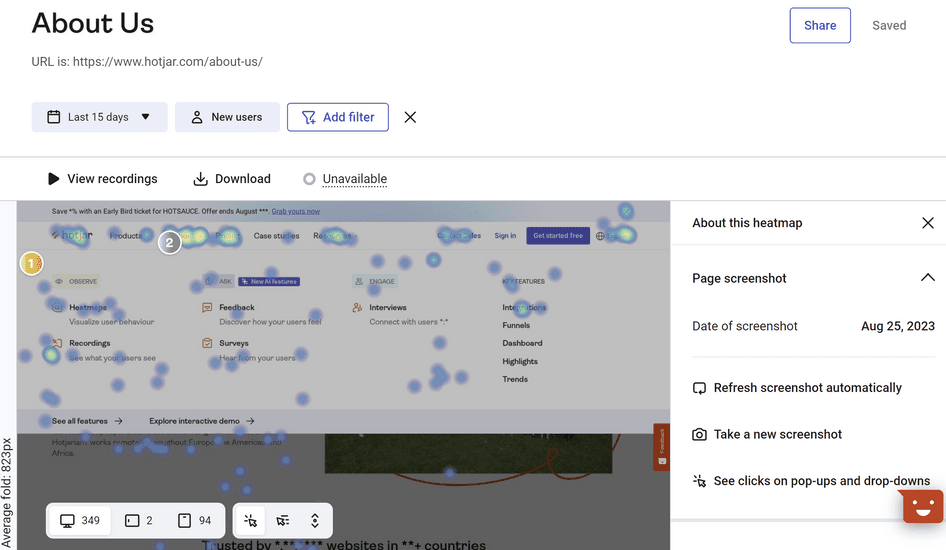
This click map was placed on an old version of our homepage, which included a video above the average fold. In reality, as both the mobile and the desktop click maps show, nobody really did watch the video: the overall engagement is 0.04%—meaning that out of 7000 people, around three (!) clicked the play button.
Had the video included unique, valuable information about the product that was not replicated anywhere else on the page, we’d have been in trouble—this click map alerted us to a problem that needed fixing.
In addition, click maps can be used as a visual aid to help communicate website and product problems and optimizations to stakeholders and clients, which is particularly helpful if you're pitching to a non-technical audience and need to get UX buy-in from your team or manager.
Finally, click maps are powerful performance reporting tools, as they provide the visual data that brings a concrete representation to your narrative. A picture is worth a thousand words, after all 😉

How to use click maps on your website
You can use click maps on any type of website—your ecommerce site, product listings, blog, landing pages, and more.
Here's how to set up Hotjar click heatmaps using our heatmap analytics tool and start collecting click data on your website today. Each Hotjar heatmap will automatically generate all heatmap types (click, move, and scroll), so there’s no need to do anything special to set up a click map.
Log into the main Hotjar dashboard (sign up first for a forever-free account if you’re new to it), and navigate to the Heatmaps section to begin.
Here are six simple steps to create a click heatmap:
Step 1: add Hotjar’s tracking code to your website
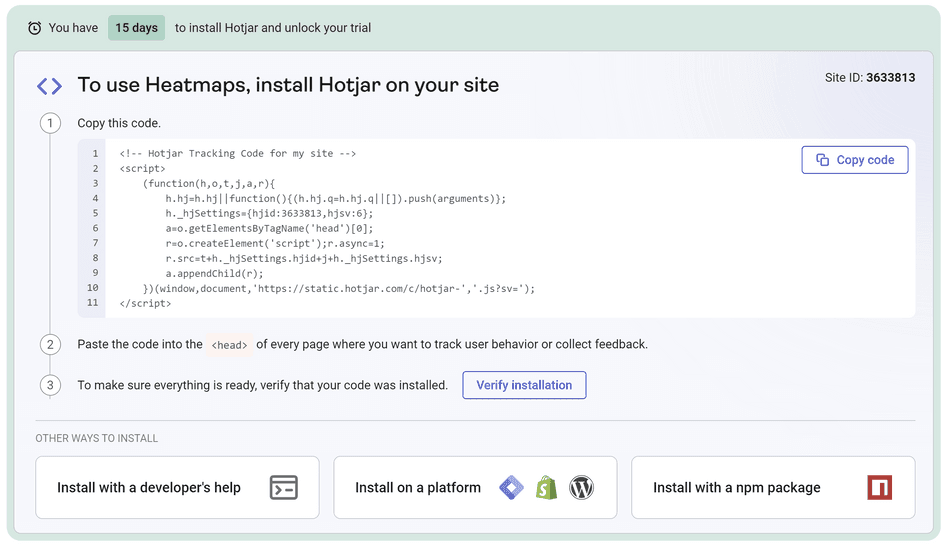
You can install Hotjar’s tracking code in several ways, including via Google Tag Manager and WordPress plugin.
In case you’re wondering, Hotjar was built with privacy in mind from the get-go: all our tools are privacy-compliant. And the tracking code won’t affect your site’s speed.
Step 2: enable 'session capture'
Continuous heatmaps are generated from sessions. When 'session capture' is enabled, heatmaps are available automatically and they start collecting user behavior data. So, you first need to verify that 'session capture' is enabled.
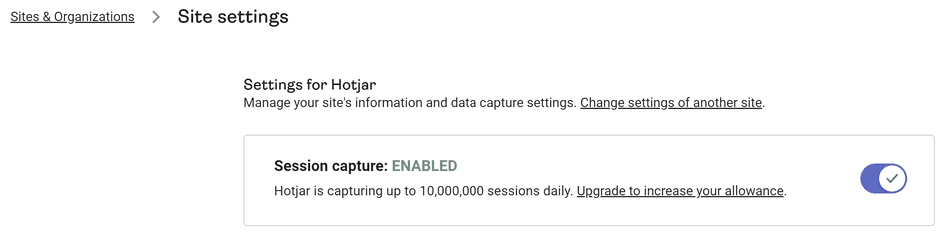
You can verify this by clicking on your picture in the top-right corner of your Hotjar Account, navigating to “Organization settings”, then clicking on the little gear icon, “site settings” on the right.

At the top of the page in your Hotjar account, you’ll also notice a widget that indicates how much of your site’s traffic is covered. If you click on this widget, you will see more information about your daily 'session capture' settings, which will apply to both Hotjar Recordings and Heatmaps.
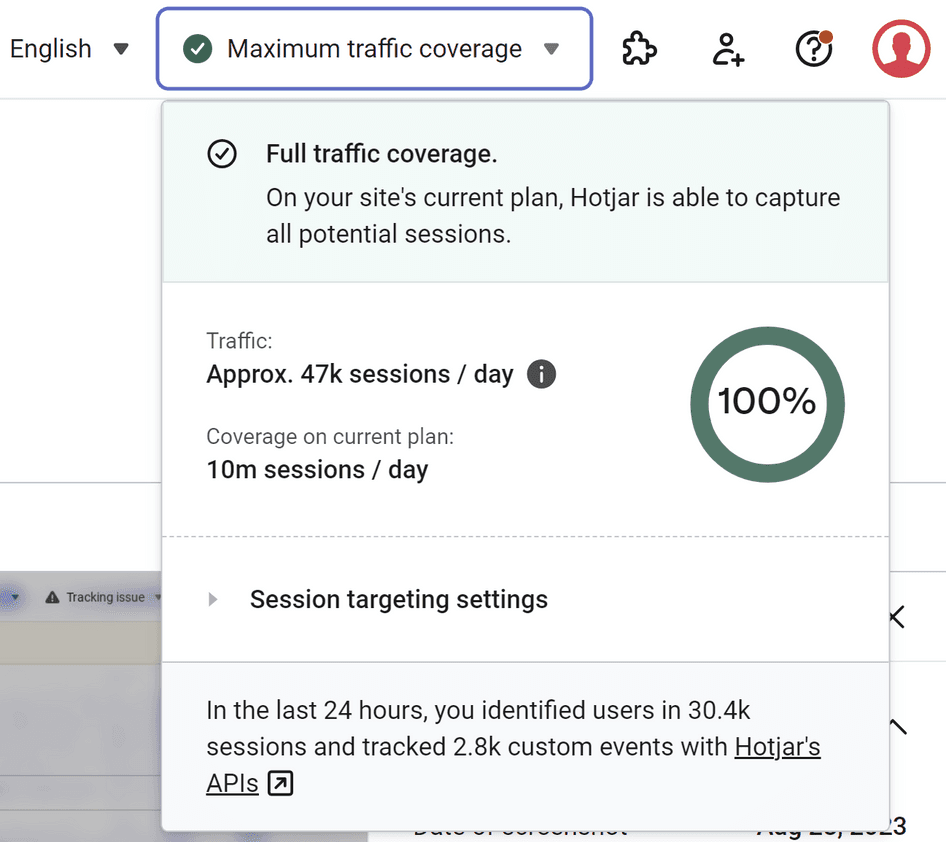
If session capture is not enabled, you will see an orange 'Session Capture Disabled' button at the top of the page, which takes you to the session capture configuration page.
Step 3: get started with continuous heatmaps
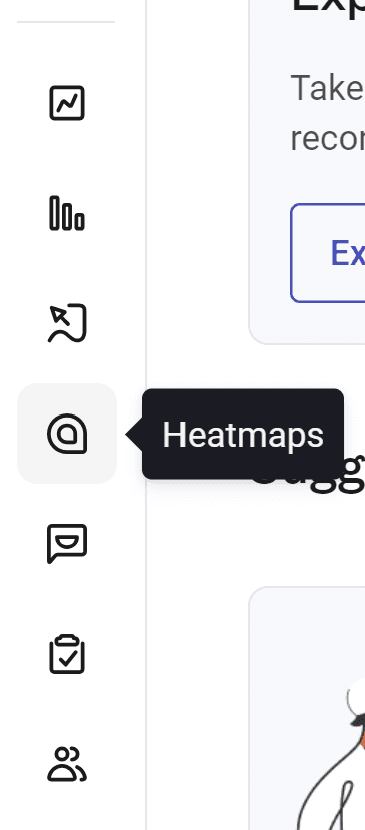
Click on Heatmaps in the left-hand navigation menu:
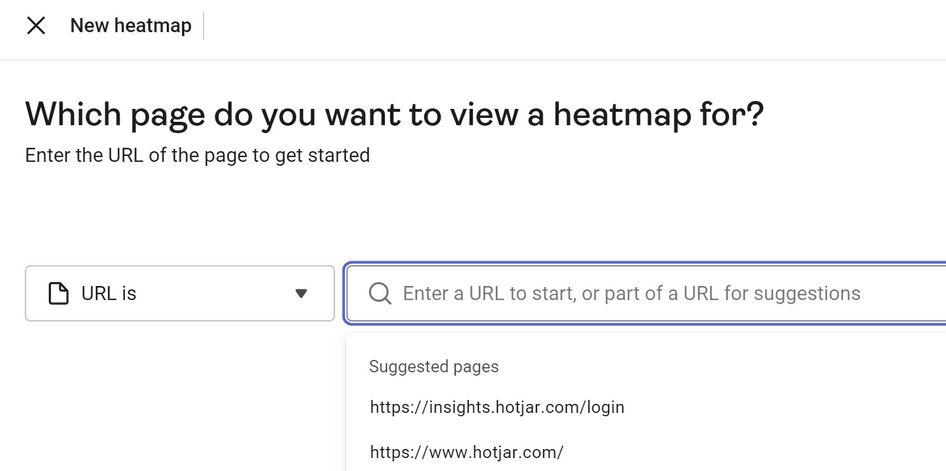
Step 4: enter the URL of your heatmap or select from the popular pages list
Using the search bar at the top of your Heatmaps page, you can view a heatmap for any page you've tracked by entering the URL here.
To learn more you can check out our article on URL filtering for continuous heatmaps.
You can also select a page from the ‘popular pages’ list. This list shows the pages across your site that have collected the highest amount of session data over the past 30 days.
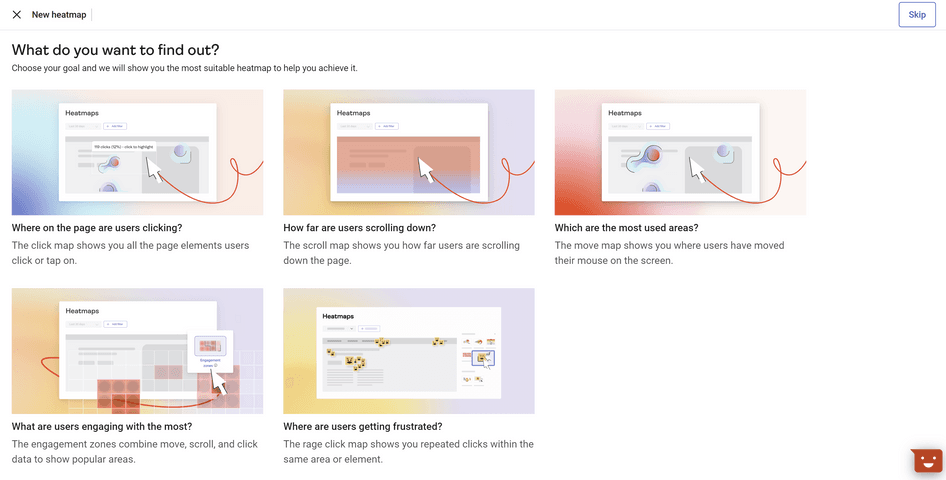
Step 5: select the click map
The next screen will ask you to choose what your objective is. To generate a click map, select the first option: “Where on the page are users clicking?”
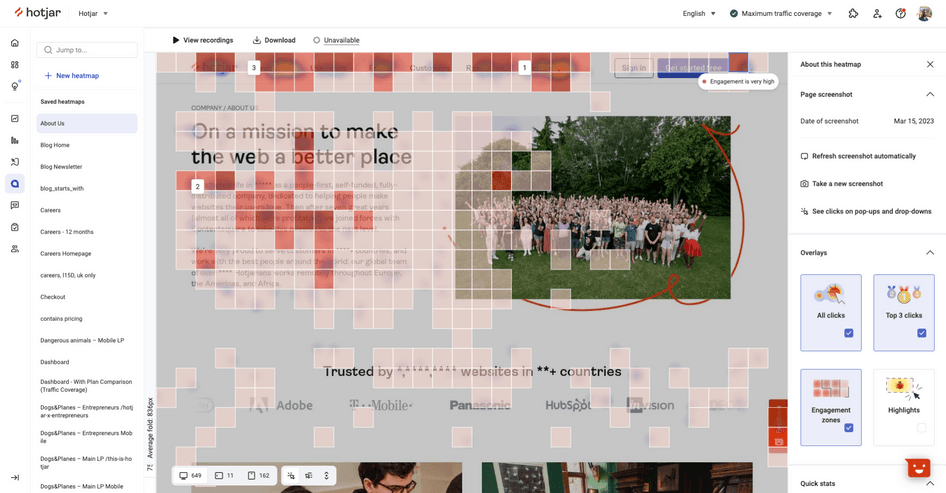
Step 6: learn where users are clicking on your page
Your heatmap should appear within 90 seconds or less. Here’s how the click heatmap results will look from inside the Hotjar dashboard:
You can toggle any heatmap to show desktop, tablet, or mobile sessions. To view the click map data, select the ‘Click’ tab in the map type panel on the right, or the floating widget at the bottom. You can also view and download the raw data.
Note: to ensure that Hotjar accurately reports where your website visitors have clicked, we collect clicks relative to elements on the page. For instance, if a user clicks on a button, we will record the position of their cursor relative to that particular button, not the entire page—in other words, Hotjar Heatmaps provide you with an aggregated visualization of user behavior.
Find out ‘why people click’ by combining heat maps with other product experience tools
Click maps are great at showing you what users click and tap on, but that's only part of the story—you still need to understand why users click (or, perhaps more urgently: why they fail to).
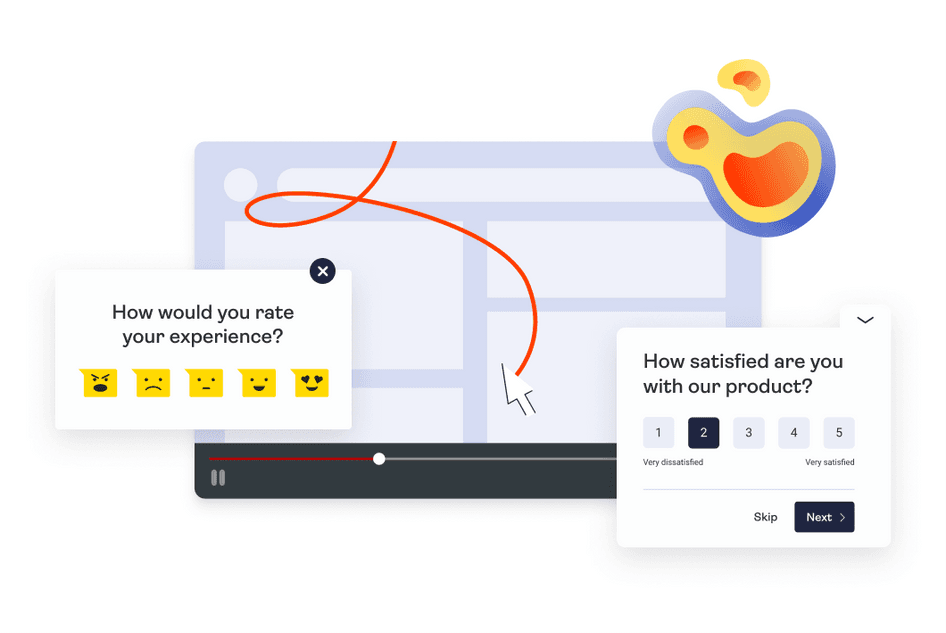
To do that, you can combine quantitative click map insights with qualitative insight from user feedback, surveys, and session recordings. Using Hotjar, you can quickly set up session replays, feedback widgets, and surveys alongside heatmaps on your website or product page to get all the product experience (PX) insights you need to make optimizations and improve UX.
📚 Further reading: check out how to combine heatmaps and other tools for extra insight, and learn how SaaS company CCV Shop used click maps in combination with session recordings to increase conversion rates and customer satisfaction.
Create a free click map and increase conversions today
Click maps are a quick and easy way to see what people are really doing on your site. They are a key product experience insights tool in the UX and optimization tech stack of marketers, UX designers, and conversion rate optimizers—and they are especially useful if you have an online business, looking to deeply understand the behavior of your customers: what drives them, what interests them, what they interact with, or what they fail to notice on your site.