Learn / Guides / Customer activation guide
7 customer activation metrics to boost your product's stickiness
Active customers are key to the success of any online business. But if you’re not tracking your buyers’ ‘aha!’ moments, when they understand the value of your product, how can you really know your marketing and customer success efforts are working? Enter: customer activation metrics.

Tracking key metrics and making improvements that enhance the customer journey allow you to create more value for your users and see curious visitors turn into loyal subscribers.
This article walks you through the main customer activation KPIs you should monitor—and shows you how. By understanding the right metrics to track, you can start guiding your customers to discover the value of your product or service.
Use Hotjar to go deeper on your customer activation metrics
Hotjar’s tools let you discover which website and product improvements your users value most.

7 key customer activation metrics to track
Tracking customer activation metrics is essential to understand whether your customers are actually perceiving and receiving the value of your product or service, and moving along their journey with your brand. Activated users bring major benefits, from customer satisfaction to increased revenue.
Focus on tracking the metrics that are most relevant to your business and team. These will depend on your unique organizational key performance indicators (KPIs), as well as the specifics of your product or service and the value it provides your customers.
Also, tailor your metrics to the specific customer journey you offer. For example, a SaaS company may need to not only track customer activation for decision-makers who aren’t end users of the product, but also measure how active end users are once the purchase has been made. An ecommerce company might be more interested in understanding whether first-time buyers are being successfully activated as repeat customers.
Let’s take a look at the seven core KPIs you should monitor to measure customer activation. We’ll also show you how to go beyond metrics alone for deeper customer activation insights.
1. Customer activation rate
Customer activation rate is an umbrella metric that measures the rate at which your customers ‘activate’, or reach the point where they understand your product’s value and are ready to take action.
To measure activation rate, you first need to identify what activation means for your product and users. This could involve becoming a subscriber, adopting a feature, or anything else that shows your customer is getting value from your product. Once you determine your activation event, you can calculate your customer activation rate using the following formula:
(no. of users who reached activation milestone ÷ no. of users who signed up) x 100
Increasing customer activation rates should be your end goal, but it’s not always easy to know how to get there. The rest of the customer activation KPIs on this list help you get more precise when tracking your metrics—so you can pinpoint exactly what you need to do to help customers activate more quickly and frequently.
Pro tip: check your metrics regularly, but not so regularly that you don’t leave time to notice changes.
Anthony Martin, CEO of Choice Mutual, explains why monthly tracking is optimal:
"We check in with these metrics on a monthly basis: this ensures the marketing and customer service policies we implement are staying on track, but also allows enough time to give new ideas and strategies a chance to develop."
2. Visitor-to-signup rate
At its core, visitor-to-signup rate is a conversion metric that shows you whether you’re successfully turning users into potential customers.
When a user signs up for a free trial or joins an email list to receive information, this doesn’t mean they’re already getting value from your product—but it’s a good indicator that they want to learn more about how your product can help them with their jobs to be done (JTBD), and move them along the customer journey.
With a SaaS product, for example, a user signing up for a free trial is the perfect opportunity to guide them to fully activating and discovering value by providing them with a simple yet comprehensive onboarding that gets them using key features. Ecommerce sites use this metric to test whether users are compelled to sign up for a discount or newsletter, bringing them one step closer to full activation.
Calculate visitor-to-signup rate with the following formula:
(no. of signups ÷ no. of users who visited your page) x 100
🔥 Pro tip: visitor-to-signup rate is a good way to understand how many users are converting—but it won’t tell you why. Use Hotjar's product experience (PX) insight tools to understand the reasons behind your customers’ decisions so you can lead them to value quicker.
CTA performance is a good example of a website element you can optimize to increase visitor-to-signup rates and lead your customers to value. Hotjar's Heatmaps and Recordings give you key insights on how users interact with CTAs and sign-up forms, so you know which improvements to prioritize.
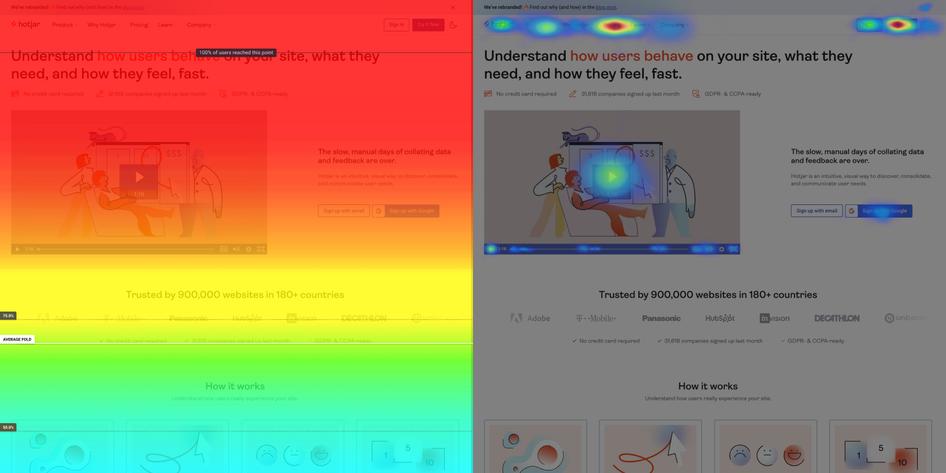
Use Hotjar Heatmaps to find out which CTAs your users are drawn to and which they ignore.
3. Sign-up-to-subscriber rate
When your customers move from signing up to subscribing, it’s a clear indication that they’re finding value in your product or service. For example, if signing up means gaining access to a free trial, it’s likely that a user who subscribes to the paid service got some value during that trial period.
Calculate your sign-up-to-subscriber rate with the following formula:
(no. of subscribers ÷ no. of signups) x 100
If your sign-up-to-subscriber rate is weak, analyze your users’ first interactions with your product to see how you can add value. Could you include more premium features in your free trial? Should you put them in touch with your customer success team as soon as they sign up? Would they benefit from in-product reminders and tooltips to get them using different features as soon as possible?
Monitoring this metric is just the start of measuring customer activation. You need to also monitor how long your users stick with your product, how frequently they adopt features, and how long it takes them to activate.
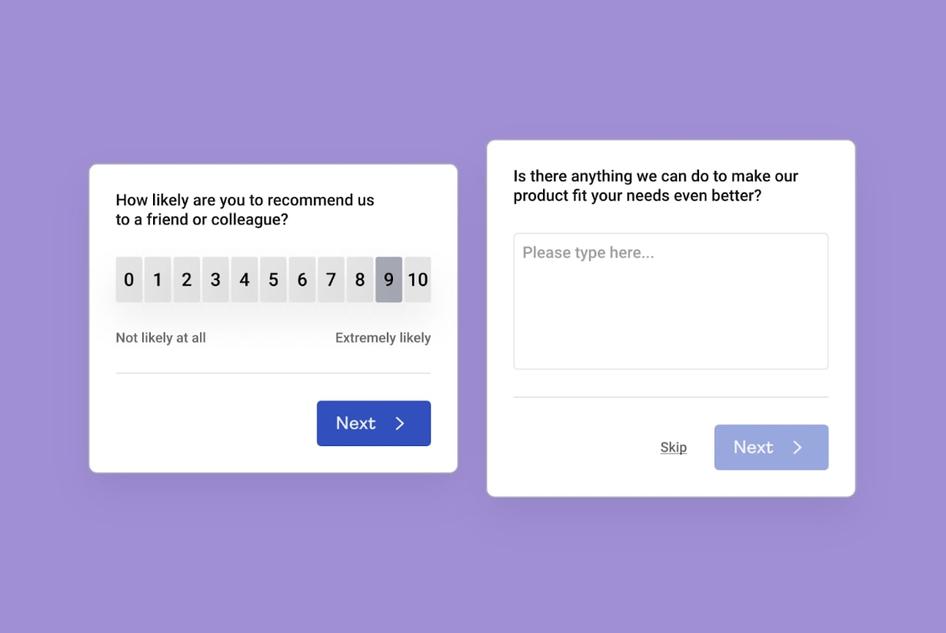
Use Hotjar Surveys to directly ask your users what they liked and didn’t like about your free trial. An NPS survey is a great way to gauge your users’ satisfaction and understand more about the positives and negatives of their first experience with your product.
4. Ratio of DAU to MAU
Daily active users (DAU) and monthly active users (MAU) are both important metrics that tell you a lot about the success of the SaaS customer journey. However, the ratio of DAU to MAU matters even more.
This metric is also known as ‘stickiness’; it implies that customers are getting value from your product and therefore sticking around. To calculate the stickiness of your product or service, simply divide your number of DAU by your number of MAU.
The higher the percentage, the better the DAU to MAU ratio: a good benchmark to aim for is around 25%. If your stickiness ratio lingers below that figure, there are many customer activation techniques and strategies you can implement to improve it:
Email campaigns and push notifications are a good starting point to increase product stickiness. It’s also important to improve the customer experience (CX) to prioritize retention, which is why you need a strong customer success team to provide your users with the ongoing support they need.
5. Churn and retention rate
Churn rate and retention rate are two significant retention metrics you need to gauge customer activation. To calculate both of these, set a time period to measure them against, either quarterly or yearly.
You can calculate your annual churn rate with this formula:
(no. of lost customers at end of year ÷ no. of total customers at start of year) x 100
And to calculate your annual retention rate, use the following formula:
(# remaining customers at end of year ÷ # total customers at start of year) x 100
These are key customer activation KPIs because they provide you with a bigger picture of why your users drop off or stick around. A healthy churn rate for SaaS companies, for example, is below 5%. If your churn figures peak beyond that, you need to ask yourself how you can provide more value to your customers to keep them coming back.
Pro tip: create a churn survey with Hotjar to ask your customers exactly why they leave. That way, you can make user experience (UX) design changes, add new features, or provide customers with the support they need to find value in your product or service.
6. Feature adoption rate
Feature adoption rate is one of the key customer activation metrics to keep an eye on. When you roll out a new feature, the goal is to provide value to your customers. But if your users aren’t interacting with the features you introduce, they’ll miss out on that value. Even if you mainly deal with corporate customers, who aren’t the end users of the product, they’ll make purchasing, renewal, and upgrade decisions based on how much value their team gets from your product or service.
Calculate your feature adoption rate by using the following formula (for your total customers, you can use your MAU):
(no. of customers who adopt feature ÷ no. of total customers) x 100
Looking at the feature adoption rate for your product gives you a holistic view of your user's experience, showing you which elements provide the most value to your customers and which are ignored.
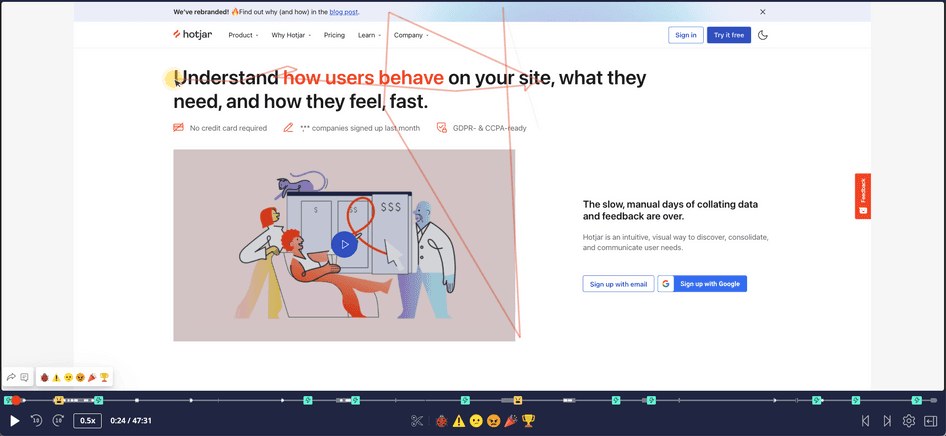
Once you pinpoint your lowest performing features, use Hotjar Recordings to determine why your users aren’t getting value from them. For example, Session Recordings reveal if there’s a bug with an upgrade that’s preventing customers from using it so you can eliminate issues and get them to adopt your shiny new feature.
7. Time to activate
Finding out how many of your customers are activating matters, but you also need to determine how long it’s taking them to reach that ‘Aha!’ moment.
Average how long it takes a customer to activate after they first come into contact with your brand or sign up for a free trial, to start work on streamlining your customer's lifecycle and product experience.
Customer journey mapping helps you understand why it takes your customers longer than you expected to activate. Maybe there’s a gap between customers being solution-aware and product-aware—so you need to give customers a push toward understanding how your product can solve their problems.
You want this time period to be as short as possible. A couple of ways to achieve this are by ensuring your CTAs speak to your various user personas and by designing a frictionless customer onboarding process.
Combine customer activation metrics with user insights
When you pay attention to the right metrics, it’s easy to see why and where customers fail to activate. But this is just the first step to getting your customers fully activated—be sure to plan out how to improve these metrics by optimizing your overall customer experience.
"Analyzing customer activation metrics is only useful if you know what to do with the information. If you don't have a plan for how to improve your customer activation, then you're not going to get anywhere," says Linda Shaffer, the chief people operations officer at Checkr.
If you want to see more subscribers, quicker feature adoption, and increased daily active users, focus on tracking customer activation metrics. But don’t stop there: the best teams use metrics as a starting point for deeper customer discovery, by using tools that help you understand your customer’s behavior and motivations. Combine metrics with granular user insights to create greater value for your customers and watch your churn rates plummet.
Use Hotjar to go deeper on your customer activation metrics
Hotjar’s tools let you discover which website and product improvements your users value the most.