Learn / Guides / Heatmaps guide
How to use mouse tracking move maps to improve UX and conversions
Tracking where users move and rest their mouse cursors captures an image of what attracts users’ attention (or doesn’t) on any website page or product interface. This visual representation is called a move map.
Move maps help you understand user behavior so you can deliver the experience people want when they visit your website or use your product.
Summary
This guide takes you through what move maps are, why they’re useful, and how to analyze mouse movement data to make customer-centric optimizations that improve your user experience (UX) and conversions. We cover
What is a move map?
A move map—also known as a mouse movement heatmap, mouse tracking heatmap, or attention map—tracks the overall movement and placement of a user's computer mouse cursor.
Mouse movement heatmaps use color to show how much attention users pay to different page elements: the longer a mouse cursor remains at a certain point, the redder it becomes.
📝 Note: some move maps (including Hotjar) also collect finger activity on mobile devices, but this is generally less useful as most mobile users only touch the screen to click or scroll.
Why use a move map to track mouse movement
Move maps show you which parts of a page attract the most attention. Since they overlay mouse behavior for multiple users at once, move maps are quantitative representations of page elements that are actively read or seen.
Research shows a correlation between mouse and eye movement. This means move maps are also a decent proxy for understanding where people look when browsing your site or using your product.
Compared to eye tracking in a lab, mouse movement heatmaps:
Are cheaper and easier to generate
Capture more users at scale
Measure real-world behavior
Set up a move map for free and start learning what’s happening on your website or product in an easy, visual way.
4 ways to use move maps to improve website UX and conversions
Use the examples below to get ideas on how to make the most of mouse-tracking software in your next UX design, usability testing, or conversion rate optimization project:
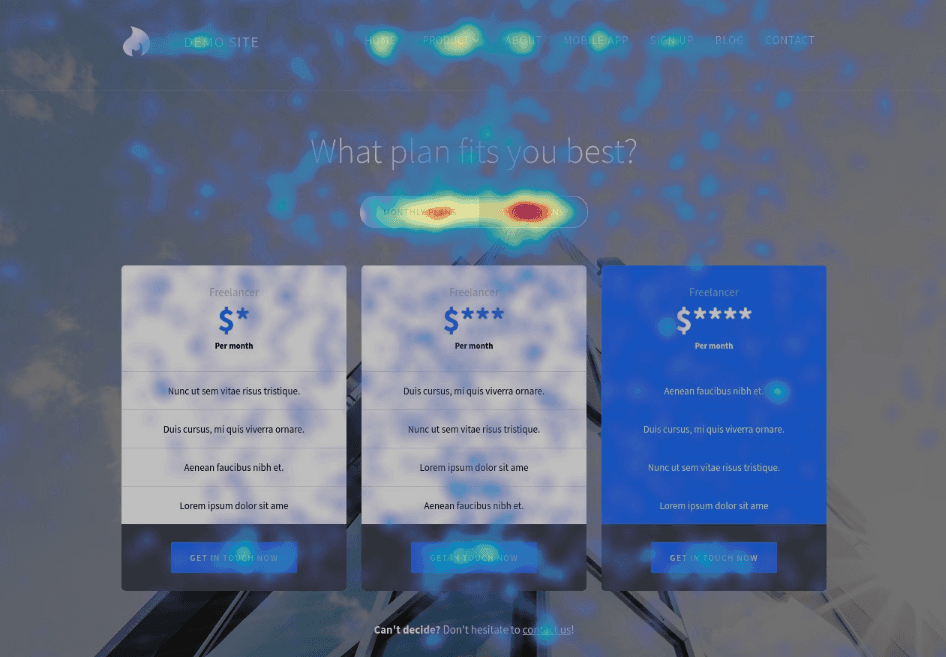
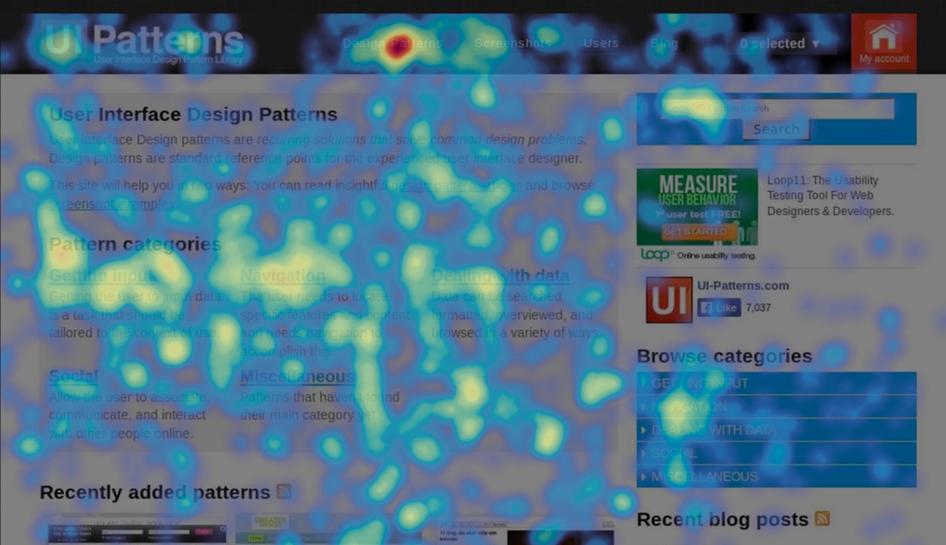
1. Find where you’re capturing user attention
Move maps show you which elements catch your customer’s eye (and cursor) on any page—just look for the red pixels or hotspots.
Once you know what’s getting seen by page visitors, you can make optimization recommendations and get ideas for what to investigate next.

For example, the University of Baltimore used Hotjar Heatmaps to add a move map to their library homepage. The heatmap showed most homepage visitors focusing their cursor movements on the tabbed search box, with almost no interaction with other page elements, like the ‘Ask a Librarian’ button.
If this was your site or product, you could:
Get more data with session recordings to see exactly how individual visitors use the search box
See where users rage click and get confused
Consider A/B testing new layouts (like three separate search boxes instead of a tabbed one), then put move maps on your A/B test variants to understand why successful variants win
Consider adding an on-site survey to ask your users if anything is missing on the page
2. Confirm whether unclickable elements are being seen
Most text and images don’t require visitors to click, so move maps are the only way you can know at scale if they’re being read and seen.
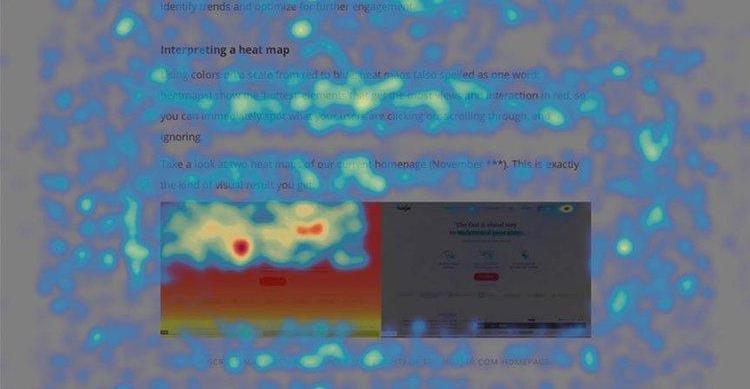
For example, we generated the above move map on an earlier version of our heatmap guide. It showed many visitors hovering their cursor over an image that compared scroll maps to click maps. This insight compelled us to keep the image when we updated the page.
3. See which elements get ignored
Since move maps measure continuous mouse placement, which can correlate with eye movement, they are better than other analytics tools at showing which elements users ignore.
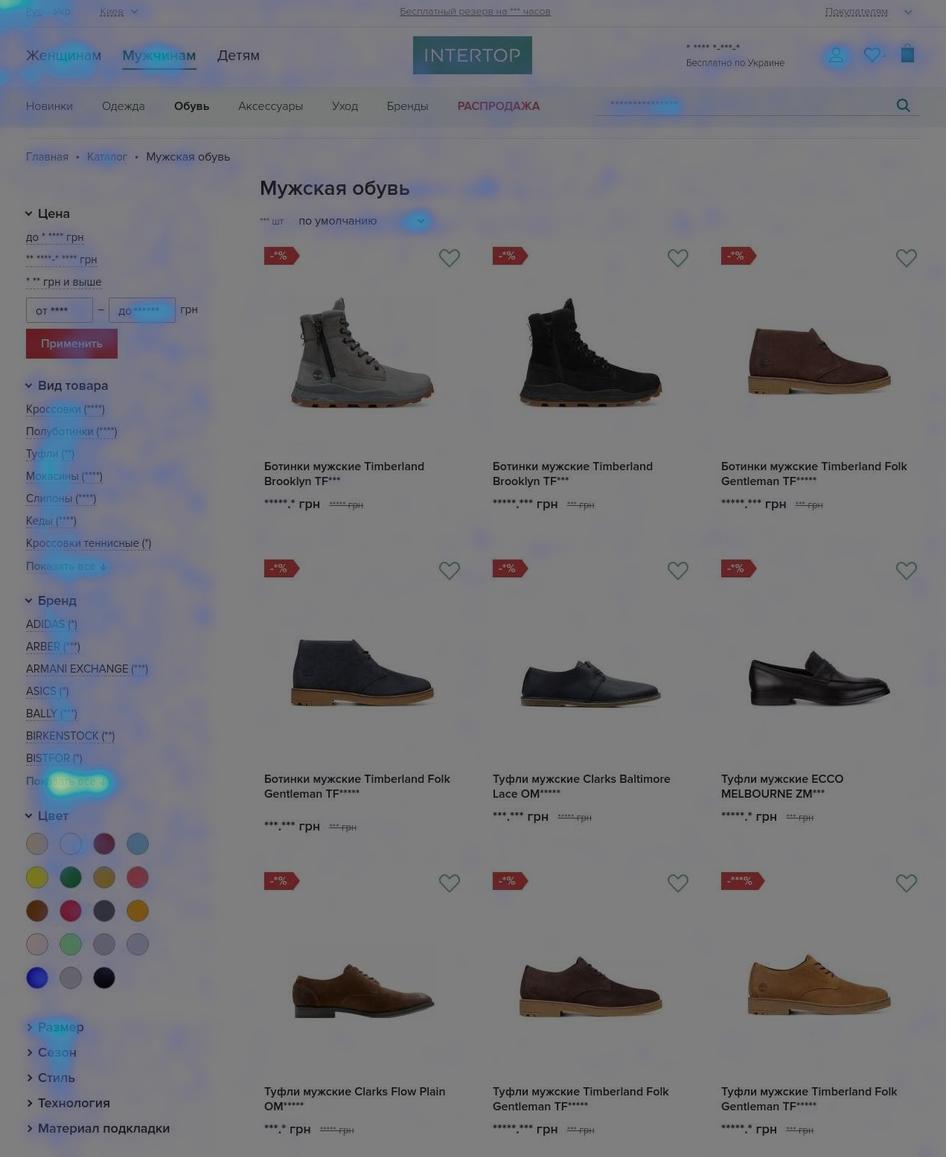
For example, UX/UI agency Turum-Burum used Hotjar to create a move map on the fashion store Intertop’s product category pages. Mouse-tracking data showed that search filters got more attention than product listings, which suggested users were unable to find the results they needed.
The team made some changes and added more product filters, which contributed to an increase in product clicks and an extra 13.3% average revenue per user (ARPU).
You can speculate about why something is working. But when you have Hotjar, and you see where they [users] move their mouse and what they click—it's a huge difference to make changes based on that.
4. Segment your move maps to generate targeted insights
Different user segments behave differently on your website or product, and some are more important to your business than others. Segmenting your mouse-tracking move maps helps you focus on your most valuable cohorts.
If you’re using Hotjar, you can filter heatmaps retroactively: click ‘Add filter’ to view the options.
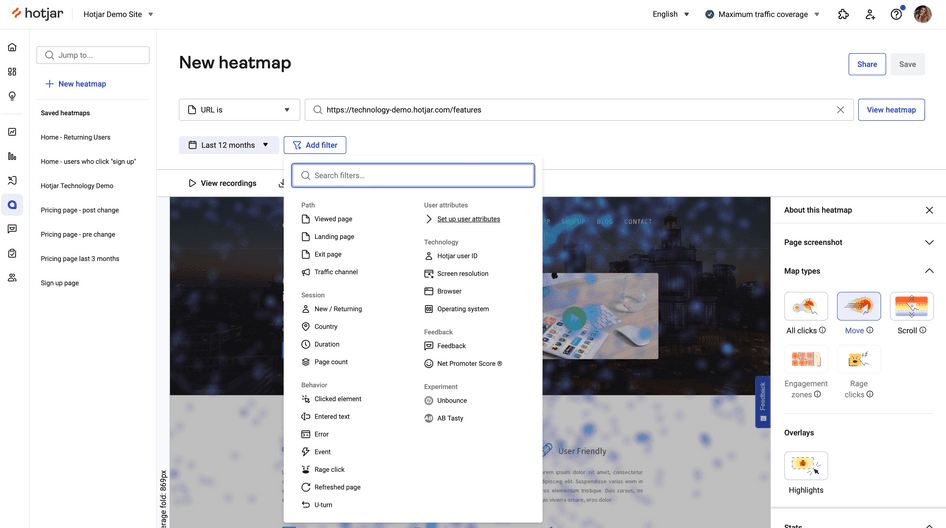
Other ways you could use this feature include
Filtering by exit page to view what users paid attention to before bouncing
Filtering by event, like clicking a ‘Sign up’ button, to see what users paid attention to before converting
Filtering by referrer or identifier (like UTM parameters) to isolate and investigate paid traffic behavior
Which pages should you use mouse tracking on?
You can track user mouse movements on any website or product page that gets traffic, but move maps are most useful on business-critical pages, and anywhere you want to check interaction with non-clickable elements. 🐭
For example
Ecommerce product pages: use mouse tracking tools to see if shoppers spend time reading product descriptions and looking at product images
Blog posts: use move maps to see which paragraphs and images attract readers’ attention the most
Pages with high drop-off rates: use funnel analysis and tools like Google Analytics to identify conversion leaks, and then move maps to see which areas get user attention
Business-critical CTAs: if calls-to-action (CTAs) aren’t getting clicked, use a move map to troubleshoot the issue
Move maps vs. click maps vs. scroll maps
Move maps aren’t the only type of heatmap you can use: click maps track where users click or tap, and scroll maps track how far users scroll down a page. Unlike these alternatives, move maps measure user behavior continuously, even in between page actions, revealing insights other heatmaps might miss.
For example, a scroll map could show a high percentage of users scrolling to the bottom of a page—but a move map would reveal they completely ignore the sidebar. Similarly, a click map may show no clicks on a product description, but a move map would reveal that users who see it go on to convert.
Each type of heatmap helps you investigate a slightly different aspect of your website and product performance
No type of heatmap is better or worse—use them together to get clearer insights:
Move maps vs. session recordings
A session recording (aka session replay) recreates an individual user’s browsing session across multiple pages: you’ll see mouse movements, but only for a single user at a time.
Move maps, however, aggregate mouse movement for multiple users on a single page. You can use them to look for overall trends and get a broad idea of how different elements attract attention.
💡 Pro tip: combine qualitative and quantitative datasets to draw stronger conclusions. Use move maps to spot the main trend, like an element being ignored, then look at session replays for a qualitative understanding of what individual users do instead.
User mouse movements tracked using Hotjar Recordings
How to set up a move map on your website
To get started, sign up for a free Hotjar account and add our tracking code to your website. Turn session capture on, and Hotjar will automatically start creating move maps across your site.
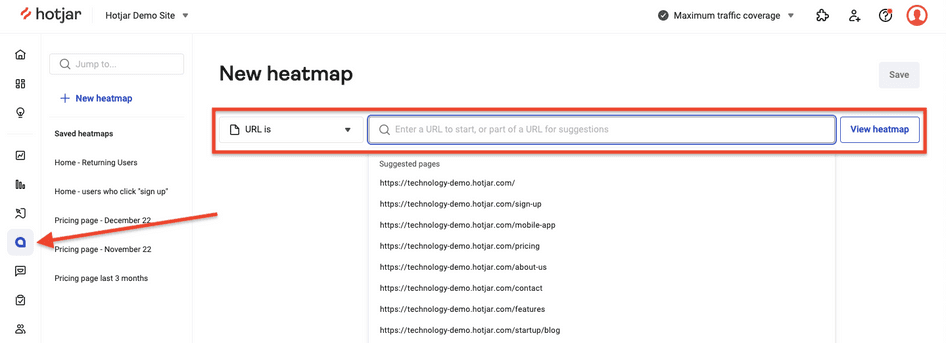
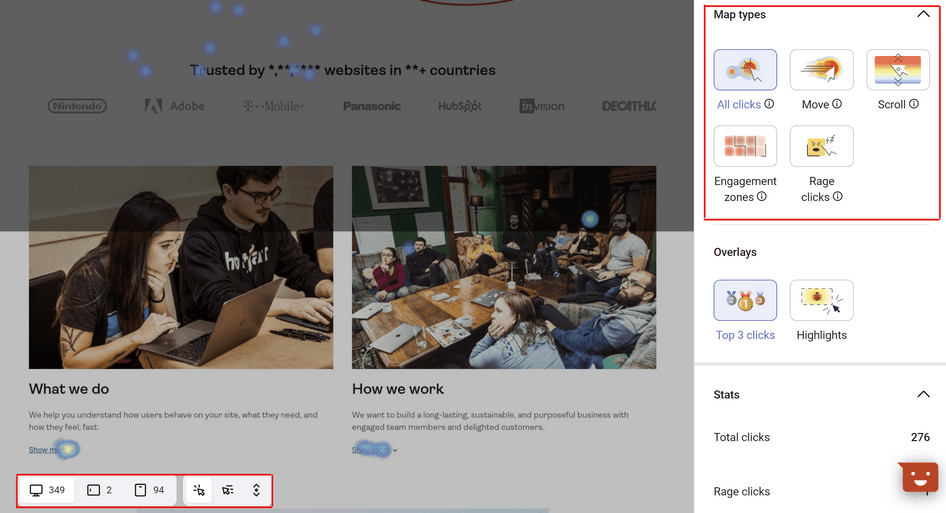
Once you’ve received some website traffic, click the heatmap icon on the left, enter a URL, and click ‘View heatmap.’ Select a timeframe, e.g. the last 30 days, and click the move map icon to generate your mouse tracking map. It’s that easy!
Heatmaps are continuously captured on all pages, so you can toggle between click, move, scroll, and rage click maps without having to change any settings. Engagement Zone maps are also just a click away.
Create a free move map and increase conversions today
Move maps give you a big-picture overview of what people pay attention to (and ignore) on your web and product pages.
On their own, they’re great visual assets to help explain user behavior to your team and stakeholders. But they become much more valuable when combined with other insights from your analytics stack:
Funnels to tell you where you’re leaking conversions
Session recordings to show you how people browse across your entire site
Surveys to get feedback in your customers’ own words
And guess what? You can do all of the above with Hotjar. 😉
Set up a move map today
Discover how users experience your most important web and product pages so you can improve UX and increase conversions.
