Learn / Guides / Performance reporting guide
How to create impactful sales performance reports and use them to shape strategy
Whether you’re a sales manager, rep, or leader—or work in any role that’s even remotely related to selling—a sales performance report is a must-have. It’s more than just numbers and graphs: an effective report helps you identify the strengths and weaknesses of your sales strategy, spot trends, and reach sales targets. But what does it take to build a great one? You’re about to find out.
Summary
A well-structured sales performance analysis report illuminates the path to optimizing your sales process, strategizing effectively, and driving business growth. Impactful reports start here. 👇
How to report on (and improve) sales performance: remember to weave quantitative and qualitative data into your performance analysis. Then, transform these numbers into tailored narratives to motivate your team and guide sales strategy, all while keeping stakeholders' communication preferences and objectives in mind.
The main types of sales performance reports: different reports cater to specific needs and metrics, but most are classified according to purpose (like sales forecasts, funnel, or opportunity score) or frequency
3 sales performance reporting mistakes: key mistakes hindering effective sales performance include jumping to conclusions and over-reliance on quantitative data. Not taking your sales team’s wellbeing into account can also impact your sales performance.
Hotjar’s simple and easy integrations let you spot issues and opportunities, so you can prioritize solutions that help you sell to more people.
How to report on (and improve) sales performance
Learn how to easily build actionable sales performance reports, so you can spend more time spotting patterns and less time tweaking tables.
Here’s a breakdown of how to build an engaging sales performance report:
1. Define your essential sales performance KPIs to measure progress
Sales reports are an analysis tool that use a mix of powerful key performance indicators (KPIs) to track the success of various sales activities within a given period. These metrics help you see your sales strategy as a bigger picture so you can pinpoint places of friction and see what's working in your process.
Sales reports can be set to various frequencies, helping you to monitor your success over time. The metrics you include and your reporting timeframe depends on your sales objectives and how frequently you need to update your team or management.
Report type
What it's for
Why it’s useful
Metrics to include
Daily sales report
Looks at the sales activities and operations of each business day
Keeps your reps accountable and increases productivity by including metrics that track the number of sales opportunities
Number of outbound calls, number of proposals sent , number of emails sent , duration of each outbound call
Weekly sales report
Assesses both the performance of individual reps, as well as the entire sales team’s
Allows sales leaders to know which reps are on track to hit their KPIs, if underperforming reps need coaching, and who would benefit from regular one-on-one meetings to level up and hit their quotas
Call or contact volume, number of appointments set , number of closed deals , sales volume by channel , lead-to-opportunity ratio , lead conversion ratio
Monthly sales report
Provides a longer-term overview of metrics, helping you determine the effectiveness of your sales strategy so you can tweak it if necessary
Helps you understand customers, identify problems before they get out of hand, and prioritize tasks to stay productive
Percentage of qualified leads , number of deals at each stage of the pipeline , monthly recurring revenue (MRR) , length of the sales cycle, average close rate , average deal size , sales volume
Annual sales report
A highly comprehensive and critical measure of your company's growth and success
Indicates seasonal fluctuations, observes the impact of marketing campaigns, addresses sales management issues, determines next year’s sales quotas, and identifies high-performing sales reps
Total revenue, market penetration, percentage of revenue from new business or existing customers, average customer lifetime value (CLV), Net Promoter Score® (NPS), annual contract value (ACV), year-over-year growth (YoY), annual recurring revenue (ARR)
💡 Pro tip: to write stellar sales reports, start high level, then go granular.
The best sales managers work collaboratively with their teams to find the key reasons for performance and explore focus areas for the future. Ben Hunt, Sales Team Lead at Hotjar, builds his sales performance reports in steps.
“Start with team performances, showing sales and comparing them to the target or budget for that period. Then break them down to sub-teams or individual sales reps to show the build of the team numbers.
For example, if a rep has shown to have very low ACV compared to the rest of the team, diving deeper would mean looking at metrics such as discounts, ACV of opportunity creation, size of companies in pipeline, cross-selling, and account potential versus sold.”
This approach helps executives understand where results are coming from (and how) and supports teams in understanding performance and what to focus on moving forward.
2. Diagnose the reasons behind the numbers
Once you’ve gathered the data you need to build a sales performance report, it's time to analyze it and pinpoint why your results look the way they do, for both strong and weak performances.
For example, a spike in the number of new opportunities might be due to a recent marketing campaign. Or, an unusual dip in the sales funnel reports might indicate issues in the sales process.
When you highlight why there’s an upward or downward trend in your data, you provide a roadmap for what your team can continue doing to achieve the best sales results—and where they can improve.
📝 Note: as you break down the positives and negatives, make sure to take into account external factors that are not directly related to specific metrics but had a hand in causing them (i.e. the market or larger macro-economic environment, headcount changes, improved training, or new initiatives).
Use strategic tools to discover the strong and weak aspects of your sales performance
Having dedicated technology to track lead and customer data makes it easier for sales leaders to analyze team performance and identify areas for improvement.
Whether you want a simple daily sales report or are looking for more complex figures, using these types of performance reporting tools can streamline the task and help you quickly extract valuable insights from data:
Salesforce Sales Cloud: Salesforce is a cloud-based CRM software company that equips you with the tools and technologies to enhance the efficiency and effectiveness of your sales team. Use it to track sales opportunities as you automate tedious tasks and workflows for data-driven insights on your sales pipeline.
HubSpot: if you’re on the HubSpot platform, Sales Hub, their sales tracking software, also offers a wide range of features that allow you to manage your entire sales reporting process in one place. HubSpot’s sales performance features include pipeline management, custom lead scoring data, and reporting and analytics, all available at an accessible price point (not to mention a free tier).
ClickFunnels: ClickFunnels is a sales funnel builder for non-programmers who want to build profitable sales funnels, no coding required. It enables you to collect leads, sell products, and create upsell offers using features like their drag-and-drop page builder. With pre-built funnel templates and opt-in forms included, you can quickly build funnels as simple or complex as you’d like.
💡 Pro tip: manage your sales process and keep even better track of your leads with Hotjar integrations.
Whatever your sales tech stack looks like, Hotjar can slot right in. Hotjar integrates with Salesforce, HubSpot, and ClickFunnels (and many more) to supplement your sales performance data with qualitative insights. This builds a complete picture of user behavior and enables your sales team to make the most of data.
Combine Hotjar insights with Sales Cloud data for a more accurate record of leads, activity, and customers. Use our Zapier integration to update records in Salesforce when a new recording is collected or when feedback responses are created.
Personalize interactions with prospects and customers using Hotjar and HubSpot together. Save the contact on HubSpot and then add important information from Surveys and Recordings to your prospect’s timeline.
Integrate Hotjar and ClickFunnels to build frictionless sales funnels that convert. Develop heatmaps, gather voice-of-the-customer (VoC) data, and watch recordings for the pages in your sales funnels to understand where customers get stuck and what moves them forward.
With Hotjar, we can stop guessing and actually see how the customer interacts with our website. We can find solutions, fix problems, and get more leads for our sales team.
3. Establish your goals and improvement areas for the upcoming period
A sales performance report shouldn’t just be a post-mortem; it should guide future actions, breathing life into your sales strategy. Use your analysis to develop an action plan to improve sales performance:
Identify patterns in your data: once you’ve carefully examined the data from your sales reports, find trends and patterns to understand why something is happening. Don’t just react when the numbers are negative. The true value of reporting lies in providing a deeper look into instances of success. By understanding why something went right, you will not only fine-tune your sales strategies but also find new opportunities that lead to business growth.
Provide solutions to the problems: you can meaningfully present even the most concerning data if you determine an actionable, fixable root cause. Devise a strategy that offers solutions to the problems you’ve identified. For example, if sales call reports indicate that leads aren’t reaching the final stages of the sales funnel, suggest solutions to improve lead nurturing. Make sure your strategies are measurable and time-bound so you can track their progress.
Highlight priorities instead of listing ideas: a great sales report helps you stay focused on productivity, so you don't get distracted by unimportant tasks or let your to-do list get out of hand. Develop clear hypotheses on what needs to be optimized first to meet customer needs and organizational sales goals. This will help ensure that you have time to work on the most important tasks, which in turn makes it easier for you to complete them faster.
Leverage user insights to sharpen your intent
User behavior data can be the foundation of many other decisions that impact your bottom line. Provide some background and a bigger picture of the figures by incorporating user insights into your sales performance reporting.
Use these tools to access meaningful, actionable insights about your prospects and customers with a few clicks. Turn the information you gather about user behavior into plans and strategies that generate more revenue for your business.
Session replays: draw on user behavior to alert reps when prospects show signs of frustration. That way, they can follow up at the right time and with better context on their experience. You can even build automations to notify your sales team when a recording is available for a highly engaged prospect.
User feedback tools: collect and analyze customer feedback to identify areas that could be optimized. Use behavior insights to personalize conversations or follow up, offer better support, and close deals faster.
Interviews: dive deeper in one-to-one chats with your customers and frame your hypotheses for sales performance improvement. Prioritize fixing the issue (or issues) keeping users from turning into leads, and make more sales in the process.
With sales data at your fingertips, you can help guide your business to solid ground and scale what works best for your bottom line.
📈 How Audiense uses Hotjar Funnels to monitor and improve their sales funnel
Audience intelligence platform Audiense uses Hotjar Funnels to monitor their sales funnel. This tool lets them jump into relevant recordings to see what’s causing users to leave and sales to decrease. When the team notices an issue, they watch recordings for more context.
"We monitor our sales funnel to see where people abandon the sign-up page without converting. One day, we noticed a huge drop in conversions. We discovered that the autocomplete feature was broken, so we fixed it, and conversions went back up immediately."
Juan Fernandez, Former Head of Product at Audiense
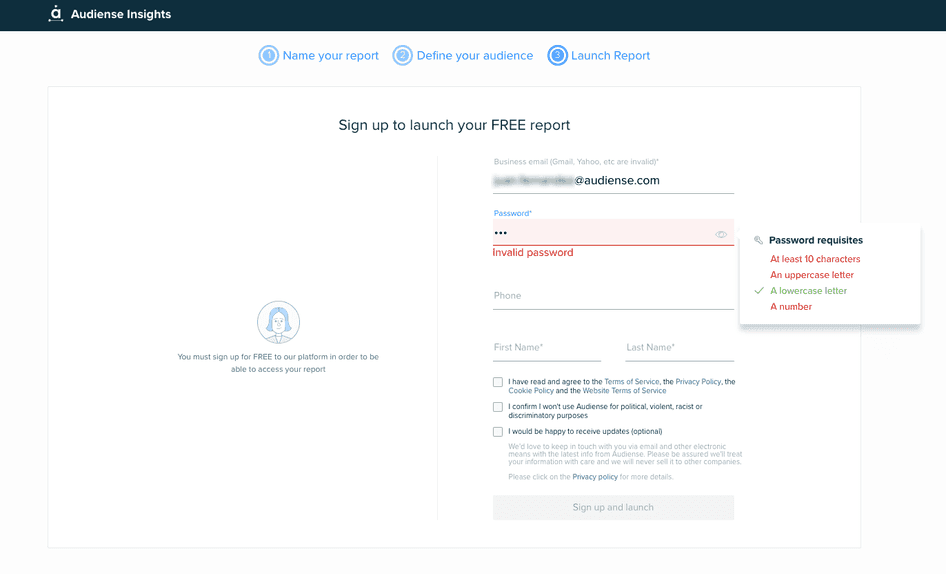
The team at Audiense used Recordings to discover that the password validator feature was broken on their sign-up form
4. Tie it all together in a sales performance report
Like most performance reporting examples, presenting data itself is only half the work; you need to put words to your figures for it to have meaning to your audience.
Here are a few key aspects to include in your sales performance report presentation:
Summarize your findings: present your findings in a customer-focused, data-informed way. Your written explanations should at once justify your data and be justified by your figures. Showcase what went well and what didn't, highlighting specific KPIs and the reasons behind them. Make sure to also outline fixes that your team plans to implement.
Tailor to your audience: focus on the purpose of your presentation as well as who you are presenting to. Tailoring the report to your audience keeps it relevant and engaging. Depending on your audience, the report format, depth, and granularity can be adjusted. For instance, while a sales rep might be more interested in lead conversion, a sales manager might look for insights into the overall sales performance of their team, and executives might need a more succinct summary.
Use visual aids: sales reports should be more than lists of numbers. Include plenty of graphs and other helpful images to show vital sales trends and metrics, and help your audience make sense of these figures. For example, an annual report might call for a line chart to show revenues month over month. Your CRM software might be able to auto-generate these charts, or you can use Excel to assist in graph creation.
Hotjar is most helpful for winning over others in the organization. Data, tables, and graphs all are great but they don’t always compel people to action. They might hint at the problem, but often people won’t believe it until they see it.
9 main types of sales performance reports
Every type of sales report provides valuable insights into your company’s sales performance. But what are some essential reports every sales leader needs to track? We've listed the most important ones below:
Remember: don’t feel like you need to build and analyze every single type of sales report. Instead, ask yourself what the purpose of capturing the data is and whether you have the resources to invest in that purpose.
For example, a small business might not necessarily need a sales funnel conversion report, but a daily sales report could be essential to keeping customers happy and things running smoothly.
3 sales performance reporting mistakes—and what you can learn from them
It takes both talent and experience to be a great salesperson. You have to constantly practice, make mistakes, and learn from them. Below are three challenges you’re bound to run into while creating sales performance reports—and the practical strategies to overcome them.
1. Jumping to conclusions
❌ Mistake: only looking at high-level numbers and immediately jumping to conclusions about why your sales team hasn’t performed and where they should focus to improve.
When you make rash decisions—and fail to validate assumptions with hard data—you risk
Wasting time and resources: you can get caught up trying to solve a problem that doesn’t exist. Ultimately, you’ll need to start over, leading to disappointment and decreased morale.
Poor product prioritization: nobody’s feelings matter more than your customers’, and ignoring their needs in favor of the internal team’s assumptions can seriously impact the customer experience (CX)
Unhappy customers: poor CX creates a domino effect, affecting sales and conversions, increasing user churn, and even harming your reputation
✅ Solution: take the time to diagnose exactly why some team members are doing better than others and the specific metrics that need to be developed.
Challenge assumptions by looking for data that disproves them. Go granular, take every factor into consideration that could influence trends, and use qualitative data to uncover the factors you hadn’t thought of.
💡 Pro tip: use behavior and web analytics tools to investigate and understand what's happening with your prospects and customers to avoid acting on assumptions—and find out the real reason for your team’s performance. For example, with Hotjar you can
Save important snippets from recordings and heatmaps as Highlights and group them into related Collections, helping your team identify patterns, validate assumptions, and prioritize brilliantly
Dig deeper into what users are doing and how they feel by placing feedback widgets and surveys on your website or product
With Highlights, teams can easily sort through, categorize, and share valuable insights
2. Focusing solely on quantitative metrics
❌ Mistake: a singular focus on quantitative metrics won’t be enough to get your growth metrics to where they should be, since they overlook the qualitative aspects of sales performance. The quantitative needs to meet the qualitative for in-depth analysis to happen.
✅ Solution: good sales reports start with insightful data. But the best ones go beyond the numbers, and dig deeper into how real prospects and customers experience your sales process.
By incorporating qualitative data, such as customer feedback and sales team observations, sales performance reports can provide a more holistic understanding of effectiveness.

3. Losing sight of the sales team
❌ Mistake: sales performance reporting can leave sales reps feeling off. Some will be overwhelmed when missing the target, while others will bask in their success, not analyzing why and how they got there.
Your team’s emotions affect their performance. If you’re not lifting people up and removing obstacles from the salesperson’s path, it leaves your team unproductive, unmotivated, and lacking energy.
✅ Solution: to tap into your sales team’s full potential, build a culture that inspires your reps and makes them enjoy coming to work.
Motivate and inspire: leverage what inspires your team members to make them work harder. Monitoring and showing the sales performance of each team member motivates them to do more and aim for the best outcomes.
Offer training: people won’t want to pitch prospects something they can’t understand. Make sure your reps have the right sales skills by having them spend time with your product manager or marketing teams to learn about the features and benefits customers care about.
Celebrate the wins: don’t just point out what the team’s been doing wrong. Instead, identify what’s been going right and give employees positive reinforcement. People tend to work harder when they know that they’ve got a champion in their corner.
Provide context for improvements: your sales team needs context for the changes you’re proposing. Break down the metrics and support your team with understanding their performance and what to focus on moving forward.
Connect the dots between customer needs and sales performance
Understanding sales performance analysis helps you find areas to improve sales consistently. And making this an ongoing process lets you fine-tune your business model and adjust to market changes.
So, when it’s time to make important sales performance decisions, equip yourself with the right data. Use Hotjar to get granular insights on your prospects and customers, remove guesswork, and make sure you target the right metrics, at the right time.
With the right insights, you’ll tackle sales performance challenges with confidence, and get the results you need.
Put your customers at the heart of everything
Heatmaps, Recordings, Feedback, Surveys, and Interviews give you everything you need to understand your users—and all five tools are available in the Hotjar suite for free.
