Learn / Guides / Performance reporting guide
Marketing performance reporting: 10 steps to turn data into insights for your team
Marketing performance reporting helps you measure progress toward goals, keep your team aligned, and make better business decisions. But how do you report on performance accurately?

Marketing reporting takes quantitative and qualitative data from different sources and translates it into insights you and your team can act on.
Reports may provide an overview across all of marketing, or they might home in on specific areas or channels, like content marketing, performance marketing, ecommerce analytics, or ongoing campaigns. But in every case, the overall objective of marketing reporting is the same: to help inform better decisions.
This post walks you through the ten steps to create marketing reports that move the needle.
Great reports start with insightful data
Hotjar's visual marketing insights help you connect the dots between website behavior and customer needs. Get the data that great decisions are made from.

Let’s walk through what you need to build an effective marketing report, broken into three key stages:
Before you start
An insightful performance report that multiple stakeholders can learn from starts by answering three questions:
What does my audience want to know?
What data do I have available?
How can I most clearly present the data to satisfy my audience?
1. Know your audience
Good marketing reporting is like all customer-centric marketing: it’s designed around your audience and their objectives. Therefore, knowing what your audience wants and how it will support decision-making shapes the information you present.
As you move outside of your immediate team and climb up the strategic levels of management, people generally want fewer details and more high-level takeaways.
For example, your marketing peers might care more about visibility and opportunities for collaboration. Meanwhile, your CMO wants to know what initiatives drive business, so they can best allocate resources.
So, consider these two factors when thinking about your audience:
Team: your team vs. other marketing teams
Level: from individual contributors to the CMO
This way, you ensure your report covers every base and gives all your stakeholders something to work with.
📝 Note: if you’re creating a report intended to serve vastly different needs, you might consider producing separate reports for different stakeholders.
For example, imagine you're in charge of content reporting. You might produce one report to show your peers what content drives the most engaged traffic and a second report for the CMO that highlights growth in SEO traffic and organic traffic-to-lead conversion rates.
2. Determine what data to include
There are many types of data to include in a marketing report, such as:
Output metrics: e.g. blog posts published, campaigns launched, emails sent
Outcome metrics: e.g. new organic traffic, newsletter sign-ups
Funnel metrics: e.g. new leads, new customers, conversion rates
Revenue metrics: e.g. ROI, CAC, LTV
Qualitative data: e.g. testimonials, survey feedback, heatmap data
Ultimately, the data you include goes back to what your stakeholders want to see and what data you have available to you.
The metrics you own, and the team you’re in, influence the performance reports you create. Your goals may be cross-functional or channel-specific, but what matters is establishing the key data points and communicating clearly with relevant stakeholders.
Google Analytics is the go-to platform for website traffic, engagement, and conversion information. More mature teams use data analytics software to connect website and product behavior.
Tools like Hotjar (👋 yup, that’s us) combine quantitative and qualitative data, so teams can go beyond what is happening on their site to better understand why. Why is our conversion rate down? Why are people bouncing? These are the kinds of marketing reporting insights that motivate action.
💡 Pro tip: Hotjar’s visual insights come from many sources (like heatmaps and session recordings) and can be visualized in many forms: funnels, dashboards, highlights, and trends.
These insights bring instant clarity to what’s working and what isn’t, helping you prioritize decisions about where to allocate resources.
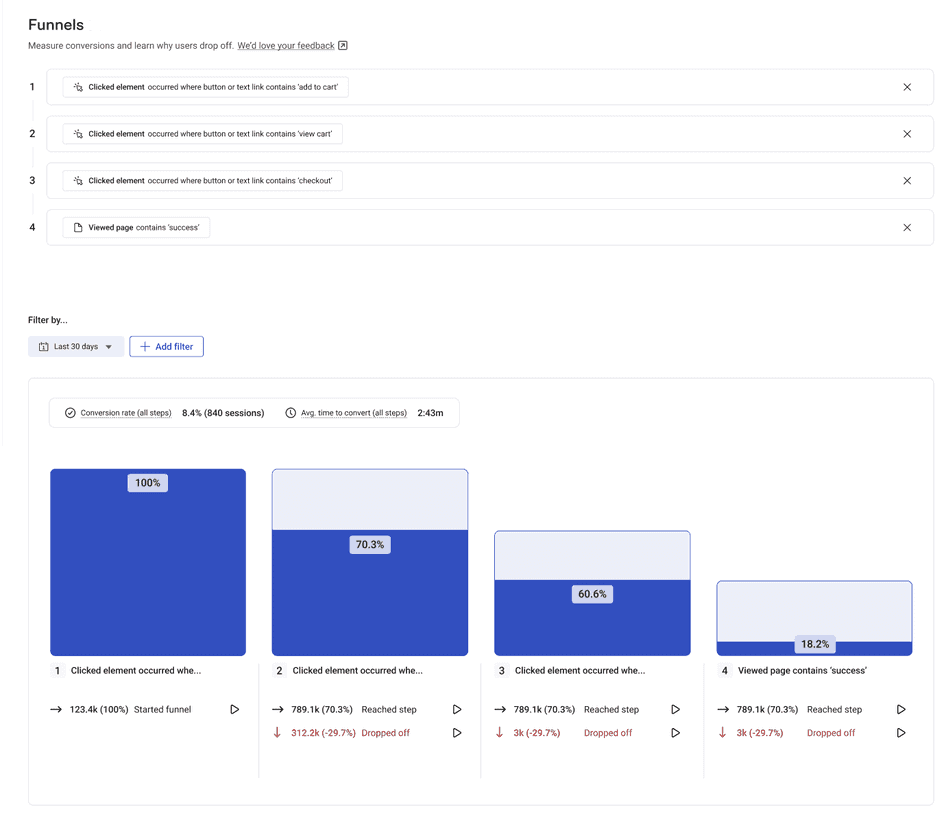
Hotjar funnel reports visualize conversion flows across your funnel
Remember: it’s not about the data you include but the story you tell. The connections you make between data points are what make for an insightful marketing report.
3. Decide the presentation format and frequency
There are several ways to present a marketing report:
Slide deck presentation
Google Doc write-up
One-page PDF report
Google spreadsheet compiled by Supermetrics
Link to insights from an analytics platform, like a Hotjar Trends report
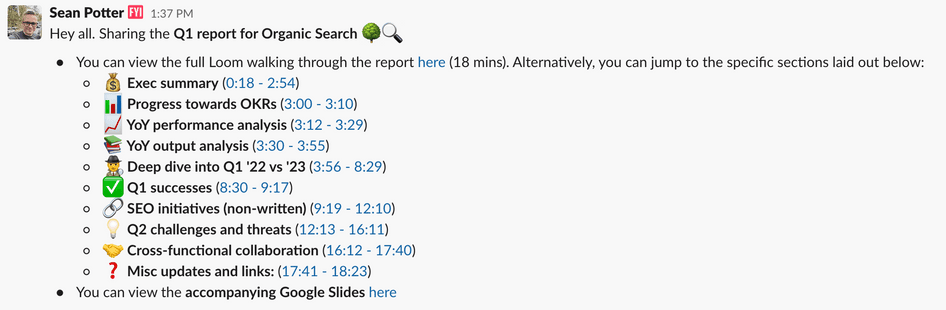
For example, Hotjar’s Senior Content and SEO Strategist Sean Potter shares quarterly Organic Search reports on our Marketing Team Slack channel, presenting his slide decks in a Loom video the team can review asynchronously.
What you choose depends on the information you include and how you present it. Will you email it for people to digest on their own? Will you present it in a meeting with live Q&A? (Friendly hint: don’t host a meeting to read off your slides to others. People don’t like this.)
🤔 How often should I send a marketing report?
Monthly is a good default for most reporting. Data on a shorter timescale can fluctuate widely, making it hard to draw conclusions. Data over a longer time frame might be too late to take action.
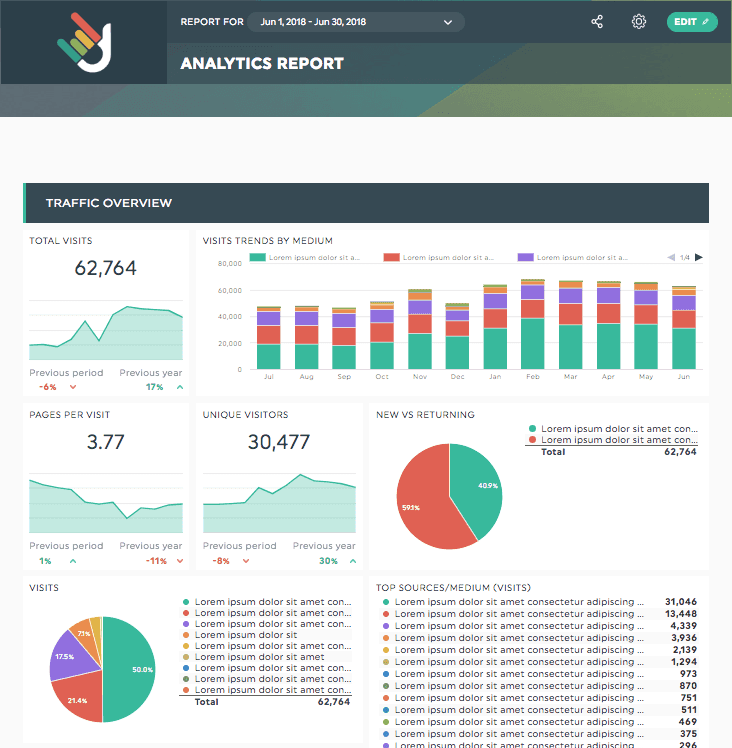
An example marketing dashboard from DashThis (who recently increased customer satisfaction by 140%)
Creating your report
Once you understand your audience, data, and format, it’s time to put it all together in a way that’ll make your teammates say: "Wow, that’s insightful."
4. Share insights, not numbers
Some reporting is about progress tracking: showing where you are relative to predefined marketing metrics and key performance indicators (KPIs). But insightful performance reporting goes beyond the numbers to share context and connect the dots.
The key to great performance reporting is to paint a clear and accurate picture of the connections within your funnel, and link how your team’s work has impacted that picture.
Here’s the difference between marketing data and insights:
Data: “We got 80 qualified leads.”
Insight: “We’ve increased leads by 15% each month this quarter by showcasing our customers in campaigns, focusing on a narrower audience, and improving site UX. Here’s a trend graph that sums it up.”
Which do you think is more useful to your audience?
5. Include a report summary with takeaways and next steps
This is the most important part of your report: one slide or brief section that sums up what matters—wins, learnings, challenges, and focus for the upcoming period.
Here’s an example:
Hypothesis: we can improve campaign conversion rates by using real customer stories
Test: we launched a campaign to A/B test content with customer stories vs. statistics
Results: customer stories got 2x conversion rates, with a 15% increase in new customers
Next steps: expand and optimize the campaign with a user-centric CRO approach
Be sure to include a reporting period so it’s clear when the data was collected.
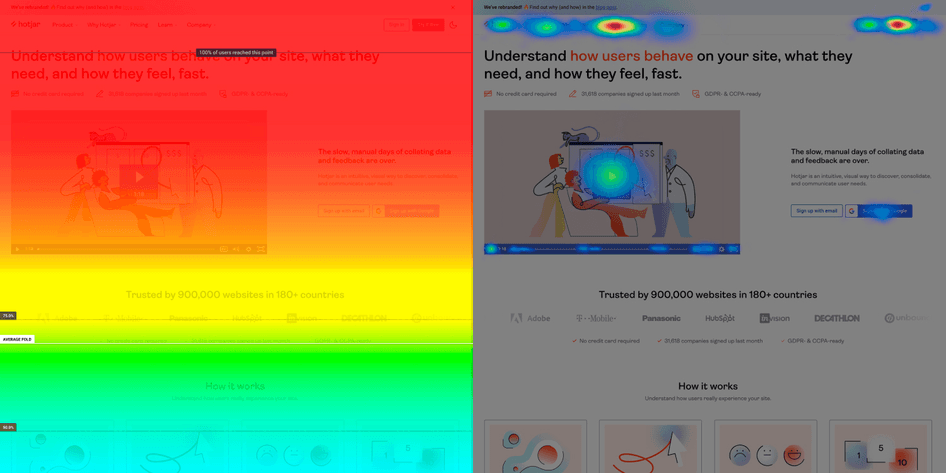
💡 Pro tip: Hotjar’s session recordings and heatmaps visually represent how users click, scroll, and move through your site, so you know exactly where to prioritize your optimization efforts. Not only is it insightful—it looks great in your marketing report, too.
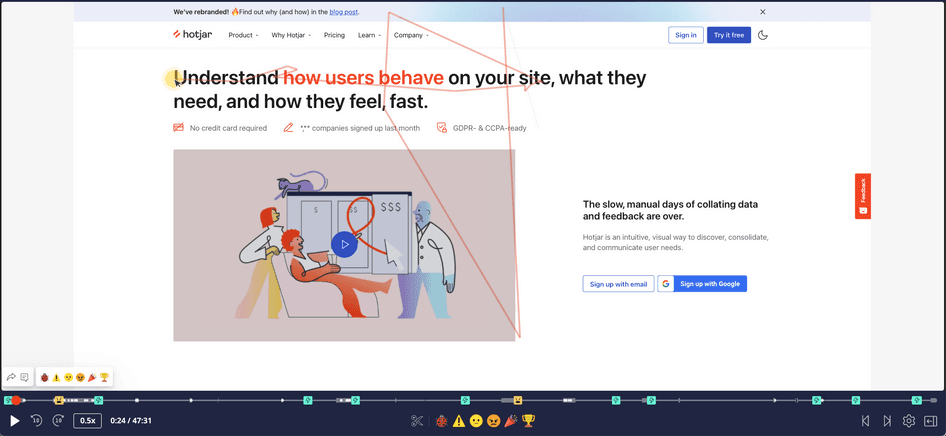
Hotjar Recordings uncovers insights in user behavior that stands out in marketing reports
6. Give your report a clear structure
A good digital marketing report shows people what they can expect and helps them easily find what they’re looking for. It’s as simple as adding a table of contents and defined sections.
Here are a few ways to break up reports:
Channel: useful for global reports across all marketing activities
Campaign: useful when presenting a variety of ongoing initiatives
Funnel stage: such as awareness, consideration, or conversion
KPI: for tracking progress and identifying blockers and opportunities
There's no one right way, but whatever way you choose, make it easy for people to follow.
7. Add charts, images, and visualizations
Visual information is easier to process than blocks of written text. It’s also more impactful.
Did traffic increase by 310%? Show it in a line graph shooting off the chart. Did you just hit your quarterly OKR targets? Show it in a completed progress-to-goals chart.
You can also add screenshots to help people visualize different campaign variants you’re A/B testing. Or, include heatmap data to point out the UX issues you’ll be optimizing next sprint.
8. Eliminate unnecessary information
Once you’ve got your data visualized and organized into an insightful report, it’s time to go through it again with your audience in mind.
Question everything: is this graph intuitive? Is this data insightful? Is this information actionable?
Chances are you’ve included more than people care to see. Remember: just because you have the data available doesn’t mean you must include it.
But wait! Information that’s unnecessary for one person might be hugely interesting for another. That’s what appendices and hyperlinks are for. Move your details to an appendix at the end of your report, or link out to another doc.
5 tips for better marketing reports
🗑 Remove detailed data dumps. If it’s not tied to a takeaway, move it to an appendix.
🔎 Use legible fonts. Good reports don’t require a magnifying glass to read.
📈 Include only one piece of info per slide or chart. Don’t make sections too dense.
🧐 Watch the jargon and acronyms. Terms and abbreviations should be obvious to your audience.
✏️ Ask your content team for tips. They love to cut words. 😉
Refining for next time
After you’ve created your first marketing performance report, it’s time to take it back to the beginning.
9. Ask for feedback
We started this list with our audience, and that’s exactly where we go next: back to our audience, to make sure they got what they needed.
Send your team a quick feedback survey to see how satisfied they are with your report, and what you can do to improve. You might even use your internal stakeholder satisfaction score as a team metric to make sure you’re spending time on reports people care about.
10. Create a marketing report template
Once you’ve got a format that works, turn it into a template so you don’t have to start from scratch every time. This gives you more time to uncover insights people will thank you for.
But remember that even templates need touch-ups. Your marketing reports should ride a fine line between being standard and predictable, and evolving to reflect new needs and available data.
💡 Pro tip: using Hotjar? View your custom Hotjar Dashboard to extract insights in a visual form, so when it’s time for reporting, you’ve got exactly what you need.
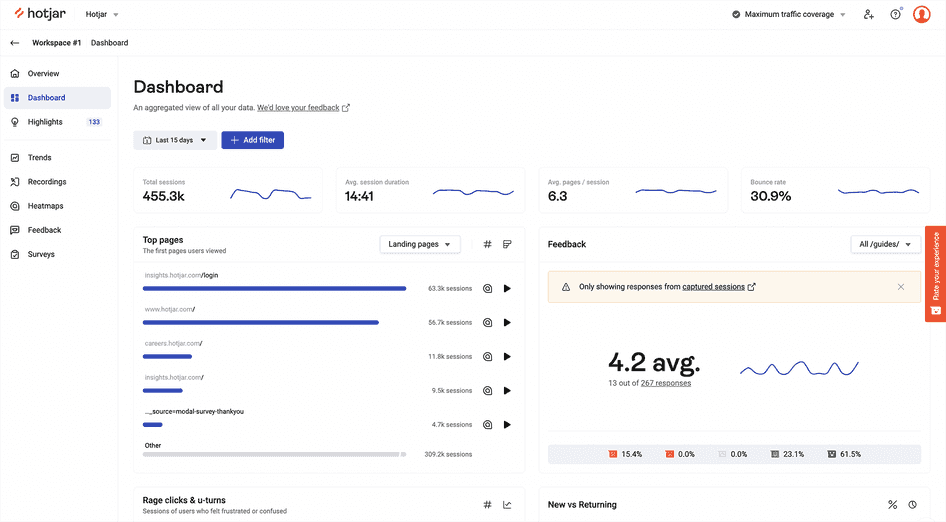
Your Hotjar Dashboard lets you easily capture insights to enhance marketing reports
Why you need better marketing performance reports
You’ve probably heard the famous quote, “If you can't measure it, you can't manage it.” But measuring won’t help if you don’t turn those metrics into digestible insights your team can act on.
Performance reporting encourages you to look at outcomes. If you only focus on inputs, you’ll spend time and budget on tactics without knowing if they actually delivered growth.
Effective marketing reporting helps you:
In brief, it’s about creating a data-driven marketing mentality that prioritizes outcomes and smart decisions alongside creative campaigns and brand positioning.
Reporting insights that drive decisions
Like a successful marketing campaign, an effective marketer's report starts with your audience and their needs.
The next step is to connect your data. By spotting patterns in the numbers, you transform information into insights.
And when you wrap this into a clean marketing performance report with clear takeaways, you give your team the clarity they need to make insight-driven decisions.
Great reports start with insightful data
Hotjar's visual marketing insights help you connect the dots between website behavior and customer needs. Get the data that drives decisions.