Learn / Guides / Product adoption guide
10 product adoption metrics and KPIs your business needs to track
After months of anticipation and excitement, you’ve released your product into the world. And by tracking user behavior trends, sales figures, and engagement metrics, you know customers are interested.
But once they buy or activate your product, you still need to know whether they’re actually using it—and to its full potential.
This is where product adoption metrics come in.

This guide walks you through the top 10 product adoption metrics businesses need to track. We’ll also show you how to develop your product adoption key performance indicators (KPIs) to spot key improvements and better meet user needs.
Want to learn how customers really adopt your product?
Hotjar helps you understand how people use your product—and how you can improve it.

10 key product adoption metrics and KPIs to track
Product adoption metrics help you measure and track how successful your product is at meeting your users' needs and helping them achieve their goals.
These metrics also show you if your onboarding process drives users to adopt, and whether they’re realizing the full value of your product. By understanding how customers use your product—and what stops them from adopting—you can improve it.
Use the following metrics to inform your product adoption KPIs and business objectives. Every business will have its own mix of metrics and KPIs to track—use our list to guide your choice.
1. Product adoption rate
Product adoption rate measures how many people become regular users of your product to help them achieve their goals. It’s about tracking how many customers actively use your product, as opposed to just activating or downloading it once.
Tracking product adoption rate provides important insights into how ‘sticky’ your product is—how often users return to it. You can measure this as often as you need.
For example, a product team might measure product adoption weekly after a new launch. This lets them check initial success and tweak product adoption strategies. A SaaS company, however, might measure it monthly to visualize adoption over time.
How to calculate product adoption rate: (new active users ÷ signups) x 100
Feature adoption rate
Part of understanding your adoption rate is measuring the total number of users who regularly use specific features. Feature adoption rates tell you if users are making full use of your product—and whether they keep discovering new features and use cases.
How to calculate your feature adoption rate: users who used a feature X times ÷ total users in a segment
If you have a low feature adoption rate, adjust your onboarding process to better walk users through your product and its key features.
For example, educating users about key features and how to use them during the onboarding process of a SaaS product might include:
Tooltips
Pro tips
User guides
Video tutorials
2. Activation rate
Activation rate measures the number of users who begin a product trial and reach a specific touchpoint or milestone. A 'milestone' could be any key action, like syncing your product with a Google account or uploading a file.
Activation rate helps you track how new users reach and understand your product's perceived value, and whether you've created a streamlined user experience (UX) and flow.
How to calculate product activation rate: (total number of users who reached an activation touchpoint ÷ number of users who signed up) x 100
If your activation rate is low, you may need to reduce the number of steps during onboarding before a user reaches their activation point.
3. Time to value
Time to value is the amount of time it takes a user to realize your product value (and validate their expectations). This is also known as their ‘aha moment.’ The faster they understand the value and how it can solve their problems, the more likely they’ll keep returning to it.
Time to value helps you differentiate users who purchased your product from users who get value from it. It can also tell you whether users perceive your product as user-centric. If not, you may need to conduct further usability testing.
How to calculate time to value: the amount of time* it takes users to reach their first aha moment (*where time is measured in user clicks or minutes)
Use this metric to detect product usability issues or friction areas that block users from reaching their aha moment. You can also find out whether that specific aha moment is relevant for other users. For example, for a SaaS music streaming company, the aha moment could be when new users add a song to their playlist. For a cloud-based storage company, it could be when new users share their first file.
💡Pro tip: combine quantitative product adoption metrics with qualitative insights using Hotjar's Observe and Ask tools to go deeper into understanding why users adopt your product, how they use it, and what affects time to value.
Watch Recordings of user sessions within your digital product or let users tell you about their experience via our unobtrusive Feedback widget. Used together, these tools provide actionable insights into how you can improve your product to better meet user needs.
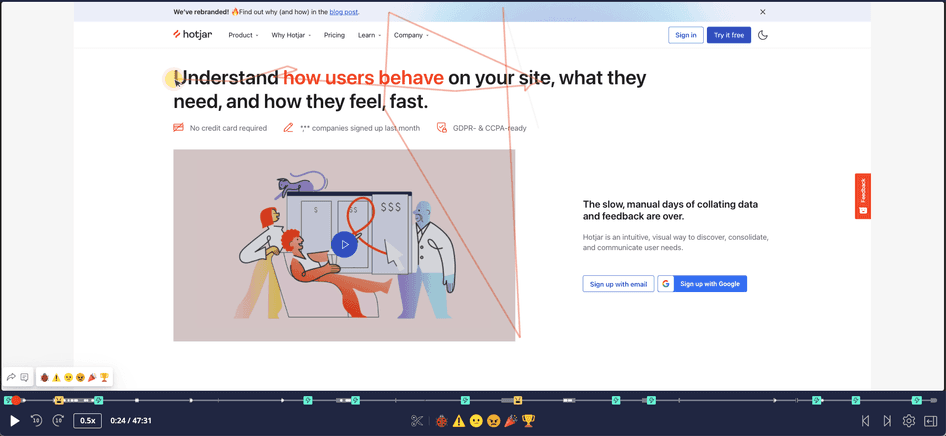
Hotjar Session Recordings let you visualize how users navigate your website and digital product
4. Customer lifetime value
Customer lifetime value measures a customer’s total worth to your business over your entire relationship. It lets you monitor your ability to retain customers and increase their value-spend over time—and, ultimately, drive growth.
It also tells you whether a customer finds value in your product over time, and alerts you to early signs of churn like:
Downgrading subscription packages
Drops in weekly product use
This helps you spot gradual trends in customer behavior and find new ways to create customer delight.
Use this formula or web analytics tools like Google Analytics to calculate customer lifetime value:
Customer lifetime value = customer value* x average customer lifespan (*where customer value = average purchase value x average purchase frequency rate)
If your customer lifetime value is low, it’s a good sign that you might need to increase your average order value. Try:
Placing clusters of commonly purchased items on your checkout page to tempt shoppers
Upselling your products or product plans to valued customers
You may also need to improve your customer support. Offer better call-center support and empower users to self-serve with interactive resources, knowledge bases, and user guides post-adoption.
5. Churn rate
Churn rate tells you how many users stop doing business with your company within a given period. This helps you understand whether you’re successfully retaining customers, and it can alert you to the need for both quick product fixes and long-term changes.
How to calculate customer churn: (number of customers beginning of the month - number of customers end of the month) ÷ customers beginning of the month.
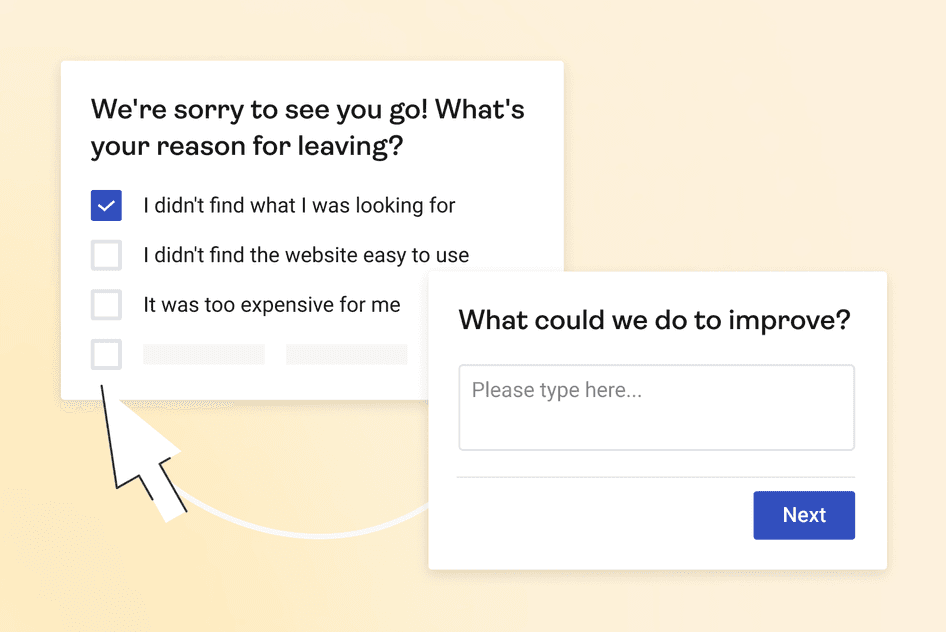
Use this metric to test your customer and product experience and identify key issues or areas for improvement. Then, use Hotjar's exit-intent Surveys to ask users why they’re leaving. You can set these to launch right as customers are leaving your digital product to better pinpoint user frustrations and make improvements.
6. Conversion rate
Conversion rate measures the number of users who complete desired actions like:
Filling out a form
Signing up for a free trial
Purchasing your product
And it’s not just about measuring user clicks. It might also include monitoring the percentage of users who completed an in-app action or installed your software.
Tracking conversions shows you which channels convert and helps you identify high–value users. It also highlights issues in the user experience. For example, a buggy UI preventing user sign-in, or a checkout page with a broken ‘complete purchase’ button. This lets you make key improvements to the user experience to drive product use and adoption.
How to calculate conversion rate: (total number of conversions ÷ total number of unique visitors) x 100
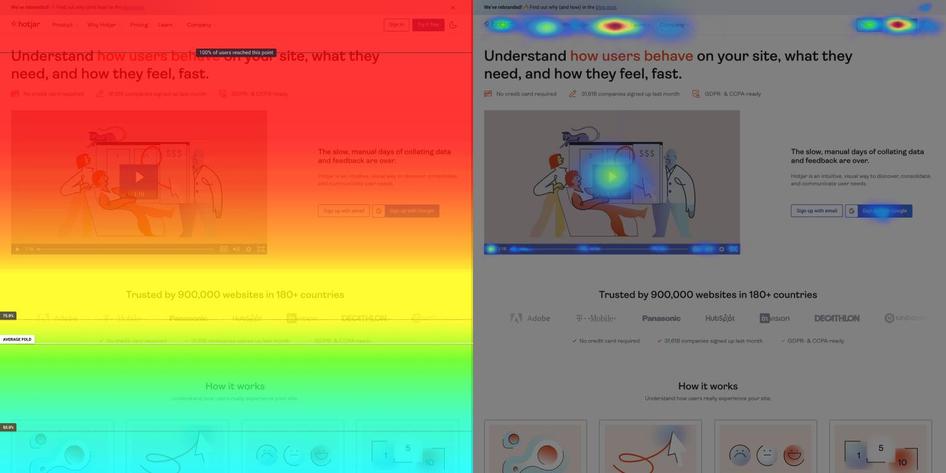
Use this metric to spot trends in customer satisfaction and product adoption—and locate potential UX or UI issues. Then, analyze heatmaps to see which page or product elements distract visitors, and remove them.
For example, if you notice that your conversion rate is low after a new product launch, refer to heatmaps, which might reveal that your chatbot pop-up is distracting and blocking users from clicking on an important call to action (CTA). If so, you can quickly relocate the CTA to increase conversions.
7. Average session duration
Average session duration is a Google Analytics metric that measures the average time a user spends on your website or web app. A user's session begins when they enter your site and ends when they exit, or are inactive for over 30 minutes.
Tracking average session duration tells you how likely users are to adopt your product. How long they linger reveals their level of interest, urgency, or need for your solution. It also tells you if you’re enabling an intuitive user journey that drives exploration and discovery of your product or website.
Use Google Analytics or the formula below to calculate average session duration. Then, use your results to see if you’re creating an engaging user and product experience that compels users to learn more about your service.
Average session duration = total number of sessions ÷ total time spent across sessions
If you have a low average session duration, you can take steps to improve web design, product design, or the user experience. These boost interest in your brand and product and increase user engagement.
8. Usage frequency
Usage frequency is how often a customer uses your product. It’s measured by the frequency of log-ins or user sessions. This lets you segment customers into:
Active users
Frequently active users
Occasionally active users
Inactive users
These segments help narrow your focus on customers that need more attention.
Usage frequency = number of log-ins or user sessions within a specific timeframe
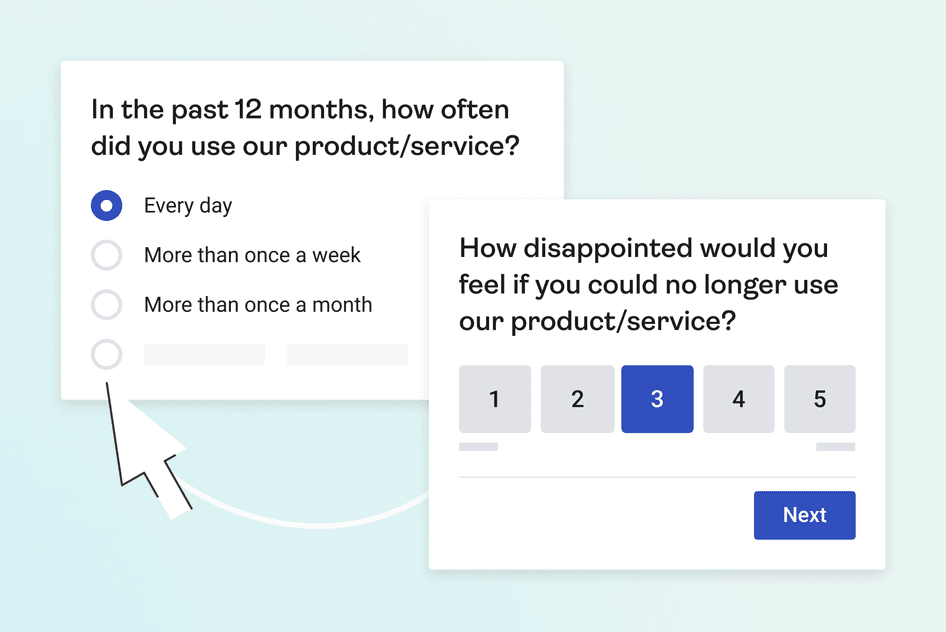
These findings help you determine if you’re successfully providing value to your users with your product. If your usage frequency is low, go deeper into the user experience with a product-market fit survey to get insights into whether your product satisfies market demand, so you know what to improve.
9. NPS Score
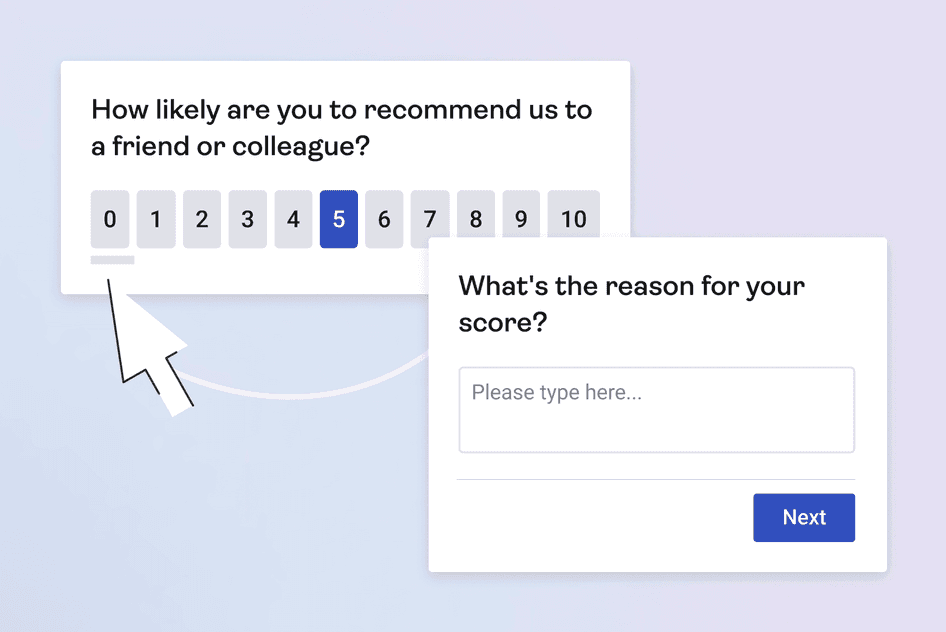
Net Promoter Score®(NPS) measures long-term customer satisfaction and loyalty. NPS surveys ask users how likely they are to recommend your product on a scale of 1 to 10. This quantitative score lets you identify your biggest fans or critics.
Then, you can ask users to explain why they gave you the rating they did. This layers a qualitative understanding of the ‘why’ onto your quantitative score.
Use your NPS score to:
Understand what affects customer perception of your product over time
Gauge customer satisfaction
Track customer sentiments across segments
This lets you keep your finger on the pulse of why users adopt (or don’t) your product long-term.
10. CSAT Score
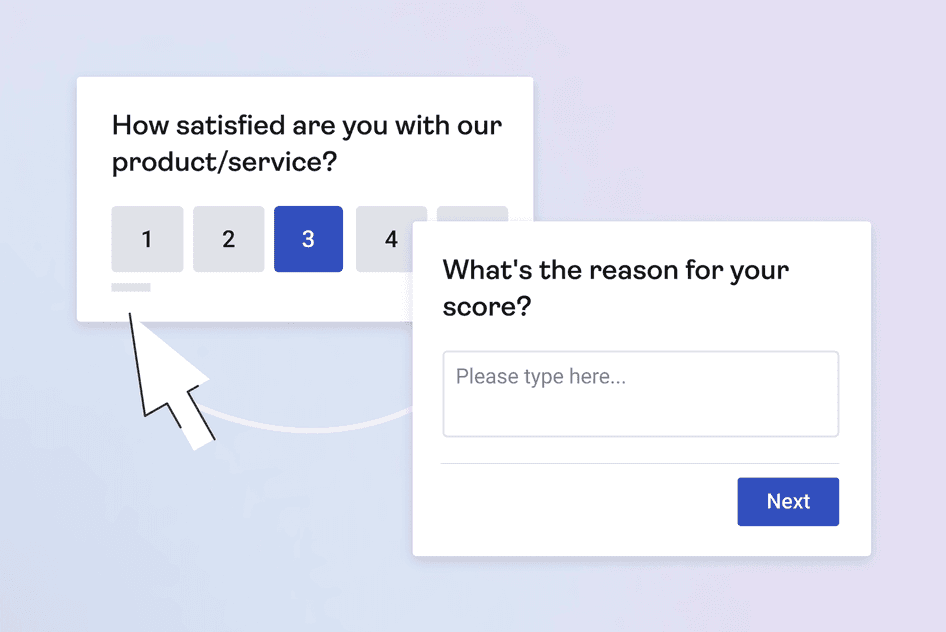
Customer satisfaction (CSAT) scores measure short-term customer satisfaction at key points in their buyer journey. You can collect CSAT scores with surveys that ask customers to rate their level of satisfaction on a numerical scale, whether they're dissatisfied or satisfied, or sad or happy.
CSAT surveys help businesses and teams check in with customers and measure satisfaction rates short term to help you better understand sudden increases in product adoption or churn. If you’re using Hotjar, you can also ask users to provide a reason for their high or low satisfaction score, and spot where you can make small changes to remove friction and improve adoption.
Supercharge your product adoption metrics with user-backed PX insights
The way customers use your product and features changes all the time. So you need to track your short- and long-term progress with product adoption metrics that reveal key trends in customer buying and adoption behavior.
Use our guide to the top product adoption metrics and determine which of these you need to track for your business. Then, start tracking how you stack up against industry benchmarks. Or, better, weigh your metrics up against your previous performance to highlight adoption trends specific to your company goals.
Finally, combine quantitative metrics with qualitative user insights. When you know how users think and feel about your product, you can make changes to boost product activation and adoption.
Want to learn how customers really adopt your product?
Hotjar lets you understand how people use your product—and how you can improve it.