Learn / Guides / What makes a good product manager
How great product managers create powerful reports to drive action and growth
Do your product reports leave stakeholders lost at sea with too many metrics to make sense of? Or do they chart a clear course by weaving user and product data into a captivating narrative? If you want to create reports that achieve the latter, you're in the right place.
This guide helps you unlock the full potential of your product reports with tools and techniques that connect the dots between numbers and user stories. Keep reading for tips to build a compelling case for action for your team.
Summary
Carefully crafted product reports help you prioritize initiatives with ease, win buy-in, and propel your team forward. Here’s how to make waves as a product manager reporting on product performance:
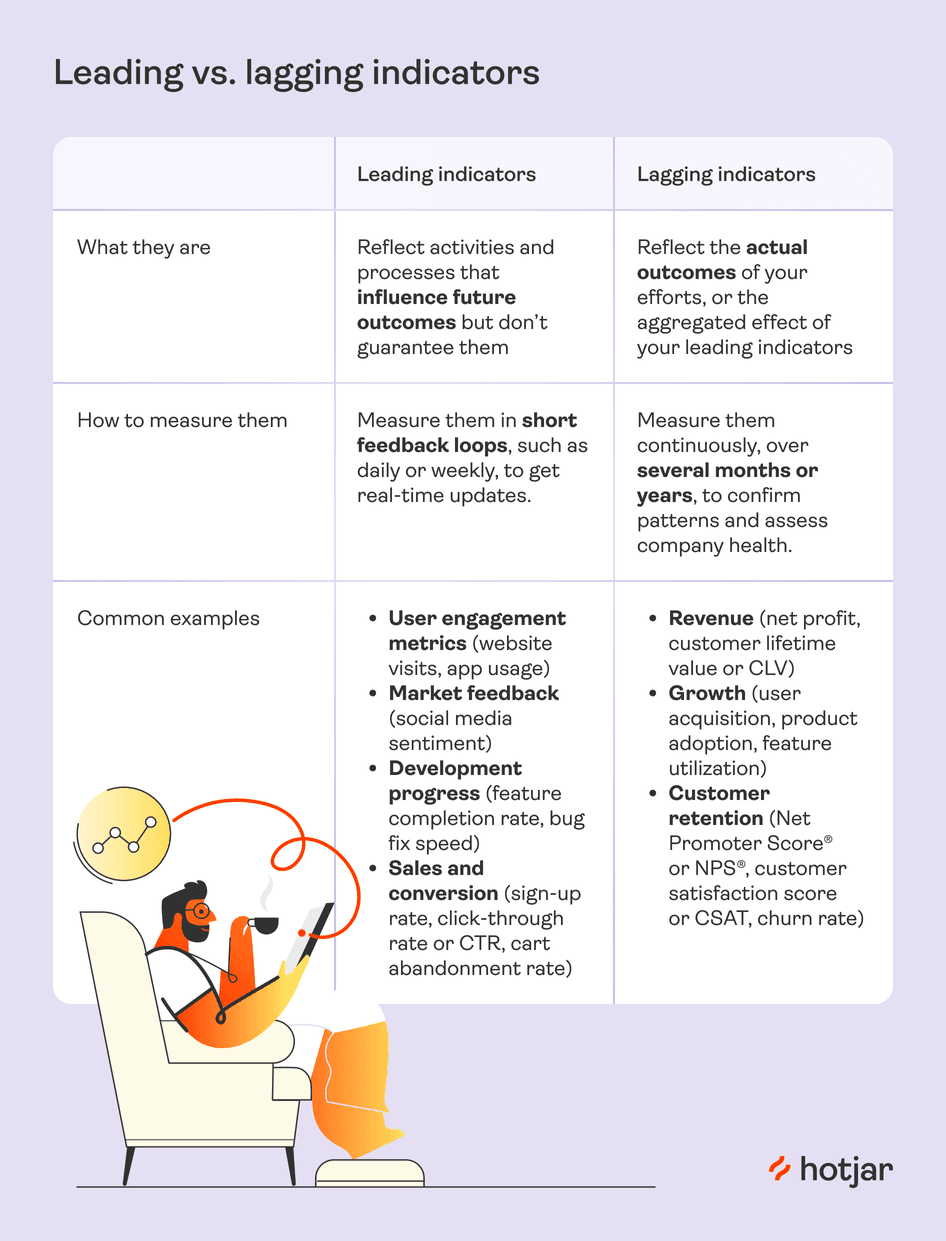
Identify and track crucial data: confirm whether they’re a leading or lagging indicator
Create dedicated dashboards for several areas of interest: get real-time, high-level performance updates
Find the smallest segment of your data: get granular to deepen your understanding of the why behind what’s happening
Weave quantitative and qualitative data into a compelling narrative: paint a comprehensive picture to properly evaluate product success
Tailor reports according to your target audience: report on the metrics and KPIs that matter to your team, in-house collaborators, and executives
Plus, here are three product report examples to help you get started:
Determine your data types and sources
Product managers keep a close eye on metrics and key performance indicators (KPIs) and report on their evolution. These metrics should align with your product vision and product strategy—what your product will become when it ‘grows up’ and what steps you need to take now to get closer to that goal.
For better product performance reporting, classify your most crucial metrics into two buckets: leading indicators and lagging indicators.
After setting targets against your goals, track your progress using product analytics tools. For example, you might measure website traffic with Google Analytics (GA) and study trends in Mixpanel. Then, there’s Hotjar (that’s us 👋), which gives you traffic data, trends, and qualitative user behavior insights all in one place.
Did you know? The Hotjar suite does it all, but we also have easy-use integrations with Google Analytics and Mixpanel should you need to reference GA and Mixpanel reports.
🛠️ Add Hotjar to your reporting kit
Hotjar's full suite of product experience insights solutions helps PMs produce impactful product reports. Our tools work together to weave a powerful narrative that inspires your team and engages your bosses.
Keep your eyes peeled for hot tips on maximizing Hotjar's tools and features throughout this article. 👀
Leverage product experience insights from Heatmaps, Recordings, Surveys, and more to enrich your reports.
Create dedicated dashboards for several areas of interest
PMs need a place to monitor all the metrics we’ve just mentioned. Enter Dashboards. As your team’s command center, a dashboard offers a real-time, visual overview of key metrics and KPIs.
With a product experience insights tool like Hotjar, it’s even possible to set up multiple dashboards for different areas of interest:
Create a dedicated dashboard to track the adoption of a newly released feature
Maintain other dashboards to swiftly and frequently monitor performance, e.g. that of your homepage or onboarding flow
Here’s another reason to play around with dashboards: they‘re dynamic and interactive, allowing you to drill down into specific data points and dive into the real user behavior behind the metrics in a single click.
✅ Make deep dives a habit
Say you just launched an AI personal trainer feature on your fitness app. You want a well-rounded picture of its initial adoption, so you look at the number of daily active users and average session lengths, which continue to climb.
But then, you notice a spike in rage clicks—rapid, frustration-induced clicks or taps. You click through to watch recordings of sessions where these rage clicks occurred.
Instantly, you discover users skipping yoga poses and advanced HIIT routines because of confusing instructions. This prompts you to discuss rewriting unclear cues with the product marketing team and send a pain point survey to users for additional insights.
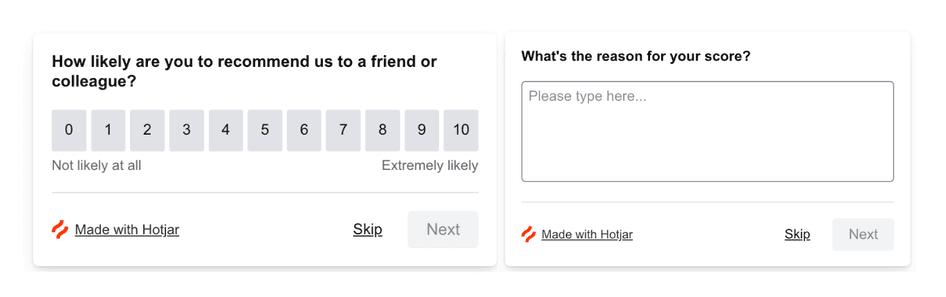
Set up your survey in seconds with this AI assistant
Find the smallest data segment possible
Product managers use segmentation to divide and organize data based on key criteria. Segmentation lets you get super-granular and view the data according to your needs. Easily search for the information that matters to your team for faster decision-making and better troubleshooting.
For instance, when sorting through your session recordings in Hotjar, you can use filters to find the smallest segment of your data. This helps you fight overwhelm—that feeling of not knowing where to start—which can happen if you’re faced with many session recordings.
To see fewer, hyper-relevant recordings, segment by
Date
Session
User attributes, e.g. geography, device, Hotjar User ID
Technology
Feedback
Experiment variant
Page URL
You can also apply filters to segment and analyze Heatmaps, Surveys, and Feedback data, adding depth to your data analytics reports.
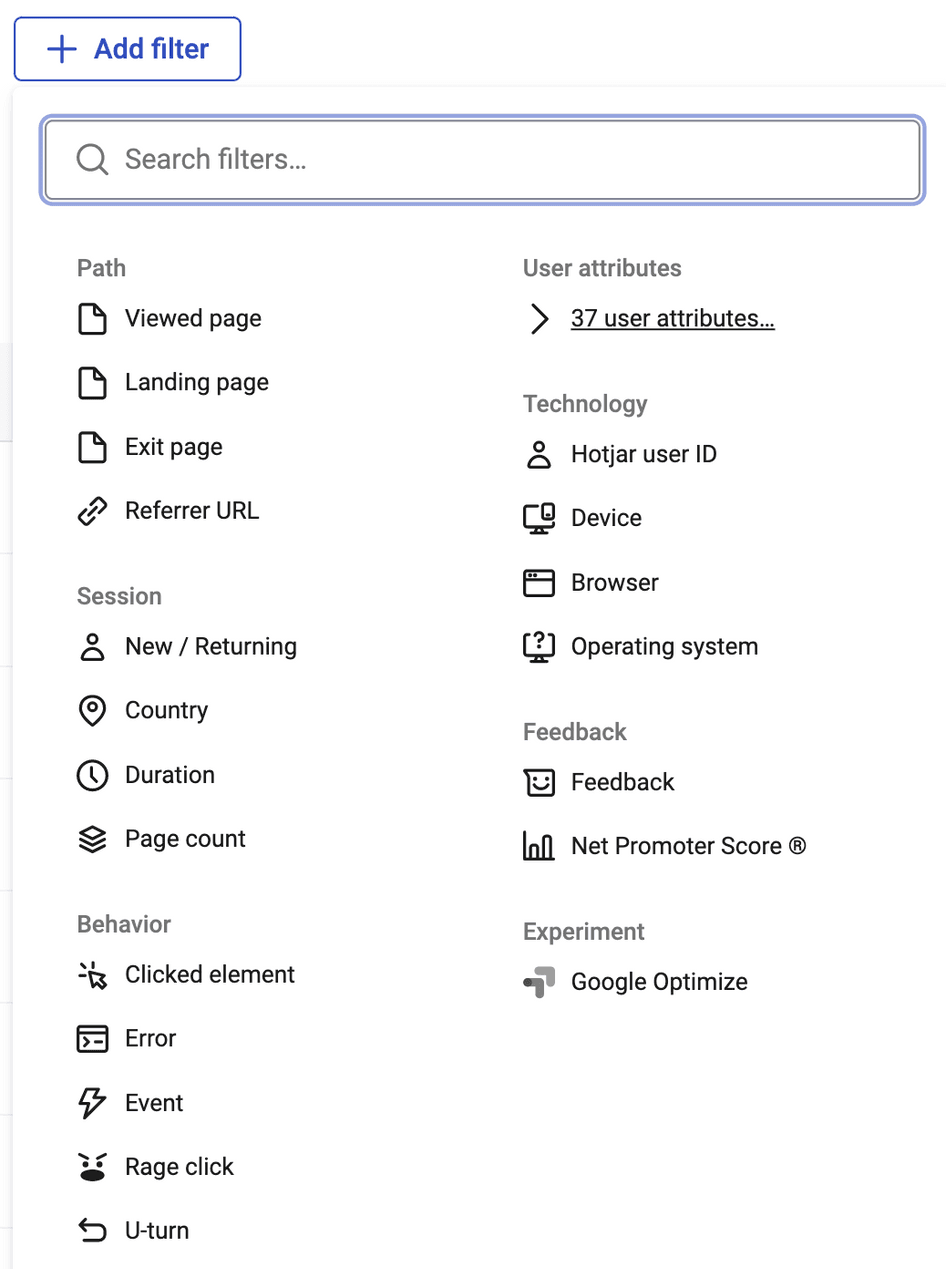
Use filters to narrow down your data
Weave quantitative and qualitative data into a compelling narrative
PMs tap into numeric and visual data for various purposes. They monitor overall product health and success, understand the user experience (UX), spot problems and opportunities, and track product development progress.
But there’s a snag: merely showing statistics and charts can lead to a piecemeal grasp of product issues. This approach can also cause data fatigue, which prevents teams from knowing which tasks to prioritize. Plus, the numbers may not be enough to convince higher-ups, which could lead to less budget and support.
Fortunately, you can sprinkle storytelling into your product reports to improve your chances of success. Blending website performance metrics with UX insights enables you to craft clear and compelling reports for your target audience. This way, you don't just cite the data; you also explain why it matters.
Here’s an example:
Map out the user journey using Hotjar Funnels, highlighting the paths users take through a product. Then, use Heatmaps to understand where users click, move, scroll, and rage-click, offering a visual story about user engagement and behavior within the product’s interface.
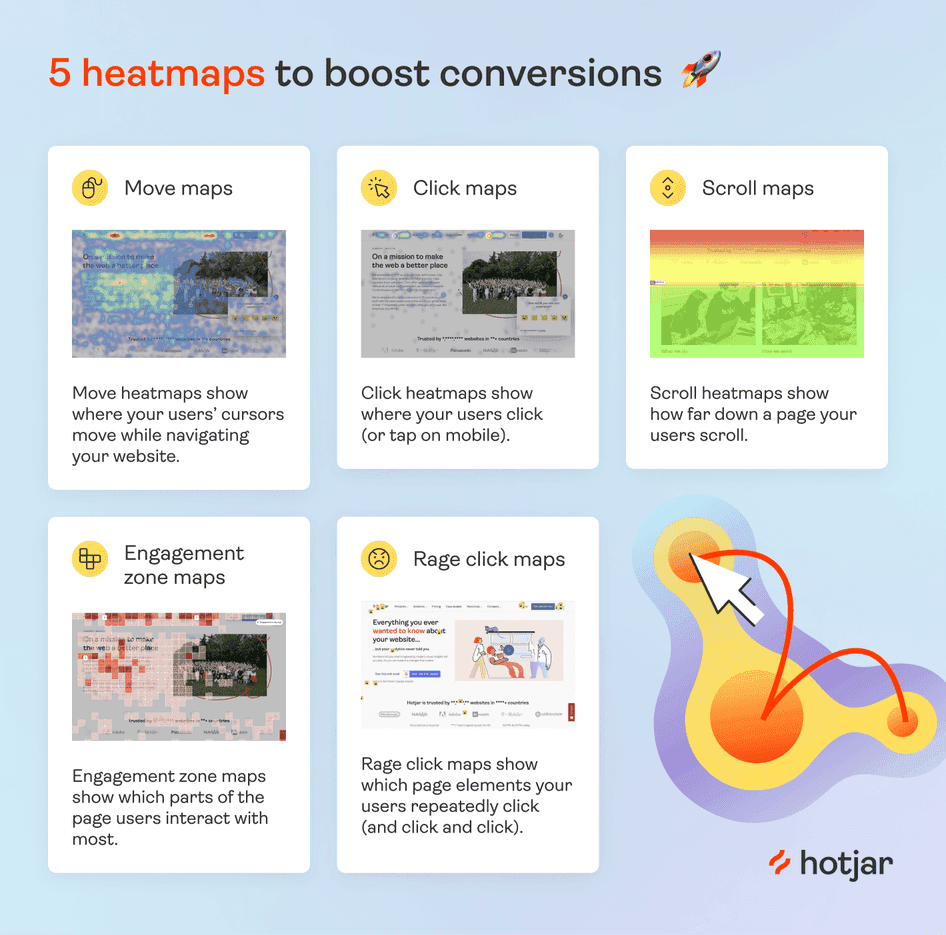
This paints the full picture of user behavior, allowing your team to identify and address key issues while enabling your executives to develop more effective strategies and decisions.
Because everything is in one place, it’s easy to put together my reports and combine the quantitative insights of Funnels and Trends with the qualitative data of Heatmaps, Recordings, and Surveys and weave it all in one narrative.
Generate product reports based on specific goals and target stakeholders
Product managers use reports to keep the most relevant information visible to the right viewers. This way, it’s easier to align the team with product goals, motivate individual members to take ownership, and communicate a product’s impact to execs.
To maximize value, you can create tailored reports for different groups: product teams, sales and marketing, and the executives. Here are three types of reports for specific audiences:
Customer reports for customer-facing teams
Performance reports for individuals and teams
Periodic reports for executives
Check out our mini-guide on how to craft these reports below. 👇
3 product reporting examples and their audience
Share customer reports with customer-facing teams
In a cross-functional team, where different departments come together to achieve product goals, PMs are responsible for keeping everyone on the same page. Part of their job is to build customer reports for customer-facing teams, such as sales, marketing, and customer success.
🔥 Hotjar in action
Design a survey that asks open-ended questions to reveal your users’ hidden needs and potential feature requests. Once you nail the most urgent request, share the information with marketing so they can start a campaign for the upcoming launch, or sales so they can create a new pipeline.
Show performance results to your team
Highlight your team’s performance in your project status report. Here, you can compare actual progress against milestones, budgets, and timelines. This allows you to celebrate wins while making room to discuss upcoming tasks and activities.
🔥 Hotjar in action
You don’t need to do all the talking in meetings. Once in a while, gather your team to watch recordings of real users successfully adopting a new feature—it’s called a Hotjar Watch Party. Observe how actual people behave, including the pages or elements they visit before and after giving your recent add-on some love.
The beauty of Recordings is that it also shows you the opposite of good user experience: what people go through before they bounce. Use the insights to identify and address any cause of user frustration.
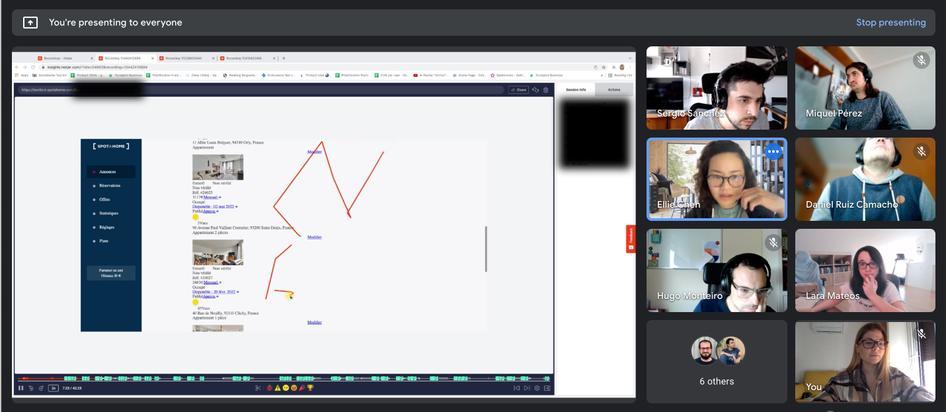
Hotjar customer Spotahome uses Hotjar Watch Parties (like this one from February 2022) to spot bugs and find new insights
Provide high-level insights for executives
Deliver concise, direct updates to executives on the status of various product developments. Craft an executive summary that outlines each project, the teams involved, and their launch timelines.
🔥 Hotjar in action
Use visual data like recordings and heatmaps to show how users interact with your product, including the parts that delight, frustrate, or drive them away altogether. Feedback responses also capture direct user sentiments about new features or updates.
Take it a step further by conducting user interviews through Hotjar Engage. These interviews offer in-depth, qualitative data. When you include excerpts or key findings from these interviews in your report, you provide compelling, firsthand evidence of user experiences and needs.
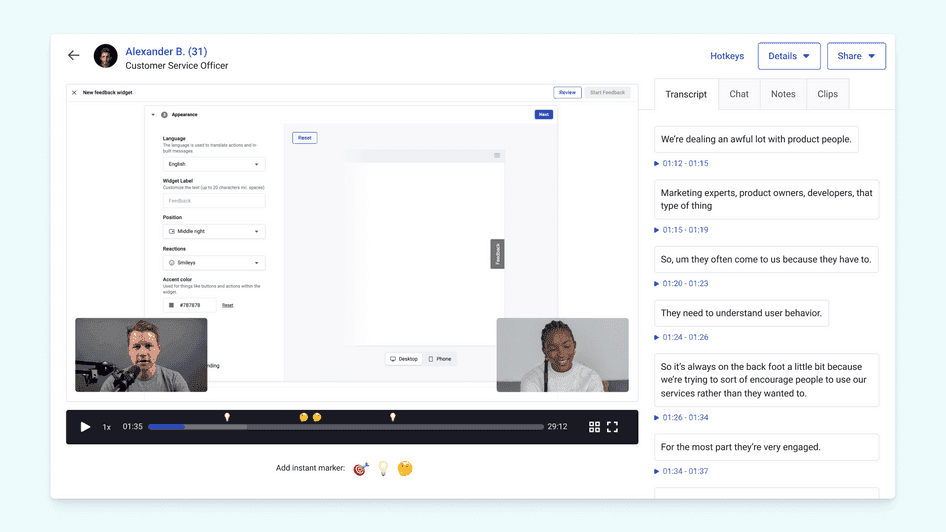
Chart your course to success with clear and impactful product reports
Grow stronger with each captivating product report. Use Hotjar to uncover the valuable insights hidden in your data. Transform these insights into strategies that boost user satisfaction and drive product success.
Are you ready to raise the anchor and set sail? With your reports as your guide and Hotjar lighting the way, you have everything you need to drive your team to inspired action and fantastic results.
Power your product reporting with Hotjar
Complement performance analytics with product experience insights to enrich your reports. Drive action and make decisions that lead to growth.
