Learn / Guides / Mixpanel glossary
Unlocking your metrics: a comprehensive guide to Mixpanel reports
For many online businesses, success can feel like a moving target. You’re constantly trying to optimize your user experience and align your team on the problems to solve, the desired impact, and the key performance indicators (KPIs) you want to improve—all while measuring and analyzing results.
In this case, what matters most about product analytics tools like Mixpanel is how they help you create an interactive and insightful report in line with your user and business needs.

With every event that happens in your digital product, app, or website, Mixpanel automatically analyzes the data in real time—giving you the power to change what matters most for your users and your bottom line.
In this chapter, we explore Mixpanel's reporting capabilities and show you how to create reports in the platform to get deeper product and customer insights that help you reach your goals faster.
Use Hotjar insights with Mixpanel reports for more informed decisions
Combine Mixpanel’s product metrics and Hotjar’s user behavior data for a deeper understanding of your customers.

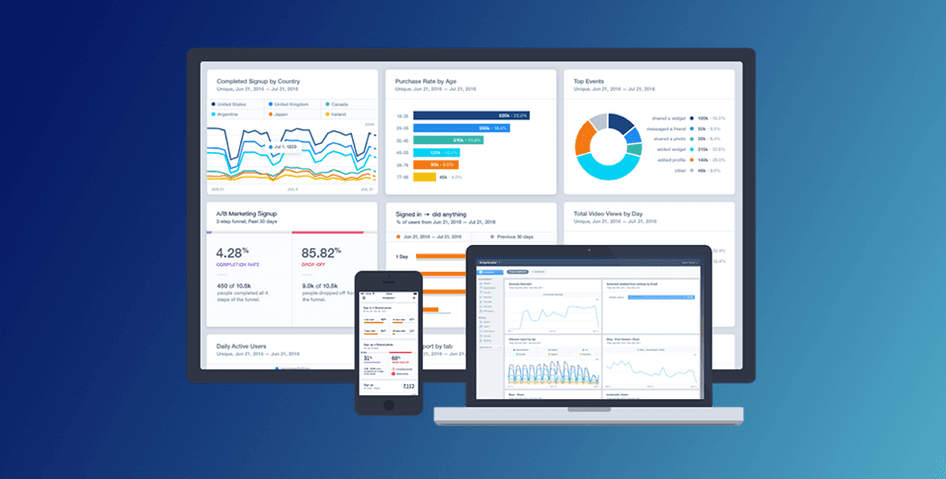
What are Mixpanel reports?
Mixpanel reports are the platform’s interactive features of analysis that let you quickly explore user data and visualize product, app, or website usage.
Mixpanel has several types of reports—like Insights, Funnels, Flows, and Retention. Each serves a distinct purpose and helps you visually organize your metrics and data analytics reports into easy-to-read formats you can effortlessly share with your team and stakeholders.
Why are Mixpanel reports important?
Mixpanel is an intuitive analytics platform that helps you quickly analyze user engagement, conversion, and retention. It lets you measure every step users take toward conversion so you understand how they interact with your business.
This includes events like users filling out a form, viewing content related to a specific topic, or installing an app, as well as in-product behaviors, such as sending messages, applying discount codes, or adding items to their cart.
As a business owner, product manager, or digital marketer, going through all this data manually and extracting key insights is one of your most challenging jobs to be done (JTBD). Mixpanel reports are the platform’s way of making this easier for you.
By breaking down user behavior data into smaller, more specific sections, reports help you dig deeper into how users act across different platforms and time periods, so you can make data-driven decisions.
Specifically, Mixpanel reports allow you to:
Filter and visualize your data in seconds
Access your most important KPIs at a glance
Get valuable insights from your customer journey—from awareness to acquisition through to retention
Optimize budgets based on real-time campaign performance
Quickly share updates with investors and other business partners
💡 Pro tip: build insightful stories around user behavior data by adding context to your metrics.
Mixpanel analytics are great at telling you what’s going on with your customers, but they don’t give you much insight into why.
To get those answers, use a combination of quantitative and qualitative data to fully understand your users and provide a better customer experience. Once you know what your data is telling you, there's no limit to what you can achieve.
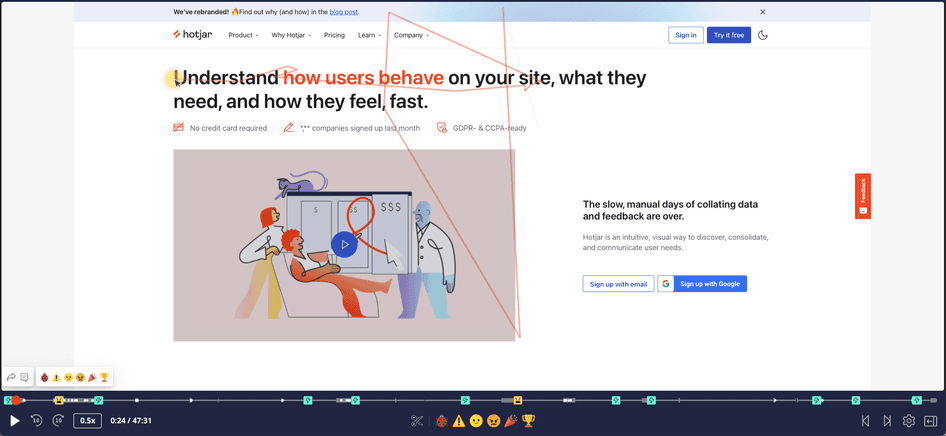
Use digital experience insights software—like Hotjar's Observe, Ask, and Engage tools—alongside Mixpanel reports to capture qualitative data and learn the real motivation behind user behavior:
Heatmaps visually represent where users click, move, and scroll on your site. With this context, you'll learn how users really behave.
Feedback lets users express frustration or delight about individual parts of your site, right down to the page, form, or image they're looking at, with a real-time suggestion box
Surveys bring voice-of-the-customer (VoC) insights to your decision-making. Gathering evidence for a new product or feature? Use a targeted survey to validate your ideas and better understand your users.
Engage helps you automate the recruitment, scheduling, and hosting of moderated user interviews, so you can focus on what matters most—connecting with customers and learning what they expect from you and your business
Include your teams as observers on calls and share time-stamped notes with Hotjar Engage
4 Mixpanel reports to help you measure and analyze user behavior
Exploring each type of Mixpanel report allows you to slice and dice user behavior trends to explore them from all angles.
Here are four types of reports you should create and track in Mixpanel and how each of them helps you reach your specific business and user goals.
1. Insights report
The Mixpanel Insights report lets you explore your data by segmenting and filtering essential Mixpanel data points—like events and user counts.
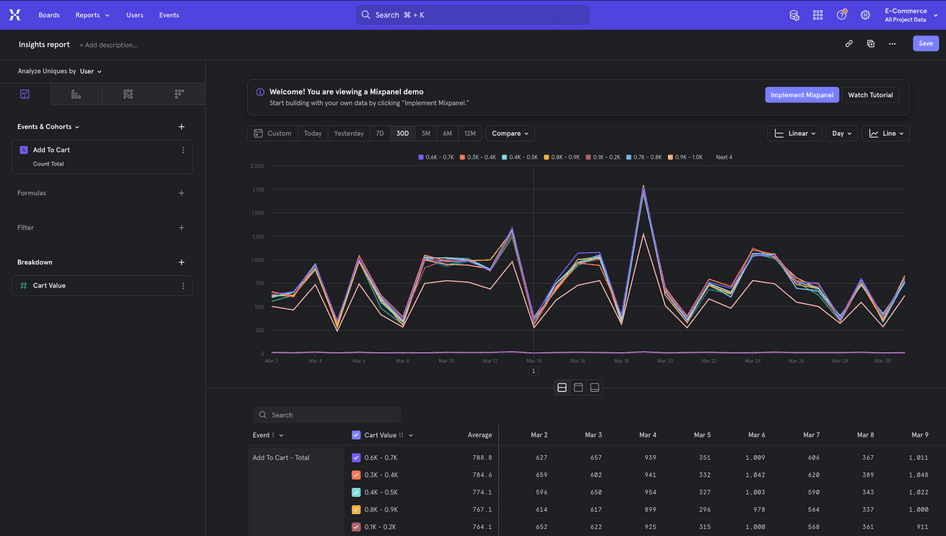
What this report measures
The Insights report tells you how your product, app, or website is being used. This includes showcasing data on how users are finding your business, how popular certain features are, how many users are signing up and adopting your product, where they’re based, how long it takes them to complete a desired action, how much they’re spending, and total revenue.
It helps you learn what people want or expect from your product—and how and when they'll use it—so you can deliver a delightful user experience.
How to use these insights
Mixpanel’s Insights report offers real-time analysis that lets you better understand customer attitudes and behavior to build a more successful business. For example:
2. Retention report
The Mixpanel Retention report assesses your product’s ‘stickiness’ by identifying how many users come to it back over time.
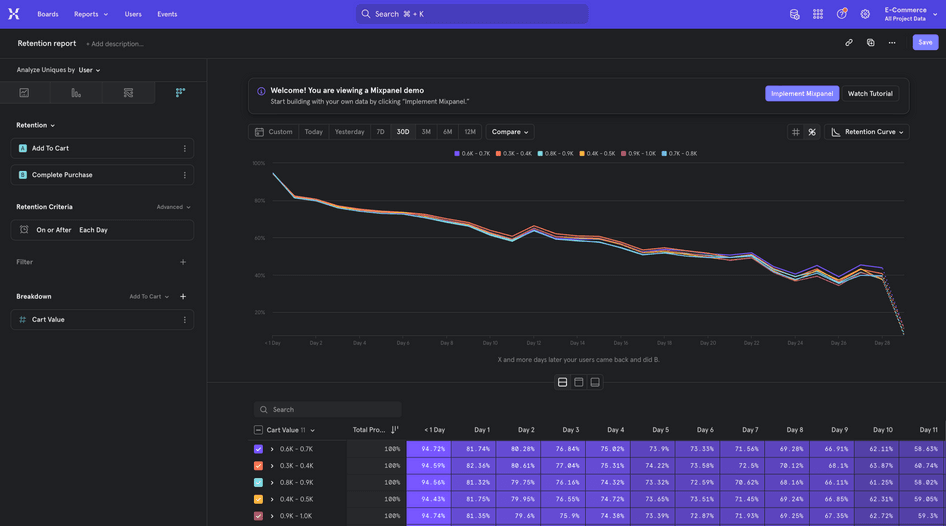
What this report measures
A retention report helps you measure the rate at which your users are re-engaging in specific actions over a fixed period of time, and clearly displays each feature’s ‘stickiness’.
These insights show you the number of users who return (after signing up or making a purchase), what percentage of users are lost (aka customer churn), whether users who perform specific actions are more likely to return, and which channels promote the best retention.
Tracking these metrics helps you get answers to questions like “Which Mixpanel cohorts have the highest retention rate?” and “What are the root causes of attrition of other users?”
How to use these insights
This report helps you track the likelihood of different users revisiting your product so you can analyze their retention over time, enabling you to insert customer incentives and stimuli in the user path that give you an edge in a highly competitive ecommerce market, such as:
Offering discounts
Recommending preferred items
Sending push notifications to boost interaction and consumption
💡 Pro tip: combine Mixpanel with Hotjar to uncover insights about where, how, and why your customers churn.
Traditional metrics like customer retention rate (CRR) and customer lifetime value (CLTV) are good to know, but they don't tell you the whole story of customer churn. To really make a difference in your retention rate, you need to know why customers stop using your product, app, or website—and how you can get them to stick with it.
So, how do you do that? With a combination of traditional analytics data and user behavior insights.
Mixpanel’s quantitative metrics help highlight issues and opportunities, but they're limited: you still don’t know what the user wants. To make customer-centric changes, you need to combine this data with more personal and specific user behavior insights.
For example, use Hotjar Recordings to see individual user actions, so you can uncover specific issues or blockers they experience with your product and understand why they churn.
Session recordings are replays of how individual users interact with and experience your site or product
3. Funnels report
The Mixpanel Funnels report enables you to analyze user actions at each step of the funnel, and the paths they take, to identify when and why users may be dropping off.
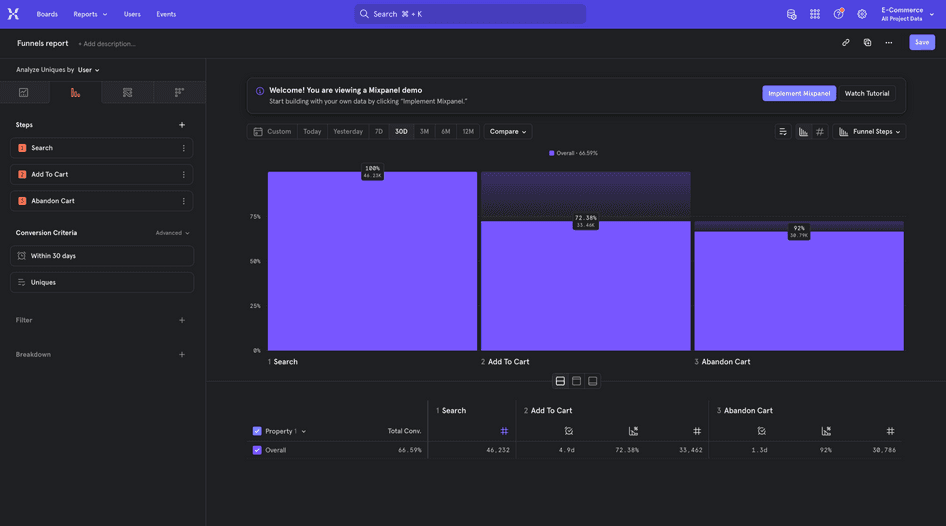
What this report measures
This report helps you understand the conversion and drop-off rates of critical sequences by measuring user progress at each step—from the moment they enter your product until they exit, including button clicks and session duration.
How to use these insights
With more insights on the full user journey—from accessing the website to checkout—teams rely on the Mixpanel Funnels report to understand user behaviors and learn key insights such as:
Which features are popular
Who their power users are
The behaviors tied to long-term retention
This can inform design and UX decisions by helping you zero in on these pain points, so you can work with your team to identify and test ways to reduce friction for your users.
Mixpanel Funnels helps me in my day-to-day, sizing the audience for experiments, evaluating those experiments, understanding the impact of product changes, and getting a better understanding of who our (ideal) customers are.
4. Flows report
The Mixpanel Flows report lets you analyze how users move through your product by exploring paths between key actions.
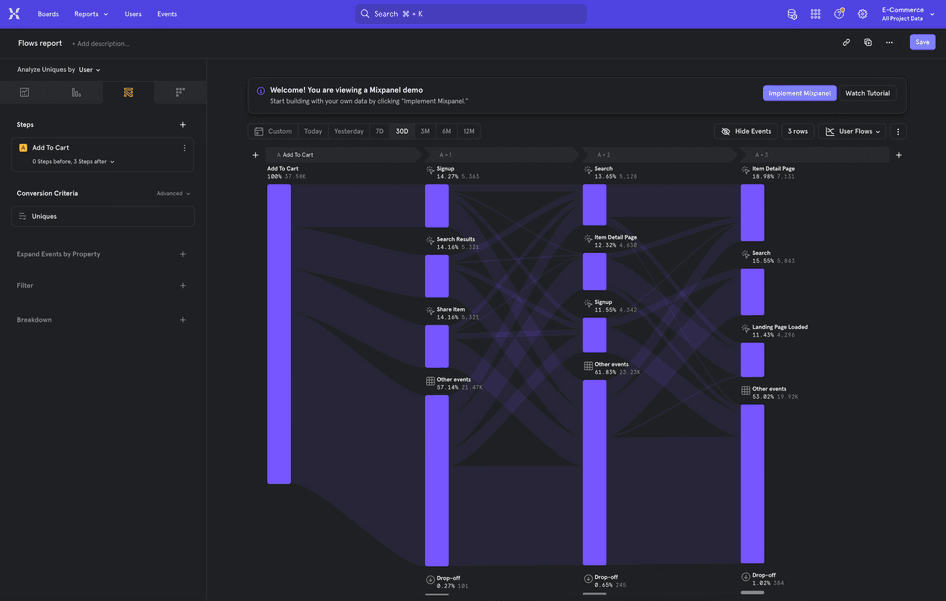
What this report measures
This Mixpanel report allows you to identify the most frequent paths users take from or to any event. It measures how your customers sequentially perform events in your product, which of their behaviors are successful, and where in the process they drop off.
While the Funnels report depends on you to build a path by selecting each step of the funnel manually, the Flows report extracts data directly from your product, app, or website to highlight the existing user flow. Analyzing this flow helps you identify the user path with the highest conversion rates and re-orient product optimization toward the most successful path.
How to use these insights
Use the Mixpanel Flows report to track user activity and understand how different users interact with your product, app, or website. For example, you can:
Next steps to Mixpanel
Tools like Mixpanel simplify the process of collecting, visualizing, and reporting data, allowing product and marketing teams to focus on key user actions and speed up decision-making to meet customer needs.
The Mixpanel reports above help you benchmark and track how well you acquire, convert, and retain customers. But to actually improve your metrics, you need to see (and hear) what’s really causing users to stay—or leave.
Start with Hotjar Recordings to see what your customers see and include Surveys to collect customer feedback. Soon, you’ll have a list of optimizations to turn casual users into long-term fans of your business.
Use Hotjar insights with Mixpanel reports for more informed decisions
Combine Mixpanel’s product metrics and Hotjar’s user behavior data for a deeper understanding of your customers.