Learn / Guides / Intro to Trends
Spotting user behavior trends with Hotjar: why—and how—you should do it
Understanding your users can feel like a never-ending puzzle, especially when you serve multiple audience segments. And if you regularly update your product, you need to know what’s working for them (and what isn’t). It starts with user behavior analysis.

User behavior analysis is the key to understanding your users’ needs, motivations, and preferences. By learning about what your users do—and why—you can find new ways to assist and delight them.
Let’s look at what user behavior analysis is and how Hotjar Trends helps you do it successfully.
Discover what your users need
Use Hotjar Trends to combine Heatmaps, Recordings, and Feedback with your other user data for faster, more accurate insights.

What is user behavior analysis?
User behavior analysis means identifying patterns in what your users do. You can draw conclusions about what users like, what grabs their attention, and what slows them down.
To build an accurate picture of your users, you need a wide range of behavior data, including the kind you gather with Hotjar. And if you can connect qualitative and quantitative data, you can understand both the what and the why of your users’ behavior.
For example, user behavior analysis could involve…
The above examples are simple, but you can potentially run more sophisticated analyses too. For example, with the right data, you could track sales from returning visitors from Switzerland who spend more than five minutes on your site.
User behavior analysis is about more than just looking at raw numbers
Looking at figures like clicks, sales, and conversions is often interesting. But it’s only helpful if you can view those figures in a meaningful context.
For example, making 500 sales a month could be great news… or terrible news. It all depends on which way your figures are trending.
This is where Hotjar Trends can be a game-changer. It lets you create visualizations of data from Hotjar and other tools so you can see patterns over time. And because Trends helps you find the most relevant recordings, feedback, and heatmaps, you can also find the underlying reasons for those patterns.
When it’s time to look more deeply at your data, Trends helps you do it
For product teams, using Trends can help you answer specific questions about your users. Go beyond surface-level observations about clicks or traffic and start getting detailed insights about your audience segments.
“What we love about Trends is watching the recordings behind the numbers to explore why a metric is up or down.”

“Trends helps us connect our metrics with user behavior by analyzing recordings and heatmaps.”

“We use Trends to track conversions and then watch the recordings when they’re down. It helps understand what’s wrong.”

Let’s look at a couple of example scenarios:
1. Launching a new feature for a SaaS
Imagine your SaaS company is launching a feature to make your app more appealing to a new audience segment.
Your product team wants to know if the number of active users from the new segment is growing. But looking at overall usage figures won’t answer that question.
Incorporating data gathered during user onboarding, you use Hotjar User Attributes to identify users from the new audience segment.
Trends lets you visualize how many users from that segment spend over five minutes in the app, month-by-month. With this visualization, you identify that the number of active users from the target segment is growing steadily—nice!
2. Monitoring sales in ecommerce
Imagine your ecommerce business wants to monitor the performance of your website to maximize sales.
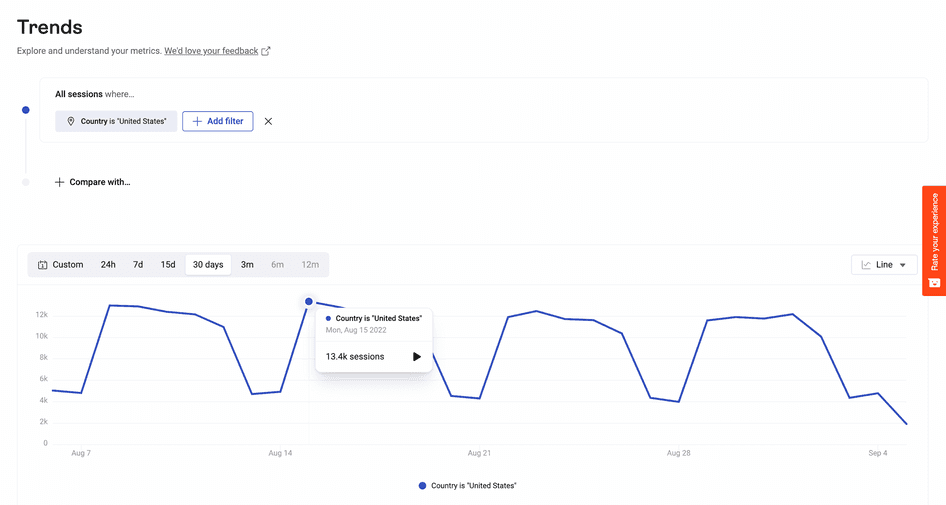
You create a line graph tracking traffic sales and pin it to your Hotjar dashboard. The graph shows recent sales going down and traffic staying roughly the same.
By clicking the relevant part of the graph, you view recordings from the “dip” period. You quickly find a bug stopping users on mobile from completing their purchases.
Why is user behavior analysis worth investing in?
By building a complete picture of your users, you can make better product decisions—the kind that help you reach key business goals, like growing revenue or reducing churn.
Let’s look at some of the ways you can do this with Hotjar Trends.
Find out what’s working (or not) in your product
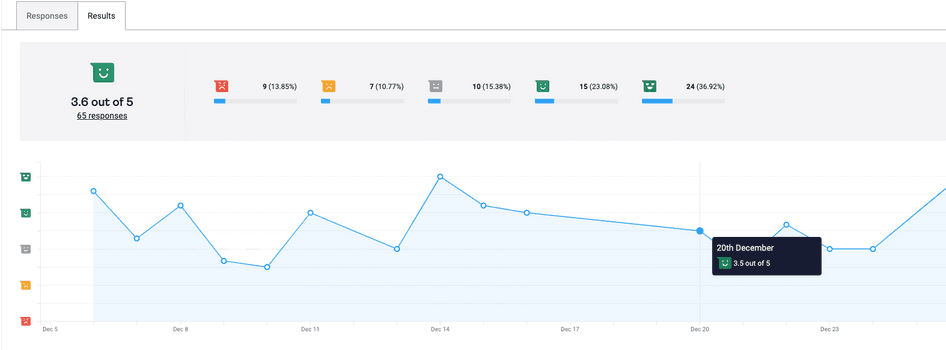
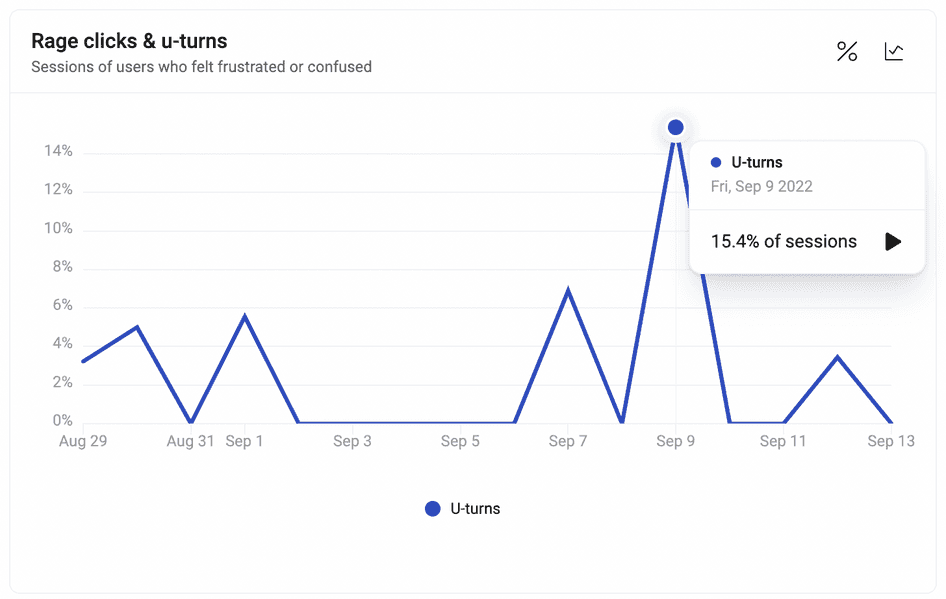
Track how users respond over time. When you launch a product, feature, or marketing campaign, create visualizations to assess the success. You can monitor usage metrics, sales, or frustration indicators like rage clicks.
Understand your data. Compare results from multiple segments or metrics simultaneously. Next, view underlying recordings, feedback, or heatmaps to discover the why behind behavior patterns.
Understand how different segments use your product
Create custom metrics relating to your segments. With User Attributes, you can track custom metrics—like average session duration from users aged 30-35.
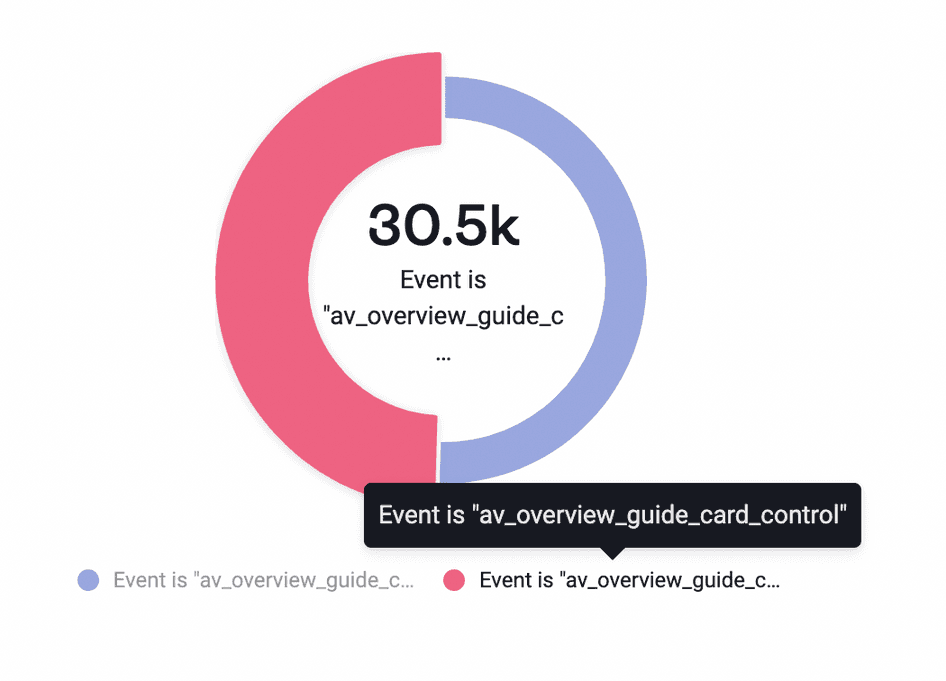
Visualize the data in a helpful way. For instance, create line graphs to see how your metrics change, or pie charts to compare two distinct audience segments.
Look deeper into key patterns. Bring up underlying recordings for a key trend or view relevant feedback to find out what that segment thought of a specific page.
Track campaigns to optimize your results
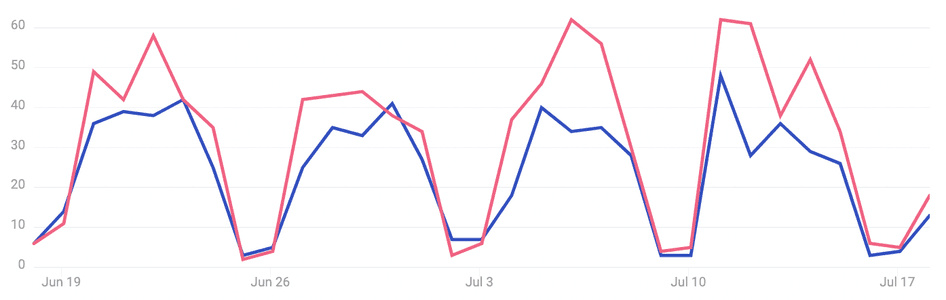
Make meaningful comparisons. Imagine your ecommerce business wants to measure the impact of a loyalty program. You use Trends to monitor average order volume (AOV) from users who joined your loyalty program vs. users who didn’t.
View multiple metrics. In the above example, you might decide that AOV isn’t the only metric that matters. To investigate further, you add the average session duration of the two segments to your visualization. You can now see if users in your loyalty program spend more or stay on the site longer.
Learn more from your A/B tests
A/B tests can show you which variant of a page seems to perform better overall. However, there are often more insights hidden below the surface.
See how each variant performs with different segments. For example, you could compare which variant wins with new vs. returning visitors, or with trial users vs. paid account users.
Discover what made the difference. Trends lets you instantly bring up the heatmaps, recordings, and feedback related to your tests. You can even click on a “spike” in your line chart to see the most relevant recordings.
How does Trends work with Hotjar’s other tools and features?
Trends is more than a visualization tool. Besides Heatmaps, Recordings, and Feedback, other Hotjar features work with Trends to help you find those hidden insights.
Pin key visualizations to your dashboard
Keeping your most important metrics pinned can help you spot significant changes in user behavior.
For example…
A spike in rage clicks could indicate a website bug appearing
An increase in traffic to a product page suggests your marketing campaign is working successfully
A surge in abandoned carts could help you determine that ecommerce customers are dissatisfied with your shipping costs
By having these visualizations handy for regular check-ins, you can keep on top of any major changes. And all without looking at a single spreadsheet!
Track important user actions with Events
Hotjar Events let you use specific user actions—like clicks, unsubscribes, or scrolls—to trigger and filter Hotjar data.
For example, when a user scrolls to the bottom of a page, Hotjar can trigger a feedback widget asking the user what improvements they’d like to see. (In this example, “scroll to the bottom of the page” is the Event.)
You can use Trends to plot graphs of key Events, such as…
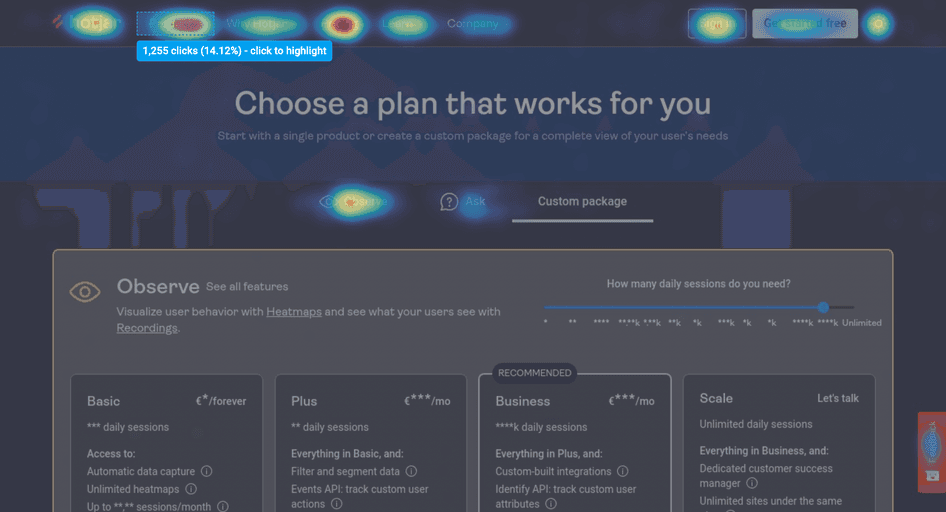
Clicks to your main call-to-action (CTA) button vs. visitors to the page
Number of users clicking your “unsubscribe” button over time
Number of users clicking “support” on mobile vs. desktop
Learn more about your audience segments with User Attributes
Hotjar User Attributes are data points about your users that you import from other systems. This data could include the user’s gender, age, industry, spending activity, and much more.
You can leverage User Attributes to filter your Hotjar data for any segment. For example, your website records the amount that your customers spend. Hotjar can use this data to filter your Recordings, showing you the journeys of customers who spent over $500.
With User Attributes, you can filter your data to segment your audience in countless ways. Next, use segment-specific filters in Trends to spot patterns that are unique to specific audiences.
For example, you can…
Create a line graph showing average order volume from customers in Spain vs. customers in Germany over time
Compare average session length from paid users vs. free trial users
Visualize your A/B test results in a pie chart showing which variant performed better for a specific segment—like users who logged in during the last month
Get deeper, more accurate insights with 100% traffic coverage
While you can still uncover great insights with a sample of user data, you only get guaranteed full traffic coverage on our Observe Scale plan. And with more data covered, you get the chance to find patterns you wouldn’t normally spot.
For example…
Imagine you have a 15% increase in cart abandons during a marketing campaign. Noticing this pattern could help you pinpoint something that’s going wrong—like a faulty coupon code or an issue with your payment system.
With only a sample of your traffic, the full 15% is not captured in your data, so the visualization only shows a small bump. You interpret this as “noise” in the data rather than a real trend.
With full traffic coverage, the increase shows as a noticeable spike in your visualization. You identify that something significant is happening and click to see relevant recordings so you can investigate further.
Full traffic coverage also means having better heatmaps and recordings of entire user journeys, and recordings for every piece of feedback you gather.
Stay on top of user behavior analysis with Trends
Improving your product is a never-ending journey, and so is understanding your users. Like your audience, technologies, markets, and campaigns will always continue to evolve.
Trends is here to shortcut your journey. By visualizing your most important metrics, you can piece together the clues about users’ needs, motivations, and struggles. And by diving into relevant Hotjar data with a click, you can find the insights waiting beneath the surface.
Get user behavior insights faster
With Trends, Hotjar gives you a spreadsheet-free way to spot key patterns in user behavior, from a single platform.