Learn / Guides / A/B testing guide
Top 10 A/B testing metrics to track and measure for successful experiments
A/B testing—a type of split test—lets you unlock your website's full potential and boost conversions by ‘splitting’ the risk of an experiment into two variations, so you can pick your champion before rolling it out to a wider audience.
But analyzing A/B tests is challenging and unproductive if you don’t know what to track and evaluate to make needle-moving decisions.

This guide takes you through the most useful A/B testing metrics for teams conducting A/B tests on websites: specifically marketing, ecommerce, and product teams.
We also dig into A/B testing key performance indicators (KPIs) and offer tips on improving each metric, setting you on the path to success from the moment you hit ‘run’ on your next experiment.
Get the most out of your A/B tests
Go beyond A/B testing metrics. Complement your experiments with Hotjar’s digital experience insights for a comprehensive understanding of user behavior, and create more engaging experiences.

10 A/B testing metrics for websites
The A/B testing metrics you need to track depend on the hypothesis you want to test and your business goals.
For example, an ecommerce website may run an A/B test to decrease cart abandonment, whereas a software company might test various call-to-action (CTA) button variations on a landing page to boost free sign-ups. The metrics or A/B testing KPIs to monitor for both scenarios would differ.
Our list covers the 10 most common A/B testing metrics applicable across diverse industries. Track and evaluate those aligning with your goals to make the most of each experiment.
1. Click-through rate (CTR)
Click-through rate or CTR is the percentage of clicks on a specific link compared to the total number of times the link was shown (also called impressions). This metric helps evaluate the relevance of clickable website elements like CTA buttons and navigation links to your target audience.
How to calculate CTR
CTR = (Clicks / Impressions) x 100
How to improve CTR
While there is no universal way to increase the CTR on a website, the following tips help:
Optimize the visibility and placement of clickable elements like the search bar by placing them in prominent areas, e.g. a web page’s top or side panel
Use persuasive language on CTAs
Make important elements stand out with bold colors or eye-catching images
Improve the product messaging so it entices readers to learn more about your offering
💡 Pro tip: let digital experience insights show you exactly how your users behave to understand why one experiment variant outperformed another. Try a tool like Hotjar Heatmaps to see how people interact with your pages—where they click, move, and scroll—and make improvements based on your findings.
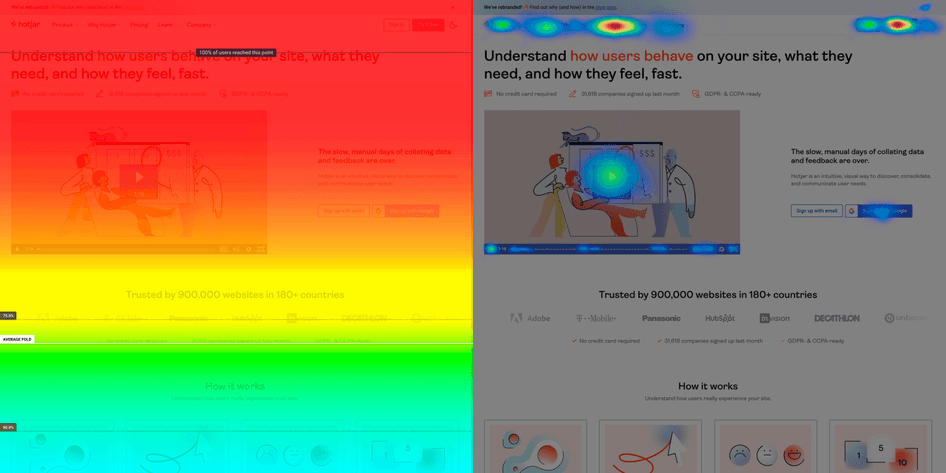
A Hotjar scroll map and click map showing users’ behavior on a web page
2. Bounce rate
Bounce rate represents the percentage of visitors entering your website but quickly leaving without taking additional actions, such as clicking a link. These instances are called single-page sessions.
Bounce rate is a good indicator of visitor interest and reveals website design or content problems, giving you more insight into your experiment control and variant’s effectiveness.
High bounce rates affect your bottom line if your business’s growth depends on users exploring multiple pages before making a buying decision. For instance:
A dentist's website would require just a few landing pages or blogs to attract clients
A software startup's website catering to a global audience might need a comprehensive content library to attract customers via Google Search and educate their audience
How to calculate bounce rate
Website bounce rate = Single-page sessions / Total sessions
You can find this information in traditional analytics tools like Google Analytics.
How to reduce bounce rate
Adjust the messaging and placement of any website copy communicating the value of your website and encouraging visitors to stick around
Improve page load speed so visitors don’t get frustrated and navigate to another website
Enhance the user experience (UX) by improving your website’s navigation
🔥 If you're using Hotjar
Want to make your website more user friendly? Session recordings and A/B testing are a match made in UX heaven.
Use insights from Hotjar Recordings to define and refine your hypotheses, and watch recordings of users navigating and interacting with your A/B test page variations to understand what makes one page perform better than another.
Use these valuable findings to replicate positive results across your site.
3. Conversion rate
Conversion rate is the percentage of users who take a desired action (or convert) on your website. A ‘conversion’ could be clicking on a particular link, signing up for your service, or buying a product. It’s one of the most common—and crucial—metrics for measuring A/B test success.
How to calculate conversion rate
Divide the total number of desired actions taken (conversions) by the total number of website visitors and multiply the outcome by 100.
Conversion rate = (Number of conversions / Total number of visitors) x 100
How to improve conversion rate
Delve deep into your audience's psyche and identify the touchpoints that led them to your website so you can address their pain points in your messaging
Add social proof elements like customer reviews and testimonials to build trust and credibility
Determine triggers preventing users from converting—and persuading others to buy—so you can double down on your highest-converting flows
📝 Note: conversion rate optimization (CRO) depends on many factors, and the points we mentioned above are just the tip of the iceberg. CRO fundamentals are developing a solid understanding of your target audience and showing them why they should buy from you.
4. Scroll depth
Scroll depth measures how far down a web page a user scrolls, revealing a page’s most engaging parts and its drop-off points. Use scroll depth data to make informed decisions on improving user engagement and conversions, such as optimizing content and design elements for an A/B test.
How to calculate scroll depth
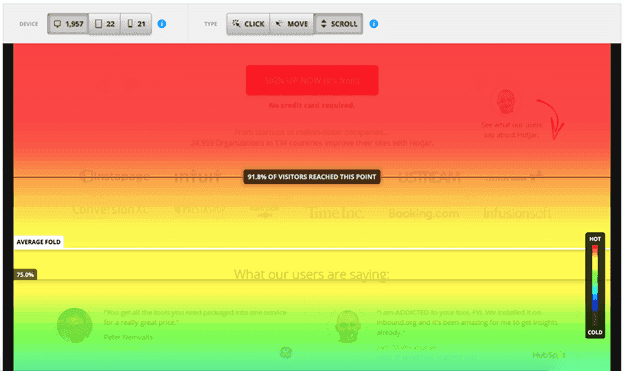
Use Hotjar Heatmaps to generate detailed scroll maps and identify how far users scroll down a web page to discover where you’re losing users’ attention.
Red represents the areas on your page users engage with the most, while blue represents low or no customer interaction.
I've used Hotjar in the past to get heatmaps and recordings of user behavior, which can be super helpful in developing hypotheses for A/B tests and identifying areas for improvement.
For instance, if I see users abandoning a particular web page, I'll use Hotjar to see where they click and how far they scroll. Based on this information, I can create a hypothesis for a new page layout or content variation and test it against the original to see which performs better.
How to improve scroll depth
Make your pages scannable with smart use of headings, formatting, images, and charts
Use a table of contents for longer articles to encourage scrolling
Experiment with design elements like headings, colors, and image placement to see what works best for your audience and drives more engagement
🔥 If you're using Hotjar
Gather user input through surveys or interviews to understand why users drop off, and use that feedback to improve your user interface (UI) and encourage users to stick around longer.
Hotjar Engage enables quick, easy user research through live video interviews. Bring your own testers or tap into our extensive pool of verified participants to find and recruit users matching your target profile.
Use Engage to discover why users stopped scrolling, test hypotheses, and identify usability issues, leading to user-led improvements and better decision-making.
5. Abandonment rate
Abandonment rate refers to the percentage of tasks users start but don't complete—such as leaving a survey midway, or adding an item to an online shopping cart but not purchasing. It’s a popular metric in the ecommerce industry, specifically for calculating cart abandonment rate.
How to calculate abandonment rate
Abandonment rate = (Number of intended tasks completed) / (Number of intended tasks initiated) x 100
How to calculate cart abandonment rate for ecommerce stores
Cart abandonment rate = (Number of carts abandoned / Number of orders initiated) x 100
How to decrease abandonment rate
Simplify UX by reducing checkout steps, limiting the number of form fields, and offering guest checkout options
Use retargeting ads or email reminders to notify users about pending tasks
Use pop-ups triggered by actions—e.g. have visitors confirm their order cancellation if they click the back button from the checkout page
Ask customers what's missing with an exit-intent survey
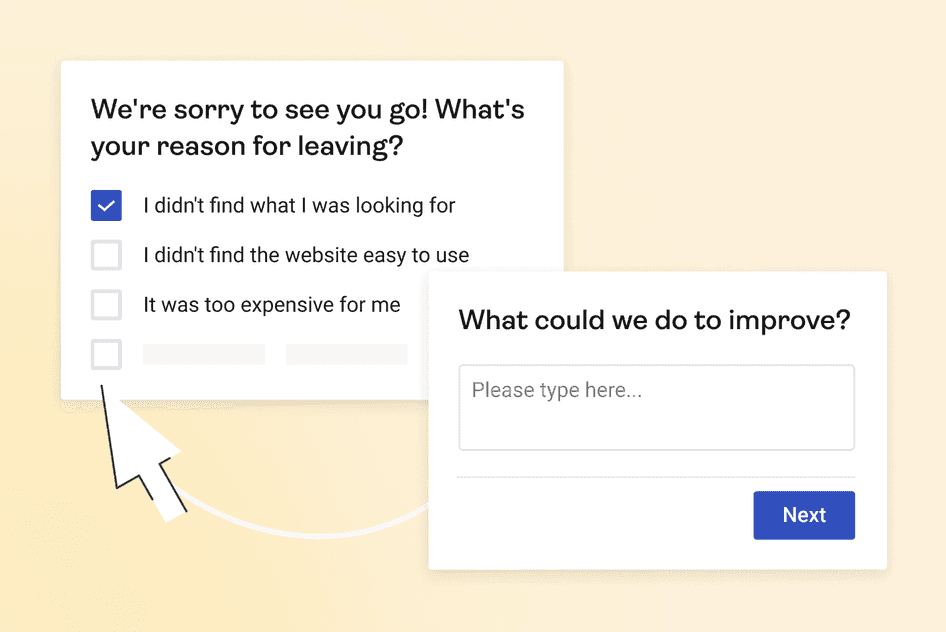
An example of exit-intent survey questions. Create your own survey in minutes with the Hotjar Surveys tool.
6. Retention rate
Retention rate is the percentage of users revisiting a website or specific page after a certain period.
By comparing retention rates between different A/B test variations, you can identify which version encourages users to return and engage more. Use this information to optimize your website for greater customer loyalty and long-term success.
How to calculate retention rate
Retention rate = (Number of users who return to the page or website within a time period / Total number of users who visited the page or website during the same time period) x 100
How to improve retention rate
Personalize the user experience with customized product recommendations or offers based on the user's behavior or preferences
Use retargeting campaigns to target users who have previously visited the website with promotional offers
Improve site performance by ensuring the website loads quickly and is optimized for different devices and browsers
🔥 If you're using Hotjar
A/B testing a new page? Use Hotjar Trends to create a visualization and see if your variations performed better on mobile or desktop. Use these insights to ensure consistent website performance across every device.
To start on the right foot, take our Hotjar Learning course, An Introduction to Trends. 🎓
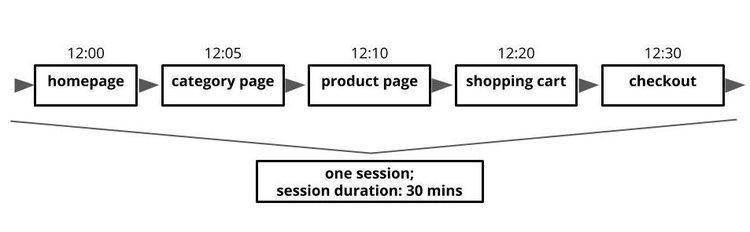
7. Average session duration
Session duration refers to the time a user spends on a website during a single visit. It measures each user’s session from the moment they enter your site until they leave or become inactive.
Longer session durations may indicate users find the website informative or enjoyable, which can positively impact conversions and user satisfaction.
How to calculate average session duration
Divide the total duration of all sessions by the number of sessions on a site over a specified period—in this case, the course of the A/B test.
Average session duration = Total session duration / Total sessions
You can also access session duration data from Google Analytics to find the average.
How to improve average session duration
Understand the customer journey to identify areas where users may drop off and make improvements to keep them engaged
Create a user-friendly interface with intuitive navigation and clear CTAs
Provide excellent content that addresses your target audience's pain points to keep them engaged and encourage them to explore more of your website
💡 Pro tip: watch website session recordings to gain insights into user behavior, identify areas of frustration, and proactively fix bugs. Analyzing real user interactions helps you detect erratic navigation, disregarded links, or usability issues, so you can make the necessary improvements for a seamless user experience—and ultimately increase your average session duration.
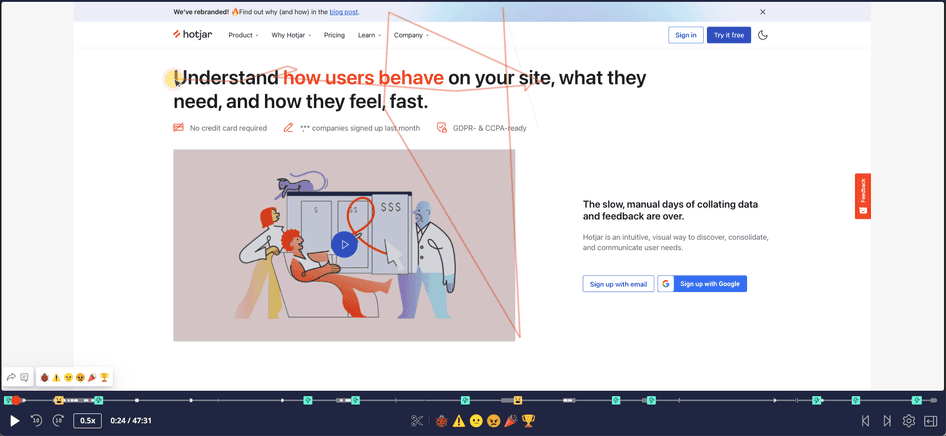
A Hotjar session recording in the wild
8. Average order value (AOV)
Average order value (AOV) is the average amount a customer spends during a single purchase on a website. It's an important metric to evaluate the effectiveness of an A/B test variant, especially for ecommerce brands, because it shows if website changes have positively or negatively impacted the amount customers spend.
For example, if an online clothing store sees an increase in AOV after introducing a ‘buy one, get 50% off on the second item’ offer, it's a sign the promotion successfully encourages customers to spend more.
How to calculate AOV
AOV = Total revenue / Total number of orders
How to improve AOV
Bundle products or offer discounts when customers buy more than one item
Cross-sell and upsell—use product recommendations to suggest complementary or upgraded products to customers during checkout
Encourage customers to spend more by offering free shipping for orders above a certain amount
Create a sense of urgency by offering limited-time discounts or promotions to compel customers to buy more items in a single order
9. Customer satisfaction score (CSAT)
Customer satisfaction score (CSAT) measures customer satisfaction levels with a product or service. It allows you to make strategic decisions to improve website UX.
💡 Pro tip: a similar metric, Net Promoter Score® (NPS®), asks customers how likely they are to recommend your services.
By comparing NPS scores for different A/B test variations, you can determine which one is more likely to lead to positive word-of-mouth referrals.
Use Hotjar’s NPS survey template to start gathering insights from your users.
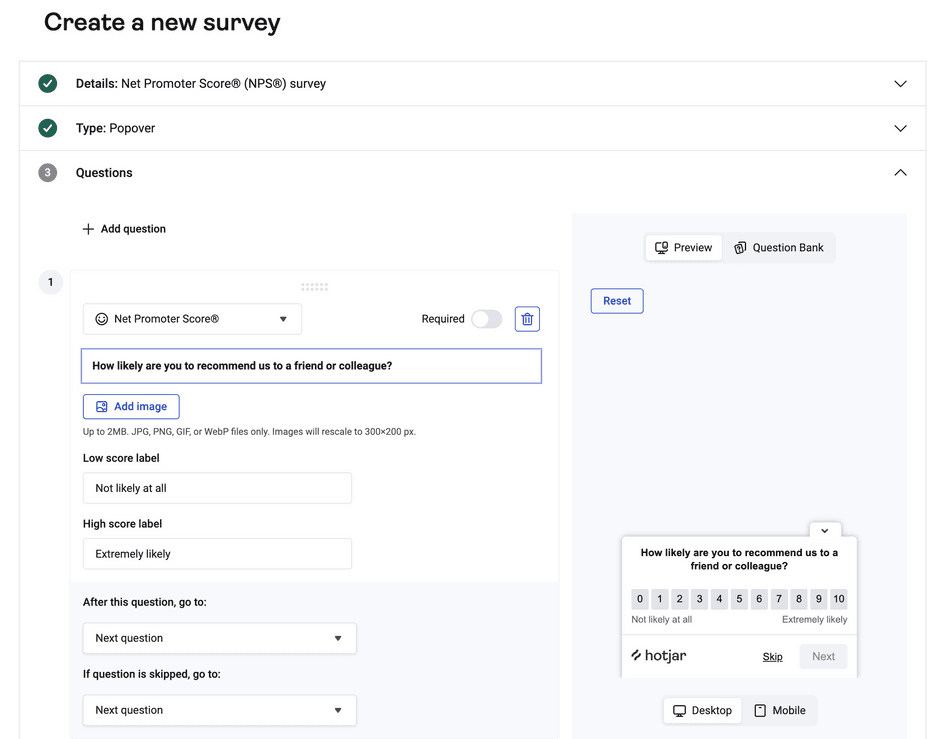
Creating an NPS survey with Hotjar couldn’t be easier
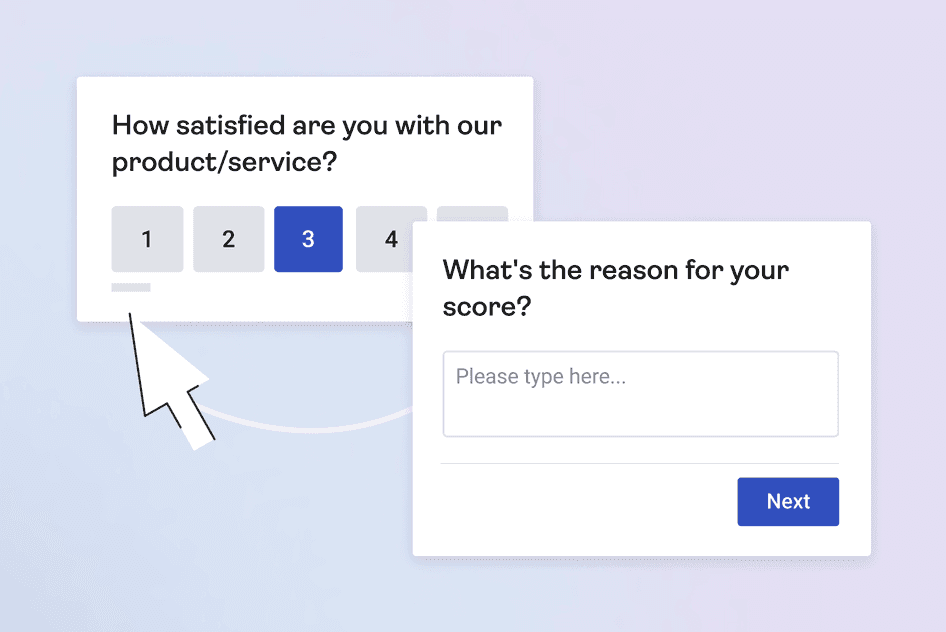
How to calculate CSAT
Using a survey tool like Hotjar Surveys, ask customers a closed-ended question, such as, “Did our product do what you wanted it to do?" on control and variant versions of your A/B test. (Most CSAT surveys use a scale of 1 to 5.)
Then, take the percentage of respondents who answered with 4 or 5 (positive responses) and use that as your CSAT score.
CSAT = (Positive responses / Total responses) / 100
How to improve CSAT
Define business goals and understand the customer journey to identify areas that need improvement
Identify barriers to customer delight by analyzing user feedback
Enforce product experimentation measures for continuous improvement
Offer proactive multi-channel support with live chats, chatbots, and social interaction
10. Revenue
Revenue is the ‘north star’ metric of most A/B tests, measuring your hypothesis’s impact on your bottom line. This metric works in harmony with others like conversion rate, AOV, and abandonment rate.
Focusing on revenue helps you assess whether your adjustments truly benefit your business—or if it's time to experiment with a new A/B testing approach.
Track revenue generated during an A/B test by focusing on sub-metrics like:
Revenue per visitor
Revenue per customer
Lifetime value (LTV)
Conversion value
Revenue per user is particularly useful for testing different pricing strategies or upsell offers. It's not always feasible to directly measure revenue, especially for B2B experimentation, where you don't necessarily know the LTV of a customer for a long time.
How to calculate revenue
During an A/B test, calculate revenue by multiplying the number of orders by the average order value.
Keep in mind: there is no one way to calculate revenue—every business is different.
How to increase revenue
As mentioned, increased revenue is a direct result of the collective performance of key metrics like conversion rate and average order value. Improving these creates a ripple effect, ultimately leading to revenue growth.
We've already discussed how to improve the key metrics for revenue growth. Now, let's explore some high-level strategies to increase revenue during an A/B test:
Enhance product images, descriptions, and layout to create a compelling user experience
Simplify and declutter the checkout process to reduce cart abandonment and increase conversions
Experiment with different pricing structures or discounts to find the sweet spot that maximizes revenue
Personalize customer experience: use targeted content, recommendations, or promotions to appeal to specific user segments and boost sales
2 quick tips for choosing your A/B testing KPIs
Choosing the right KPIs depends on several factors, including your business goals, the project's purpose, and the data you have access to. But these two steps ensure you’ll start your A/B tests strong every time:
First, define your objective, like increasing revenue. In this case, sales or conversion rate metrics matter more than website traffic.
Next, think about the project's specific goals. If you want to make the website better for users, focus on metrics like user engagement, time on page, and bounce rate.
Connecting your goals and project guarantees you consistently choose KPIs that make a real difference.
It's important to consider the availability and reliability of data. Some metrics may be easier to track and measure than others or may be more prone to fluctuations or inaccuracies. It's important to choose metrics that can be consistently tracked and measured over time to ensure the validity of the KPIs.
When to analyze A/B test metrics
Remember: considering your test's unique variables and duration is crucial in deciding when to evaluate results. But, in general, there are a few best practices to follow:
Aim for statistical significance. Wait until you’ve collected enough data to determine whether differences in performance between the original and experimental test variation are not accidental.
Monitor based on the test duration, sample size, and the confidence level you want to achieve about the hypothesis. For example, suppose you want to achieve a 95% confidence level. In that case, you'll need a larger sample size than if you wanted a 70% confidence level.
Refrain from jumping to conclusions by monitoring the metrics too frequently. Analyzing A/B test results is like baking a cake—you can't take it out of the oven too early and expect it to be fully cooked and fluffy.
In general, for a month-long A/B test, weekly analysis is okay. For a week-long test, evaluate the metrics daily.
Typically, you need to get to statistical significance, so a particular threshold you set for the test parameters indicates there's been enough traffic over a given amount of time to start assessing the data. I typically start reporting after two weeks, but it depends on the brand and the site traffic. Then weekly reports are generated and presented to the client or team.
Conduct A/B tests that improve conversions
Effectively analyzing A/B testing metrics is key to optimizing your website for maximum conversions and delivering an exceptional user experience. As long as you focus on metrics and KPIs that align with your business objectives, you’ll make every test a learning experience.
But remember: understanding these metrics is just the beginning. Continuously refine your testing methodology and leverage the power of digital experience insights throughout the process to unlock the full potential of A/B testing and give your users the experience they deserve.
Optimize your A/B tests with Hotjar
Gain deeper insights into your users’ behavior to get the most out of your A/B tests.