Learn / Guides / GA glossary (A-Z)
Tracking and analyzing your bounce rate in Google Analytics 4: a complete guide
Good news, folks: bounce rate is back. If you’re a regular Google Analytics user, you probably noticed its absence from the initial release of Google Analytics 4 (GA4). Now it returns with a different meaning from its Universal Analytics days, connected with a new GA4 metric called engagement rate.

Keep reading as we track the key moments in the evolution of bounce rate, providing an updated definition and tips on how to use bounce rate to discover trends in user behavior on your app or website. We cover:
What is bounce rate in Google Analytics 4?
Historically, the bounce rate Google Analytics referred to was the percentage of single-page sessions or bounces across your site. For instance, landing on a web page and leaving without any interaction, such as clicking on an internal link or navigating to another page, counted as a bounce in UA—it didn’t matter if that single session lasted two seconds or 30 minutes.
In GA4, which replaces UA, we need to understand two new terms to define bounce rate: engagement rate and engaged sessions.
Engagement rate is the percentage of engaged sessions on your site or app. GA4 considers a session ‘engaged’ if it:
Lasts longer than 10 seconds
Triggers a conversion event
Includes a second pageview or screenview
If a session doesn’t match any of the criteria above, it counts as not engaged or bounced. And so, GA4 presents your website bounce rate as the inverse of your website engagement rate, since it’s the percentage of sessions that were not engaged.
Bounce rate is the opposite of engagement rate.
Engagement rate = percentage of engaged sessions
Bounce rate = percentage of non-engaged sessions
How does Google Analytics 4 calculate bounce rate?
To calculate the new bounce rate, subtract your engagement rate from 100%:
Bounce rate = 100% − engagement rate
Let’s say your site or app has a total of 10 sessions, and seven of them were engaged. That’s equivalent to a 70% engagement rate, leaving you with a 30% bounce rate. (We know your total sessions are way higher in real life, but we’ll let the math handle that.)
Investigate your bounce rate
Bounces can leave you guessing why users exit your site: did they find what they needed or encounter a problem on a page? Uncover the whole story behind your bounce rate with Hotjar.

How to view your engagement rate and add your bounce rate to GA4 reports
Finding your engagement rate is easy in GA4. In the left-hand menu, click ‘Reports → Acquisition → User acquisition’. You can then view your ‘Engagement rate’ and other engagement data in the table and change the variables in the first column to your desired filter, e.g. default channel group, medium, source, campaign, and Google Ads ad group name.
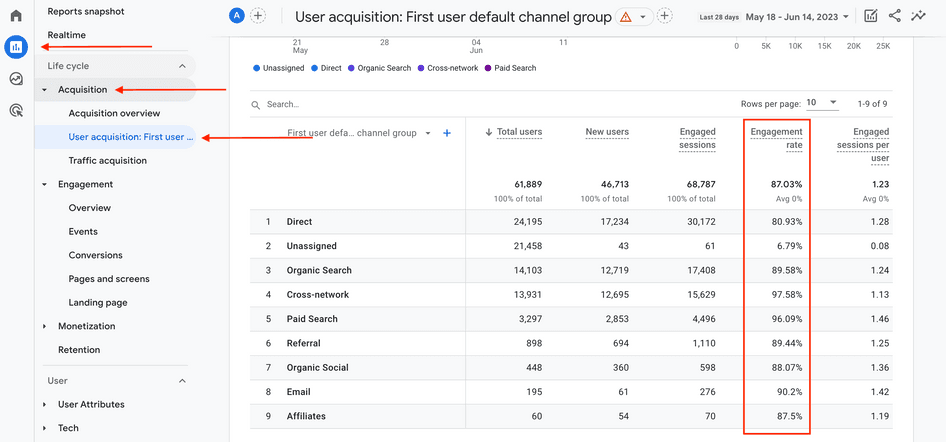
However, seeing your bounce rate in a table like this isn’t 100% user-friendly. Why? It’s displayed as a standalone entity rather than a part of your standard GA4 reports.
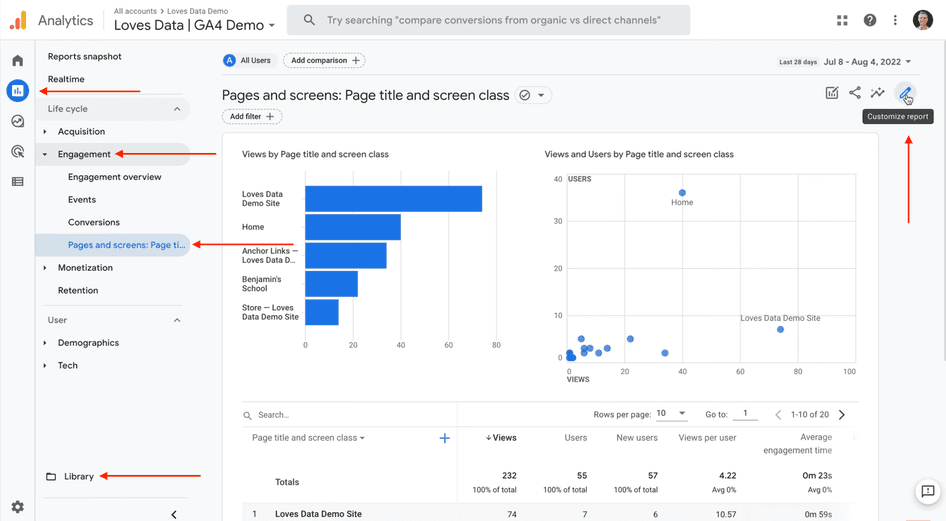
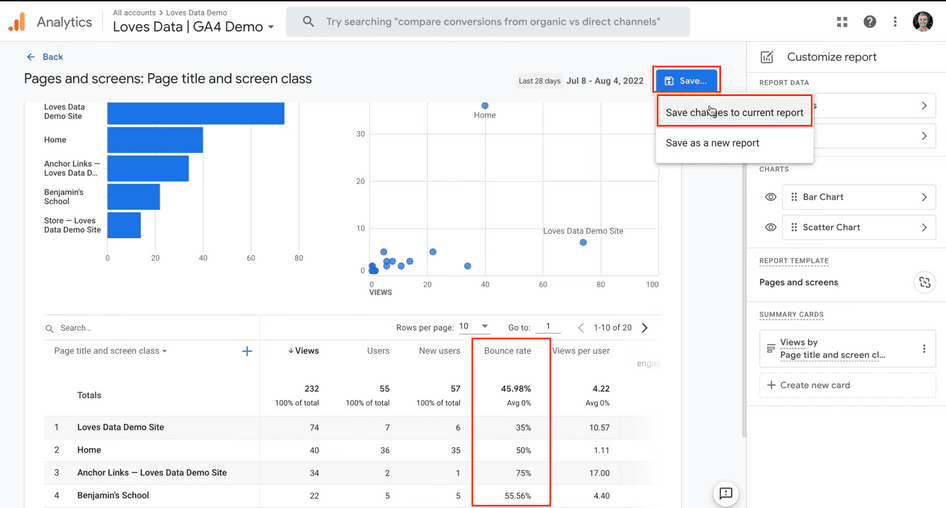
To add this metric to your reports, you need Admin or Editor permission for the Google Analytics 4 property. Choose ‘Engagement → Pages and screens → Library (found at the bottom)’ in the left-hand menu.
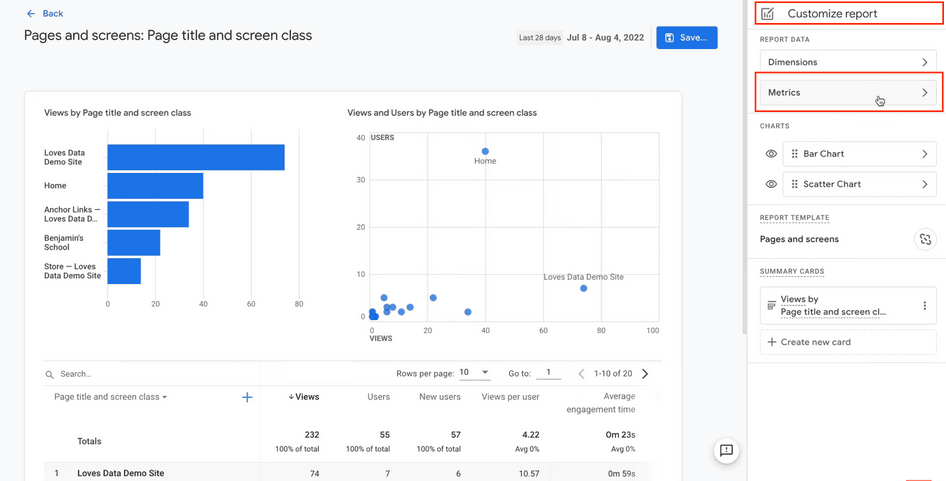
Next, click on the pencil icon at the top-right corner of your screen to customize your report. Select ‘Metrics → Add metric → Bounce rate’.
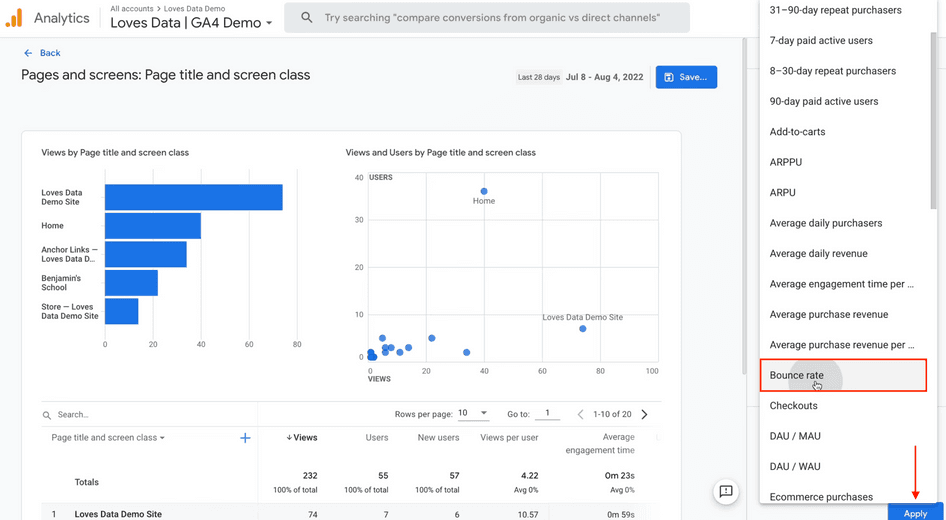
Hit ‘Apply + Save + Save changes to current report’ to see the final ‘Save’ prompt and complete the steps.
💡 Pro tip: another quick way to report bounce rate is to use ‘Explore’ (you can find it below ‘Reports’). Here’s a sample process for creating an exploration for your landing page:
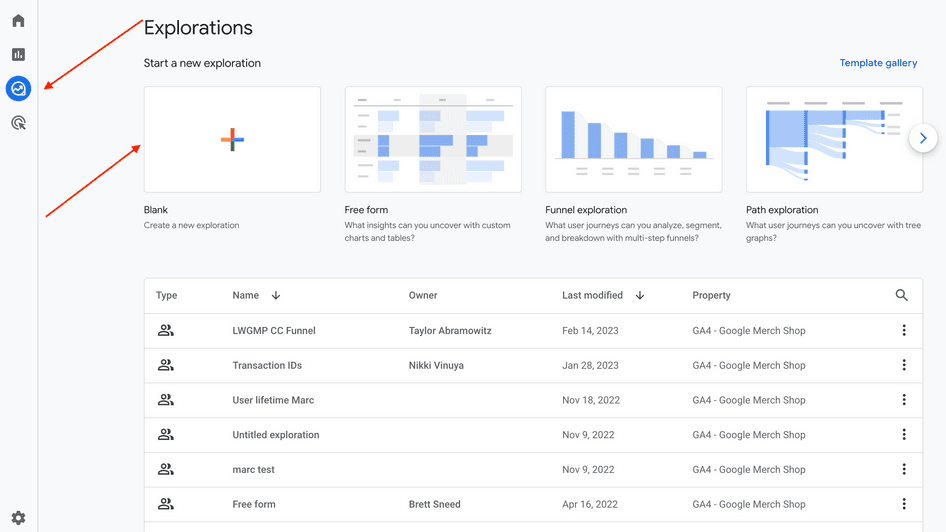
The ‘Explorations’ user interface in GA4
Choose a blank form from the ‘Template gallery’.
Name your exploration, select and enable ‘Landing page’ under ‘Dimensions’, and select and enable ‘Sessions’ and ‘Bounce rate’ under ‘Metrics’.
From the left-hand column, drag and drop the ‘Landing page’ variable to ‘Rows’ in the ‘Tab Settings’ column. Also, drag and drop ‘Sessions’ and ‘Bounce rate’ to ‘Values’.
Why should you measure your website’s bounces in GA4?
From the olden days of Universal Analytics, businesses have used the bounce rate metric to measure and analyze user engagement and understand how visitors use individual pages on a site. GA4 gives you the flexibility to further define what 'engaged'—and conversely, 'non-engaged'—means for your team or company. For example, you could:
Increase your 'engaged session timer' up to 60 seconds if you think 10 seconds isn't enough to get someone to interact with your webpage meaningfully
Identify your conversion event, e.g. visitors subscribing to your newsletter or purchasing from your store, to ensure it's aligned with your business goals
At this point, you're probably wondering: if you can measure engagement directly, why even bother tracking bounces? Good question. Both engagement and bounce rates are basic data you can regularly review to discover potential website problems, make better design and marketing decisions, and optimize the user experience (UX).
Use your best judgment to determine when to look for bounce rate. An example would be checking if a landing page with a high exit rate also has a high bounce rate. An exit rate is the last page people visited before leaving your site, and being an exit page isn't always bad. It is bad, however, when the page in question is a landing page, and users come and go without clicking on a call to action (CTA), moving on to the next page, or spending a significant time on it.
💡 Pro tip: to view the individual pages’ or screens’ engagement data, type the page name—such as /cart, /store, or /pricing—in the search bar above the report table.
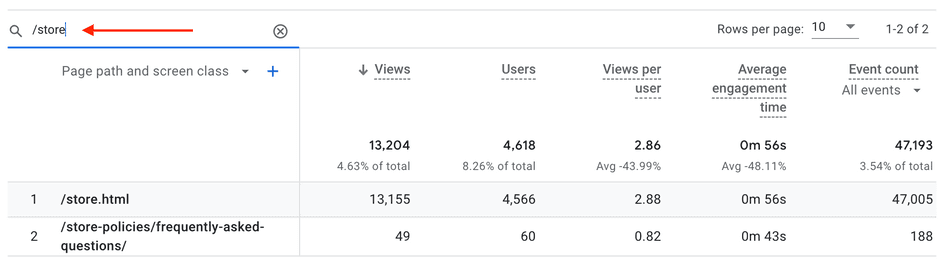
Speaking of pages…
If you notice a high bounce rate for your important pages, like landing pages and product pages, consider asking users directly for their feedback. Set up a widget for a quick snapshot of users' thoughts about these specific pages. (The Hotjar Feedback widget is that little red tag to the right of the page. 👉)
What’s a good bounce rate to aim for?
The average bounce rate for most websites ranges from 26% to 70%, but it varies depending on factors like your industry, traffic source, channels, and content types.
Below are different kinds of websites and their average bounce rates:
Ecommerce and retail: 20% to 45%
Business to business (B2B): 25% to 55%
Lead generation: 30% to 55%
Non-ecommerce content websites: 35% to 60%
Landing pages: 60% to 90%
Dictionaries, portals, and blogs: 65% to 90%
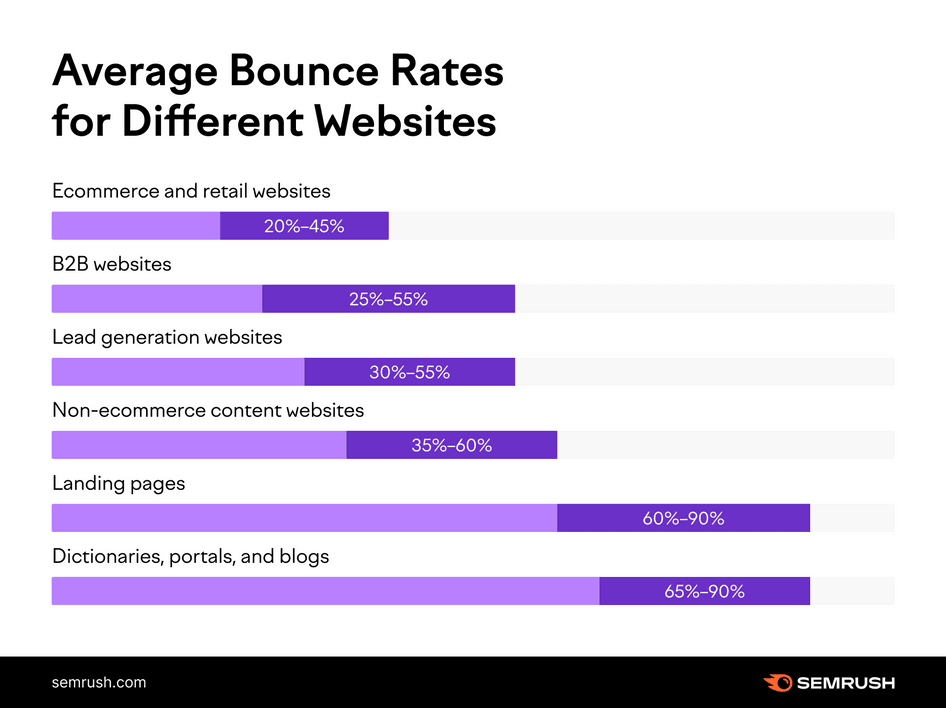
Sample average bounce rates, courtesy of SEMrush
Is a high bounce rate a bad thing?
Not necessarily.
Yes, if: it involves organic search traffic for your homepage, which should generally have a lower bounce rate. A high bounce rate in this area could indicate a design problem, UX issue, or website bugs that need investigating.
In connection with the above, it’s also a big deal for websites whose success depends on users visiting multiple sites. For instance, if users fail to interact once they land on your homepage and therefore bounce, it stops them from going through your sales funnel (e.g. homepage → product page → shopping cart → checkout).
No, if: we’re talking about specific pages and content. News pages and blog posts tend to have a higher bounce rate. People land on these pages, read their content, and leave once they get what they want or need.
It’s the same with a single-page site (e.g. a landing page for a brick-and-mortar shop) or a content type meant for single-page sessions—for example, a directory inviting visitors to exit via outbound links or a contact page directing them to call you on the phone.
When can bounce rate mislead you (and how do you course-correct)?
After discovering a high-bounce page, you might want to drive content or page improvements immediately. But SEO and conversion rate optimization experts would advise you to dig deeper.
Why? Bounce rate barely scratches the surface. If you truly want to know how users interact with specific pages, you should include metrics like pageviews for websites/screenviews for apps, engagement rate, conversion rate, and average engagement time.
Further, consider adding qualitative data, such as real visitors’ behavior, to enhance your insights and validate assumptions before making decisions.
1. Bounce rates meet basic data needs—but provide an incomplete picture
Even in its evolved version, bounce rate tells you users did not complete a desired action or goal on practically all pages of your site. But you still aren’t sure why they didn’t engage.
Suppose an ecommerce site's homepage logs a high bounce rate. The product and marketing teams decide to set the average session timer at 60 seconds, and yet, many customers leave without clicking on a link or progressing to another page. Wouldn't it be best for the teams to know what caused users to drop off—where they lingered and what made them lose interest?
Unfortunately, bounce rates don’t yield answers to these questions beyond assumptions.
💡 Pro tip: while your bounce rate clues you into potential issues, a complementary tool like Hotjar Recordings provides the reason behind a bounce.
A session recording lets you see what happens between the time users enter and leave your site, so you can watch first-hand and see, for example, a customer hovering over your phone number and leaving immediately after (👍) or someone trying to click a broken call-to-action button, giving up, and abandoning your site (👎).
An example of a session recording in Hotjar
2. Bounces in Google Analytics don’t tell you how a page performs
Does your site’s user experience match people’s expectations? Did they leave happy or frustrated? Again, it’s hard to tell just by looking at the numbers, as valuable as they are in finding out that certain pages aren’t as accessible or interesting to visitors as you need them to be.
For example, a 45% bounce rate could mean several things:
Your website or app is slow, causing users to leave before the page loads
The next step isn’t clear, so they can’t find what they’re looking for
Your sign-up form contains too many distractions that hinder people from completing it
💡 Pro tip: making improvements is challenging if we're guessing or assuming what the issues are. Better to seek the users' perspective to establish a solid starting point.
Launching Hotjar Surveys is the best option for teams that may be pressed for time or lack the budget to conduct a focus group discussion. Create from scratch or build on our templates, which come with a handful of helpful survey questions.
Try our exit-intent survey to capture feedback right before visitors leave your site. This template lets you ask multiple-choice and open- and closed-ended questions, such as "What can we do to improve?"—the answers to which you can use while brainstorming a fix.
Learn more about how to make the most of Surveys through this video
3. ‘Bounce rate’ is a metric out of context
Bounce rate informs you about what’s happening on your app or site, and serves as an initial piece of the puzzle. But it lacks the more important piece: the event or behavior leading up to the bounce. Couple this with user perspectives—hearing the reason for a bounce straight from real users.
User behavior analysis exists to help you investigate further. Combine user behavior tools and techniques to fill in the blanks left by GA4 metrics like bounce rate.
Google Analytics 4 meets Hotjar 🤝
Connect the dots between the numbers in GA4 and the actual user behavior captured in Hotjar. Our GA and Hotjar integration enables you to investigate bounces successfully.
Switch seamlessly between Hotjar and Google Analytics to:
Watch recordings of bounced sessions, understand what’s really happening, and uncover opportunities for improvement
Pass Google Analytics 4 events, such as conversions (which signal engagement), to Hotjar and use them to filter recordings data. For example, sort session recordings by ‘engaged’ or ‘non-engaged’ and compare user behavior between them.
Create a Hotjar event for when users exit your site; this triggers Surveys and the Feedback widget to show, allowing you ask them directly for feedback right before they leave
Check out the video below to learn how to implement all this and more and understand the reason your site’s bounce rate is acting up.
Connect quantitative and visual data more effectively with the help of this video tutorial
4 ways to reduce your bounce rate
Since this is a page about bounce rate, we’re wrapping up with a few tips on how you can achieve a low bounce rate or the ideal bounce rate for your website.
This is by no means an exhaustive list. But it contains ideas you can execute while combining data from Google Analytics and user behavior analytics tools.
1. Create a master list of your important pages and analyze their performance
Set up a master spreadsheet with relevant columns, such as page type, page title, bounce rate, engagement rate, and average engaged time. Select the pages you want to analyze and filter the data by date range and sample size.
Track your progress and plan to make targeted changes for each page. Don’t forget to remove irrelevant pages, including those you’ve fully optimized, as time passes.
2. Create original, high-quality content
Let your brand’s messaging shine in your homepage and landing page copy. Craft blog posts on trending topics from a unique angle and ensure they speak to your target audience. Of course, don’t forget to optimize your content for search engines and social media sharing.
3. Enhance your pages and screens using user behavior insights
To lower bounce rates, think beyond the metric and consider the context of each bounce. Behavior analytics tools play a crucial role here, helping you understand the user experience—from their perspective—and optimize accordingly.
Bounces can’t be attributed to anything specific without understanding how users are behaving on your website. Using complementary behavior analytics tools can show you what happens before the bounce, so you can pinpoint what went wrong (if anything) during the user's journey on a page.
4. Make it easy for users to convert on your app or site
Strategically place your CTAs on multiple pages—not just the homepage! Think carefully about where you put them. Increase the visibility of your sign-up buttons by adding them to the header and footer of your select parent pages. For download, pricing, or demo CTAs, try inserting them in breaks inside blog posts or landing page copy.
Now that you know bounce rate’s new definition and limitations, there’s no stopping you from using this metric to your advantage. Remember to complement Google Analytics 4 with user behavior analytics tools to understand how real users experience your site. And enhance your optimization and decision-making process with the best of both worlds: quantitative and qualitative insights.
Investigate your bounce rate
Bounces can leave you guessing as to why users exit your site: did they find what they needed or encounter a problem on a page? Uncover the whole story behind your bounce rate with Hotjar.