Learn / Blog / Article
23 cart abandonment stats you need to know to improve sales in 2024
Are you investing significant effort and budget into your SEO, ads, and overall marketing but seeing no increase in sales? If users fill their carts on your site only to abandon them, much of that investment goes to waste.
But you already know this—that’s why you’re looking for cart abandonment statistics: to benchmark your online store against and determine what you really need to change in your ecommerce buying experience.


The stats we tackle in this guide are about more than the average shopping cart abandonment rate: it’s about how this rate changes over the years and between different industries, countries, devices, and demographics, so you can learn why it happens, the impact of recovering abandoned carts, and focus your efforts on making changes that drive conversions.
Let’s dive into shopping cart abandonment statistics:
Unpack your website’s cart abandonment
Why are your potential customers abandoning their carts? Grab your free Hotjar account to dive into their reasons and recover revenue you thought you lost.

Cart abandonment rate overview
First, let’s take a look at the foundation of cart abandonment: what is the global average, and how has that average changed over the past decade?
1. Almost 70% of shoppers abandon their carts
The average cart abandonment rate is 69.99%, according to Baymard Institute. This is an average of 48 shopping cart abandonment studies, which range from 56% to 81%.
The middle point of just under a 70% cart abandonment rate means that only three out of ten customers who fill their shopping carts actually make it to checkout to complete their purchase.
💡Bonus: Baymard Institute published additional data on Statista indicating a consistent rise in cart abandonment rate since 2014. That year, the average cart abandonment rate was 68.07% and has grown every year since.
Prior to 2014, the average cart abandonment rate changed in an unpredictable manner. Online shopping wasn’t as widely used a decade ago as it is today—ecommerce sales in the US in 2012 amounted to $232 billion, compared to $870 billion in 2021.
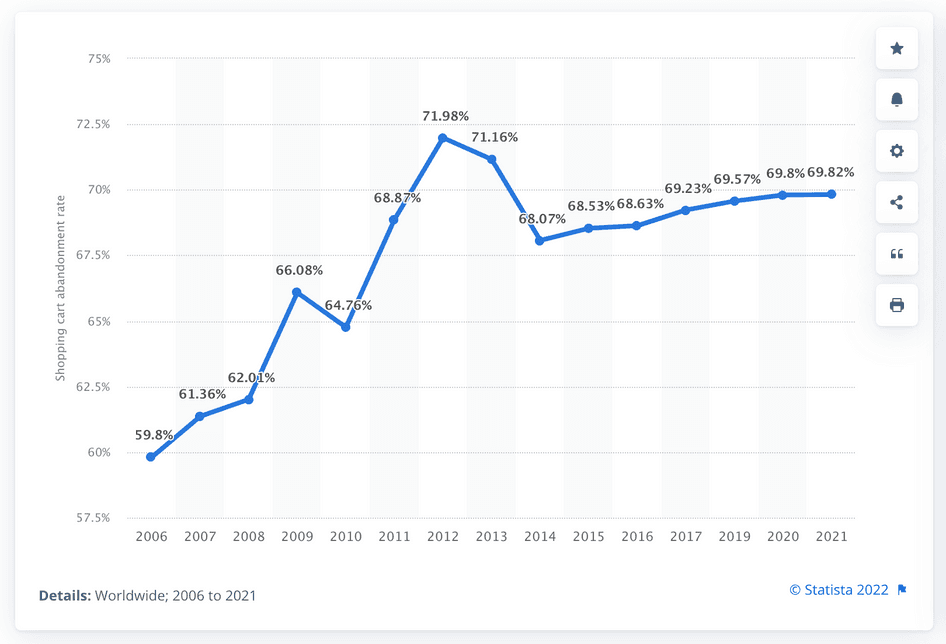
Year-on-year change in average cart abandonment rate. (source)
Cart abandonment rates on different devices
People behave differently when shopping on desktop compared to tablets and mobile devices—and device-specific cart abandonment rates show that. Here’s what you need to know.
2. 73% of customers abandon their carts on desktop
Desktop provides the most comfortable viewing experience for shoppers thanks to the larger screen—but that doesn’t implicitly mean an overall low cart abandonment rate.
Barilliance reports an average cart abandonment rate of 73.07% for desktop ecommerce sessions—the lowest when we compare it to abandoned carts on other devices.
3. On tablets, cart abandonment rate goes up to 80.74%
When users shop on smaller screens, they abandon their carts more—according to Barilliance, over 80% of people abandon their cart on a tablet.
Keep in mind that, according to Kibo, shopping from tablet devices has dropped significantly, and only makes up only around 3% of all online shopping sessions. Be sure to check out your own ecommerce analytics to decide if you should prioritize the user experience (UX) for tablet shoppers, or focus your efforts on other devices if tablets make up only a tiny fraction of your traffic.
4. Mobile cart abandonment rate is the highest of all devices, at 85.65%
Mobile users have the highest cart abandonment rate—with 85.65% of shoppers failing to make it to checkout.
However, unlike traffic from tablet devices, which make up a tiny percentage of ecommerce sessions, mobile traffic accounts for more than two-thirds of all ecommerce sessions—68%. If this is reflected in your own ecommerce traffic breakdown, it’s potentially where much of your revenue is being lost.
Pro tip: use heatmaps to learn what users focus on, ignore, and accidentally miss on desktop, mobile, and tablet.
It’s possible you’re giving your visitors all the information they need to complete their purchase, but they aren’t reaching it. Maybe it’s below the fold—the part of the page not visible without users scrolling down the page—or maybe you think it’s visible on the mobile screen just because it’s well placed on desktop.
Use a tool like Hotjar Heatmaps to find these points of friction and lack of clarity. A heatmap shows you where people click or tap and how far they scroll by aggregating this data in a simple, color-coded image.
Check out how folks at Taskworld, a project management tool, analyzed their signup page heatmap below. They learned that users weren’t clicking on their main call to action (CTA) and were bypassing a mandatory time zone field. With simple fixes, heatmaps helped Taskworld increase its conversion rate by 40%.

The heatmap for Taskworld’s signup page
Cart abandonment rates from different angles
How do cart abandonment rates change according to the type of products in question, the traffic source, location, age, and time of the month and year?
5. The longer customers take to decide, the higher the cart abandonment rate
The highest average cart abandonment happens in sectors like home furnishing (90.50%), automotive (85.97%), and jewelry (84.49%)—unsurprising considering the higher price point and a longer purchase process. That’s also why telecommunications (90.76%) are on the higher end of the cart abandonment rate range, according to SaleCycle.
On the flip side, essentials and items like groceries (50.03%), pharmaceuticals (70.06%), and cosmetics (70.11%) that need frequent replenishing have a lower cart abandonment rate in comparison to other sectors.
6. Social media is the traffic source with the highest cart abandonment rate at 91%
Users who land on ecommerce websites from social media platforms have the highest cart abandonment rate of all sources—91%. That’s possibly because people tend to be in browsing and research mode while scrolling social media—that’s early in their customer journey as they grow more aware of the product you offer, rather than being ready to complete a purchase.
The traffic source with the lowest cart abandonment rate is search (76%), followed by direct traffic—i.e. typing in the website domain directly into the browser (79%), and email (84%).
7. The APAC region tops cart abandonment rate charts at 82%
Compared to regions like EMEA (74%) and the Americas (72%), Asia-Pacific (APAC) leads the way when it comes to region-specific cart abandonment rates.
In the APAC region, there seems to be a greater challenge for online retailers to convert visitors into shoppers. A 2022 report revealed that this is likely due to payment friction—the lack of payment methods APAC customers prefer.
8. Customers aged 25-44 abandon their carts the most
According to ContentSquare, shoppers between the ages of 25 and 34 have the biggest tendency to abandon their cart (21%), with the 35-44 group following right after (20%).
If your target customer belongs to one of these groups, you need to understand what drives these shoppers to leave their carts behind more than other age groups.
Pro tip: lean on user interviews to understand your customers’ buying preferences and habits.
Industries, product types, ages, and lifestyles—they all affect how people approach the shopping experience, including online research and payment preferences. The influences for buying behaviors can be cultural or otherwise invisible if you’re only looking at what customers do on your website and not why they do it.
Use Hotjar Engage to tap into a pool of 175,000+ verified participants for user interviews. Narrow them down by location, age, gender, education, industry, and mobile device to learn what drives their shopping habits and cart abandonments.

Filters for selecting user interview participants in Hotjar Engage
9. Cart abandonments decrease during the last few days of the month
The cart abandonment rate slowly increases between the 7th and 26th of every calendar month, followed by a drop from the 26th. According to SaleCycle, this is due to paydays that start rolling in around that time.
This is why it’s essential to remind customers of the products they left behind—through channels like email marketing—as the end of the month rolls around (more on the success of cart abandonment emails later).
Cart abandonments are quite steady on a month-to-month basis over the course of a year. However, SaleCycle data shows a slight drop toward the end of the year as customers make purchases around holiday time—think Black Friday and Christmas—after researching and comparing prices in their carts.
Causes of cart abandonment
What makes customers abandon their cart after adding products to it? Let’s dive into data from Baymard. These results exclude the ‘just browsing’ replies—in other words, users who are window shopping—to find the real issues behind online cart abandonment.
10. Extra costs lead 48% shoppers to abandon their cart
Almost half of all online shoppers in Baymard’s 2022 study reported that the extra costs were too high for them to complete their purchase. These costs include shipping, tax, and other extra fees, like customs costs, as the leading cause of abandoned carts.
On top of that, 16% of people in Baymard’s study said they bailed because they couldn’t see or calculate the total cost of the order upfront. And some of them may be adding items to determine the additional fees and shipping because they can’t find that information otherwise—and end up leaving the site once they see the total.
Ensure customers feel in control of their buying experience by making details like taxes and shipping costs visible on each product page and throughout your ecommerce site.
11. Having to create an account deters 24% of shoppers from buying
People crave an efficient checkout—that’s why a quarter of those that abandon their carts cite having to create an account as their reason for leaving.
Encouraging users to create accounts makes sense, especially for retailers who want to build a long-term relationship with their customers. But instead of forcing it on users early on, offer your customers a guest checkout option and an easy way to create an account after the purchase.
12. As many as 22% of users abandon carts because delivery takes too long
Shipping plays a big role in converting visitors into customers—on top of issues with costs (see stat #10), there’s also the issue of how long your product takes to get to your customer.
Just like in the extra costs section, this indicates customers don’t have enough information while browsing your website. It should never take shoppers more than a scroll or a click to learn how long their order takes to get to their location. If they only learn at checkout that it’s longer than they hoped it would be, it’s more disappointing than if they’d known it earlier in their shopping journey.
Add delivery details to key touchpoints in your users’ browsing journey, like your homepage and product pages, to exceed your customers’ needs and increase customer satisfaction.
13. 18% of users don’t trust ecom stores with their credit card information
Nearly a fifth of customers don’t complete their purchase because they don’t feel their payment details are safe with the retailer. If this happens on your site, will you be able to win your customers’ trust the next time they visit (if they ever do)?
In some markets, retailers can give customers the option to pay upon receiving their order (also known as cash on delivery, or COD). This can be a solid workaround, but it can also create operational challenges—not to mention it may still not be enough to build trust with those customers.
Instead, ensure your website's design looks professional, and follow a similar color scheme and layout across all your pages. You can also include testimonials of satisfied customers on key pages to forge trust with your website visitors.
14. A complicated checkout process deters 17% of shoppers
Checkout flows with too many form fields, too many steps, or a confusing setup drive almost one in five customers away from their online shopping carts.
After researching checkout design and usability, folks at Baymard found that a checkout flow should be as short as 12-14 form elements (or seven to eight if only counting form fields). But their checkout benchmark database shows that the average checkout flow in the US has 23.48 form elements—leaving plenty of room for improvement.
Improve your shopping cart UX by removing distractions—like newsletter signup links and social media icons—making it easy to edit, reducing the number of form fields, and making the checkout CTA the boldest element on the page.
15. Website errors or crashes lead 13% of shoppers to abandon checkout
Website errors and crashes are tricky because you may not be aware of them for a while—hours or even days. Unless potential customers take the time to flag it with you, you might be out of thousands in revenue before you manage to fix or even notice the issue.
Additional data from Statista shows that almost half of digital shoppers abandon carts because their coupon code doesn’t work, which might be because the code has expired or your website has a bug. But the user won’t know the reason—and if it’s their first time shopping with you, they might lose trust in your messaging, brand, and product.
Pro tip: combine session recordings with page-specific surveys.
Session recordings reveal your users’ scrolls, clicks, taps, navigation, and where they get stuck. This is powerful knowledge because it shows you what your users experience, moment by moment. But you might have hundreds or thousands of recordings at your disposal and not know where to start.
This is where surveys come in. Set them up with filters like specific URLs (like your cart page and checkout page), button clicks, and time on page to ask customers who seem stuck what’s keeping them from completing their checkout.
Then, as you collect answers, you can view session recordings of users that mentioned a particular UX issue or a confusing checkout to better understand their struggle and prioritize the right changes.
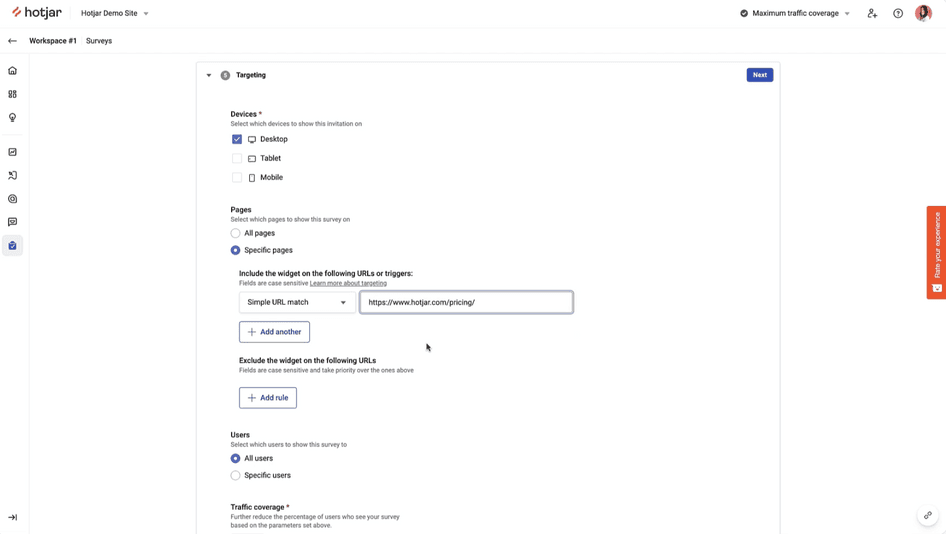
Targeting options for Hotjar Surveys
16. 12% of shoppers abandon carts because they don’t like the return policy
All these statistics reveal a pattern: customers have certain expectations and, once they fill their cart and move toward checkout, those expectations aren’t met.
This is the case with shipping cost, shipping time, and now the returns policy. Customers rely on your website to feel that their money is safe—meaning they want to be able to return your product as easily as possible if they’re not happy.
Use qualitative data, like reviews and responses from customer service questions, to explore how your customers feel about your current return process. If you need more insight, add a survey to your returns page with a straightforward question like, “How do you feel about our current returns process?”
17. For 9% of customers, the variety of payment methods falls short
Around a tenth of customers abandon their carts because online stores didn’t offer them enough payment methods. In other words: they couldn’t find the payment option they wanted to use, or even their second- and third-favorite option.
Credit cards, PayPal, Apple Pay, Google Pay, crypto currencies, and electronic checks are just some of the payment options customers might want. Their preferences can vary drastically between regions and industries, so understanding the market you serve is essential. Run user interviews or location-specific surveys to find out the right payment methods for your customers.
Lost revenue due to cart abandonment
What is the true cost that ecommerce brands experience because of cart abandonment? Some cart abandonment will inevitably happen, but let’s look at real losses and revenue companies can work to recover.
18. Products in abandoned carts add up to $4 trillion per year
Swrve revealed that the products customers leave in their carts are worth around $4 trillion over the span of the year. If you find the number ‘trillion’ hard to fathom, it’s because it equals one million million… In other words, a lot.
Some of those products are from light browsing sessions, yes, but many were a shopping experience gone wrong—and a potential customer left empty-handed.
19. As much as $260 billion worth of revenue lost to cart abandonment is recoverable
You’re leaving buckets of money on the table if your customers struggle at checkout. Optimizing your checkout process is one of the best ways to solve usability issues that lead to cart abandonment—and implementing those improvements could give your ecommerce site up to a 35.26% increase in conversion rate, according to Baymard.
In money terms, this conversion rate increase could help businesses recover up to $260 billion in lost order revenue.
20. 26% of shoppers chose a different retailer after abandoning their carts
Customers who run into an issue while shopping online sometimes return later to complete their purchase. Others go into a physical store to buy the items they wanted. But around a quarter of them do the exact opposite of what you hope they’d do: they buy the items they want from a different online retailer, according to UK-focused data from Statista.
As long as these visitors don’t make their purchase elsewhere, you can still convert them into customers by reminding them of what they left behind (more on that in the next section). But once they hand their cash—and trust—to a competitor, your options to win them back become slim to none.
Cart abandonment recovery
Email marketing is one of the most powerful tools in cart abandonment recovery. What’s its power? What do successful metrics look like in a cart abandonment campaign? Here’s what you need to know.
21. Cart abandonment emails have a 39.07% open rate and a 23.33% click-through rate
Customers love reminders in the form of abandoned cart emails. SaleCycle reports they open almost 40% of those emails, which is particularly impressive when you benchmark it to the average email open rate of 21.33%.
On top of that, the click-through rate—the percentage of people who clicked on at least one link in an email—is 23.33%. With those engagement levels, you’ll see measurable results once you add cart abandonment emails to your conversion strategy.
22. Cart abandonment email campaigns with multiple emails outperform those with a single email
Klaviyo analyzed millions of cart abandonment emails ecommerce businesses sent, and learned that email campaigns with three cart abandonment emails generate the most revenue—$24.9 million compared to $3.8 million for those who only sent one email.
It gets even better: parameters like open rate and click rate don’t drop until email #5 of the campaign. Start an email campaign by sending two or three cart abandonment emails to increase user engagement, and recover some of your lost revenue by converting those users into paying customers.
23. Retargeting ads can reduce cart abandonment by 6.5% and increase online sales by almost 20%
Retargeting ads show potential customers the products they viewed on your site or added to their cart as they browse other websites or social media.
You can start your retargeting efforts by picking a platform like Google Ads or Facebook and implementing a pixel (a snippet of JavaScript code)—this will track abandoned carts and show your ads to the right people.
These ads create huge success for ecommerce stores, with MotoCMS reporting they reduce cart abandonment by 6.5% and increase sales by almost 20%—all by reminding customers of the products they may have forgotten.
Chances are that this is where the mere exposure effect really helps. It’s a psychological phenomenon where people develop a preference for people or things that are more familiar to them than others. Retargeting helps you stay top of mind for potential customers who leave their carts behind.
Unpack your website’s cart abandonment
Why are your potential customers abandoning their carts? Grab your free Hotjar account to dive into their reasons and recover revenue you thought you lost.
FAQs about cart abandonment stats
Related articles

Ecommerce
Unlocking consumers’ industry-specific design expectations
Hotjar’s Coming in Hot Report revealed consumers have different needs, challenges, and expectations for website design based on a brand’s specific industry. Let’s dig into how their preferences vary between ecommerce, healthcare, and financial sites to reveal how these brands can improve their online presence.
Hotjar team

Ecommerce
Customer behavior: how to create a cohesive omnichannel experience in the buying process
The term 'omnichannel' has long surpassed its initial buzzword status to become a cornerstone of modern retail strategy. The consumer landscape has changed dramatically, driven by technological advancements and evolving consumer preferences.
Today's consumers are channel-agnostic and incredibly discerning, often interacting with brands across multiple touchpoints before making a purchase.

Alex Selwitz

Ecommerce
SEO writing: how to create content for Google (and delight your users)
Search engine optimization (SEO) is a popular inbound marketing strategy for good reason. Done well, it works wonders—magnetically drawing users from Google to your website.
But writing for SEO is challenging. Search engines use complex algorithms to sift through billions of pieces of content, selecting a treasured top ten for each query. You have to use a seemingly magic combination of ingredients on your web page for a chance at a high-ranking spot on the list.
Hotjar team