Learn / Guides / Customer analytics guide
How to design an effective customer analytics strategy for your business in 9 steps
A customer analytics strategy helps you adopt a structured approach to understanding your customers. This lets you make data-driven decisions to improve the customer experience and overall satisfaction with your brand and products.

But how do you go about designing a customer analytics plan? Which metrics should you track and how? And, more importantly, how can you make sure the insights you gather translate into changes that benefit your customers?
Taking a strategic approach yields valuable insights you can use to create customer-centric experiences. We’ve put together a comprehensive guide to designing and implementing a customer analytics framework you can adapt to your business.
Let’s get started.
Eliminate guesswork and discover what your customers really want
Hotjar tells you exactly what your customers love—and hate—about your website with its product experience insights.

9 steps to develop and implement a customer analytics plan
Use the following nine steps, which can be adapted to suit your business and unique users, as a guide to create a customer analytics strategy that serves both your needs and helps you understand your customers:
1. Create a strategic customer analytics roadmap
Customer analytics strategies vary from company to company depending on your unique customer journey. Your customer touchpoints depend on the type of product or service you sell and the channels you use to communicate—marketing content, your website, social media, point-of-sale, sales funnels, etc.
Start by mapping the customer journey to see what your key touchpoints are and what data you can extract from each. Aim to collect user insights at every single point that customers interact with your product.
Determine what resources you need in terms of skills, knowledge, and tech tools. What do you already have and what do you need to invest in, hire, or contract out to?
Understand your costs and set a budget for the project
Define timelines, start dates, and deadlines, and get buy-in from management and teams that’ll be involved
Think about how you’ll collaborate and communicate results so they make sense to all team members
There are different ways to collect data and interpret it. Some people like graphs, others prefer statistics. Some prefer numerical data, others prefer qualitative information. The key here is to find a way that works for you—and then keep doing it.
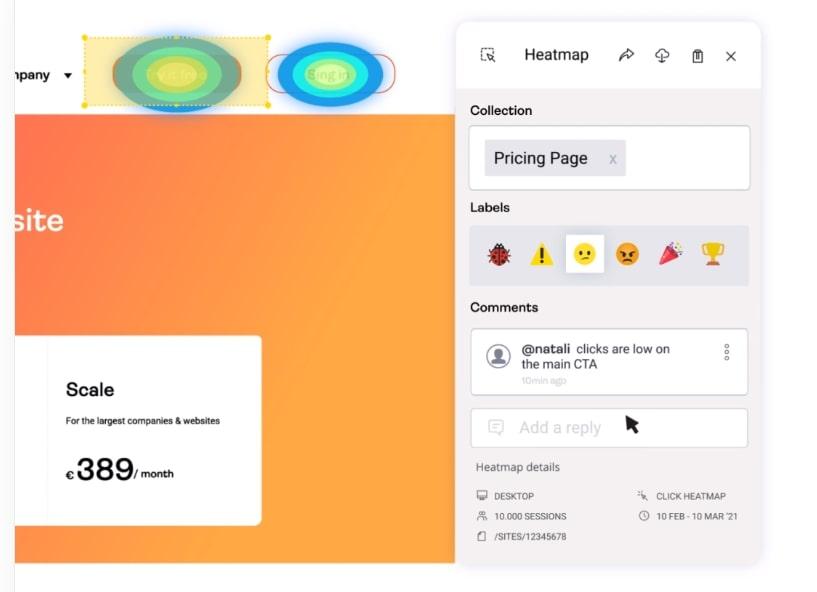
💡Pro tip: use Hotjar's Observe tools—like Session Recordings and Heatmaps—to map the online user journey. See exactly where users land on your website, where they drop off or get blocked, and which parts of your site aren’t attracting the attention they should.
These insights let you make small changes to your site—like moving important information up the page or adjusting the position of CTAs—that result in big improvements for customers and conversions.
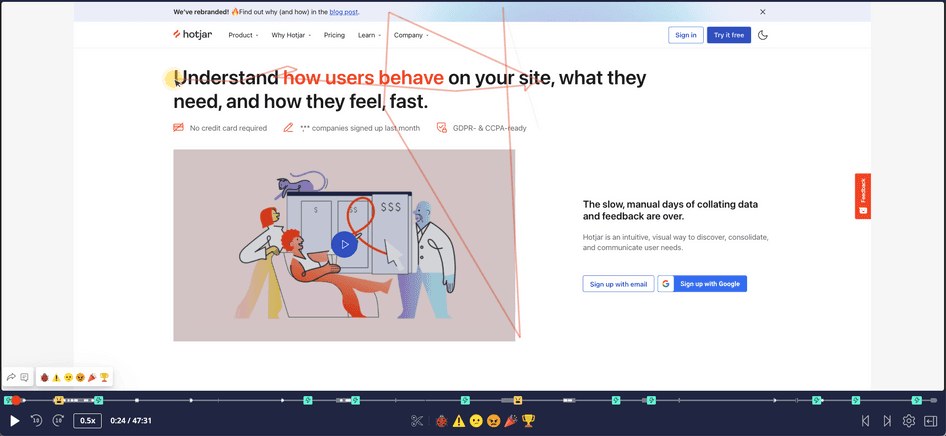
Hotjar Recordings show you how users really experience the customer journey on different devices
2. Define your objectives
Every project needs a specific, measurable goal to work toward. To define your customer analytics objectives, first decide:
What you want to achieve
Who’ll use and benefit from your customer analytics? How will your teams—marketing, sales, product, etc.—act on the insights you gather? And how will that benefit your customers?
How you’ll measure success at each touchpoint
Make sure your objectives tie into your main business strategy and key performance indicators (KPIs). For example, “Improve customer service by 10%,” “Create new revenue streams from new products,” or “Understand our customers’ top 5 jobs to be done by X point in time.” Every goal should contribute to improving the value you offer your customers.
The main objective of a customer analytics strategy is to serve your customers better. It is easy to get lost in a myriad of data, so it’s critical to keep a customer-centric mindset that goes beyond the numbers.
Once you’ve determined your overall objectives, you can
Define your focus areas
Consider:
Which customers you need to look at
How big of a sample size you require for useful insights
Customer buying behavior, habits, channels, and history
How your customers respond to promotions and offers
Next,
Define the questions you want to answer
Ask smart questions designed to discover information that will help you better understand and serve your customers. Sort questions by order of priority and which teams are involved in answering them.
For example, you could ask:
What percentage of customers click on 'read more' buttons, or take advantage of promotions?
Is your business facing problems that you urgently need to address like high cart abandonment rates, disengaged subscribers, etc? How can you find out what’s causing these product and customer issues and address them?
Do you want to focus on attracting a new customer segment based on retail trends? If so, what customer data do you need to support launching targeted marketing campaigns?
3. Decide which metrics you need to track
The customer analytics metrics you track will depend on your user journey design, the data you have available, and the hypothesis you want to test.
For example, if you’re proposing to branch out into servicing the products you sell, or launching a new feature, gather discovery data from existing users that backs up your ideas.
Or maybe you’re a consultancy firm launching a peer-to-peer networking platform and you want to know if it will cannibalize your consultancy services, you need to collect quantitative and qualitative data—aka asking the 'what' and the 'why'.
Quantitative data provides brands...with hard statistics, indicates how customers actually behave, and comes from web analytics, social listening, surveys, call center logs, sales data, and other types of numerical insights.
Qualitative data provides rich, detailed, and often emotionally driven insights on how customers feel and why they do the things they do, and comes from testing sessions, user surveys, interviews, observations, and focus groups.
Once you’ve checked the basic metrics of how many users are clicking on your ads or website, dive deeper into how customers ended up there, what problems they’re trying to solve, and how they feel about their product experience (PX).
For example, if you notice you have a 60% rebound rate from a specific page, you need to find out why. Are you using a term that doesn’t resonate with people? Or a stock image that doesn’t ring true?
Metrics you can track include:
Web analytics data: clicks on paid ads, website traffic, time-on-page, bounce rates, etc, with tools like Google Analytics to understand how your customers research a product and what brought them to your website
On-site activity and product experience insights: use Hotjar (👋) to get a full picture of your customers’ journey on your website and understand how they react to certain pages and products
Product usage and adoption metrics to understand how users engage with your product and whether you need to tweak features or provide more support
Sales and marketing metrics, like email open and click-through rates, newsletter subscriptions, blog page reads, lead magnet downloads, trial sign-ups, demos, conversions, etc.
Registrations and engagement data from online and in-person events
Customer satisfaction/experience surveys:
CSATs ask simple questions that can be answered with a yes or no, or a happy or sad emoji. These tell you what customers think about your site, products, customer support, etc. For example, “Did we solve your issue today?”
Net Promoter Score® (NPS) surveys provide qualitative data on customer loyalty and satisfaction. For example, “On a scale from 0 to 10, how likely are you to recommend this product/company to a friend or colleague?”
Churn rate: how many customers do you lose in a given period?
Cart abandonment rates: high rates can mean customers are struggling to find what they want or that your prices are too high
Purchase history, including repeat purchases: if this is low, you may need to focus on your retention strategy
Social media activity: user comments on your posts or community forums are a goldmine of information about how they experience your brand or product
Interactions with your customer support and success teams: these let you understand customers’ questions and challenges to help you improve your products and support. Also, focus on time-to-resolution to see if you’re solving problems fast enough.
Remember to think about how you can incentivize customers to provide qualitative information. You could offer a discount in return for answering a survey, for example, a shout-out on your social media, or a VIP invite to your product launch.
4. Build your cross-functional team
Deciding which team members you need to involve will depend on your goals and the size of your organization. Aim to have at least one person involved from every team who either interacts with customers or creates key customer touchpoints.
For example:
Sales
Marketing
Product
UX and UI designers
Customer support
Customer success
Devs to integrate your data analytics tools with your website, app, and customer relationship management (CRM) software
Data analysts or engineers to help define your data strategy and clean, analyze, and interpret the analytics
Department heads and executives, like your CFO or CTO, to help align your customer analytics strategy with business objectives, identify use cases, and prioritize actions based on findings
A project manager to coordinate cross-functional collaboration and data collection, deliverables, reporting, and measuring success
5. Invest in the right tools
Your customer analytics tech stack will also vary depending on your user and business needs and data sources. Invest in intuitive, user-friendly tools that integrate well with each other and your CRM to cut down on the time and cost involved in onboarding employees.
Some effective tools to consider include:
Hotjar: easily gather product experience insights as users navigate your website and digital products ‘in the wild’, with zero coding and no need for tech support
Google Analytics or Plausible.io: get an overview of website traffic metrics and identify trends and patterns in user engagement
Google Data Studio: combine data from Google Ads, Analytics, and databases to create no-code data visualizations
Check out our guide to customer analytics software for a full list of tools.
6. Collect and analyze your data
Once you’re all set up, it’s time to put your customer analytics project into action.
It’s easy to get overwhelmed when tracking metrics, so start with quantitative data to get an overview, then go deeper into key areas with qualitative customer data.
Look to identify patterns in your data and translate them into actionable insights you can use to improve the customer experience (CX).
“Qualitative data can—within the right context—be transferred to quantitative data,” says Vaclav Vincalek, founder of 555vCTO: “You can assign a value or category to different levels of qualitative data. As an example, when asking about feelings, you can ask how satisfied they are with the service (options ranging from completely satisfied to completely dissatisfied).”
Pro tip: Hotjar’s non-invasive Feedback widget makes it easy for your users to quickly rate pages or elements on your site to help you figure out how they feel about the product experience and make changes where necessary.
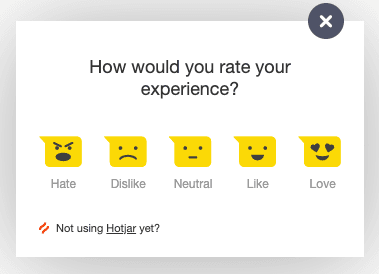
Asking simple, one-click survey questions can help you learn about areas of improvement to focus on
7. Share your insights
Once you’ve extracted customer insights from your data, you can share them with your different stakeholders to get more buy-in for new features or updates.
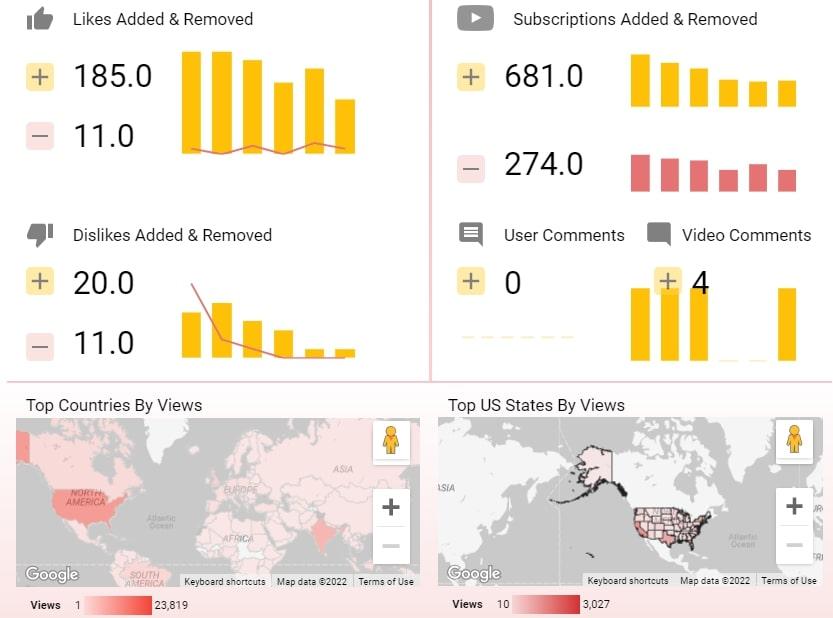
Gather real-time insights wherever possible, and use tools that provide easily digestible data visualizations that you can share with your teams. For example, the Hotjar Dashboard delivers attractive visualizations that you can export to share with your teams.
Hotjar Highlights are a great way to extract and share important snippets of key user behavior or direct quotes from Surveys. Furthermore, integrations with collaboration tools like Slack also make it easy to keep all team members, as well as stakeholders and executives, in the loop.
8. Act on your insights
Next, bring your relevant teams together to work out how you can turn customer and product insights into actions.
This involves:
Identifying action items and areas of high priority based on what will bring the most value to your customers and how you can achieve key business objectives
Agreeing on what can you do right now with the resources you have and what will have to wait
Discussing whether your customer insights revealed by predictive analytics require a change in strategy or direction—to get ahead of new trends, for example
Deciding who is responsible for enacting changes
Once you know all this, you can put together an action plan with clear steps and timelines.
9. Measure success and make improvements
Customer analytics isn’t a set-it-and-forget-it thing, so get feedback from internal teams and your customers to see what’s working and update your processes.
There are two basic measurements of the success of your customer analytics strategy:
Have the changes you implemented at each touchpoint resulted in customer delight?
Has that translated into more revenue or improved ROI? Are more people visiting your site or stores, and are users buying your products?
Revisit your customer analytics strategy regularly and tweak your processes to make them more efficient and effective.
Pro tip: start small. If it’s your first time tracking customer analytics, pick a small-scale, highly focused project that will be relatively easy to carry out. This lets you validate your product ideas to help you get stakeholder buy-in for future changes. Then, use the experience you gained to tackle more complex, broader-scale projects and ambitious goals.
A customer analytics strategy: the secret to creating customer delight
The best customer analytics strategies unite cross-functional teams around a common goal and pull data from all touchpoints along the customer journey. To do this, define your objectives, decide which metrics to track, and determine how you’ll gather, analyze, and report on your customer and product findings.
Then, most importantly, act on those insights to turn potential customers into loyal fans of your product and user experience.
Eliminate guesswork and discover what your customers really want
Hotjar tells you exactly what your customers love—and hate—about your website with its product experience insights.