Learn / Guides / Data analysis for marketers
6 popular data analysis tools for marketers
Marketing data comes in all shapes and sizes, from customer survey responses to ad click-through rates—but there’s little value in collecting any of it if you don’t use it to improve your business.
That’s why you need data analysis software to find (and share) your most impactful marketing insights.

This guide presents six popular data analysis tools that help you collect, combine, visualize, and share marketing data to report on your wins—and find insights that will bring more of them.
Summary
Data analysis tools help you sift through large amounts of marketing data and extract key insights. Use them to report on successes and optimize your website for improved UX, conversions, and revenue. Here are six diverse data analytics tools to try:
Google Sheets: collaborative spreadsheets for combining, analyzing, and visualizing data from any source
Looker Studio: interactive multi-source dashboards for marketing performance reporting
Hotjar: behavior analytics for analyzing quantitative and qualitative user experience data
Google Analytics: event analytics for visualizing website and campaign performance
Lexalytics Spotlight: text analytics to measure and quantify customer sentiment
KNIME Analytics Platform: powerful open-source data manipulation, transformation, and analysis
6 data analysis tools and software for marketing teams
Being marketers ourselves, we know how important it is to have a few trusted tools embedded in our workflow that we can rely on daily. Below, we cover a range of popular tools that perform different types of data collection and analysis. (We’ve also suggested a few alternatives for each to help you investigate further and choose the best options for your business.)
1. Google Sheets
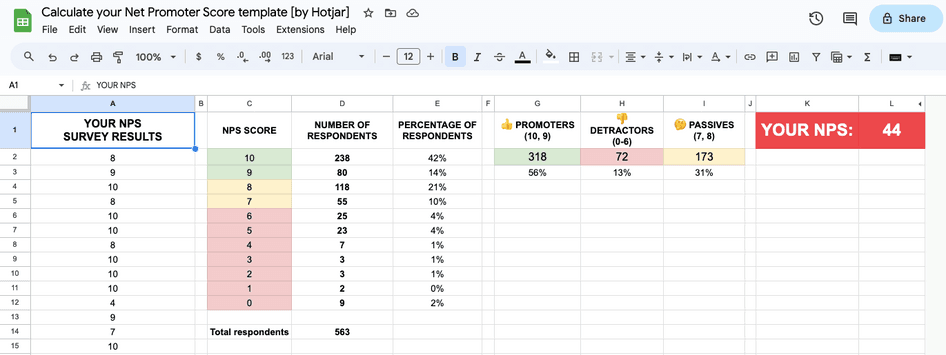
Our free NPS calculator template in Google Sheets
What it is: Google Sheets, as you probably already know, is an online spreadsheet editor for data visualization and analysis. Sheets can be used for free with a personal Google account or as part of Google Workspace alongside other apps like Google Docs, Slides, Meet, and Calendar.
Why marketers use Google Sheets for data analysis: marketing teams—ourselves included—use Google Sheets and similar spreadsheet tools because they’re collaborative, flexible, and pull in data from many sources.
There are also plenty of third-party guides, plugins, and templates to get more functionality from Google Sheets (like our open-ended question analysis template and this social media reporting template from Buffer).
🛠 Use Google Sheets to
Import data from different sources by CSV or data connectors (e.g. Zapier)
Create and share marketing dashboards to track key performance indicators (KPIs)
Visualize data in tables and charts
Create pivot tables to analyze large datasets
🔥 If you’re using Hotjar
Export Recordings, Heatmaps, Surveys, and Feedback data to CSV so you can analyze it in Google Sheets alongside other metrics and data points you’re tracking. Similarly, you can use the Zapier data integration to automatically update any Google Sheet when you receive new survey responses or recordings.
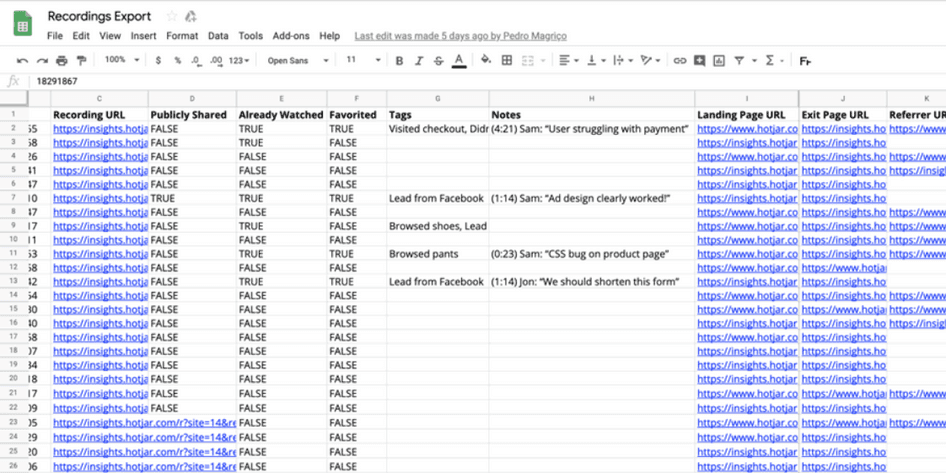
Hotjar Recordings data in Google Sheets
Alternative spreadsheet tools:
2. Looker Studio
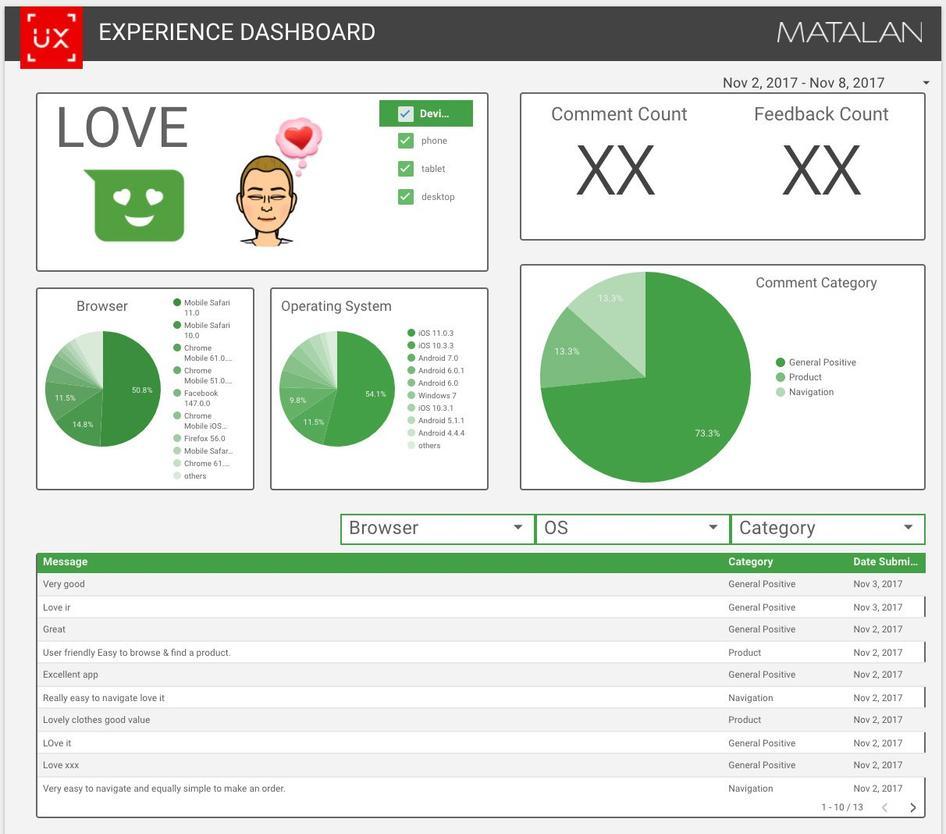
Matalan’s user experience dashboard in Looker Studio pulls data from Hotjar Feedback
What it is: Looker Studio (formerly Google Data Studio) is a free interactive dashboard and data visualization tool.
Why marketers use Looker Studio for data analysis: Looker Studio is popular because, like Google Sheets, it's free to get started with, integrates easily with other Google tools, and provides many free templates and resources—like Looker Studio’s own marketing report gallery.
🛠 Use Looker Studio to
Import data from over 850 different sources, including Google Analytics, Mailchimp, and Facebook Ads
Use templates to create data visualizations like metric funnels, gauges, graphs, and pivot tables
Share reports and dashboards with your team and clients
Alternative data dashboard tools:
DashThis (fun fact: here’s how DashThis used Hotjar to increase customer satisfaction by 140%)
3. Hotjar
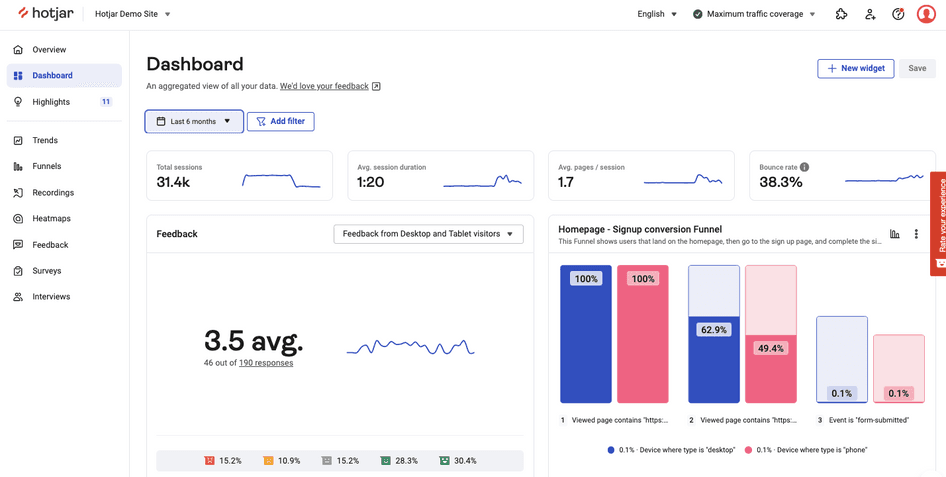
Feedback and Funnels data analyzed in the Hotjar Dashboard
What it is: Hotjar (that’s us, hello! 👋) is a self-service behavior analytics platform that collects, analyzes, and visualizes user browsing behavior and feedback data. Our free-forever plan gives you access to all our tools.
Why marketers use Hotjar for data analysis: Hotjar is used by marketers on over 1.2 million websites to ‘fill in the gaps’ left by traditional analytics tools like GA (see below). It’s free to get started, no technical knowledge is required, and you’ll find in-depth help docs as well as tutorials and guides in the Hotjar Learning space.
Hotjar for me simplifies the process of analytics. Instead of having numbers that explain how people use my website, I have graphic visualizations of it.
🛠 Use Hotjar to
Track and visualize user browsing behavior with Heatmaps, Recordings, and Funnels
Collect user feedback with Surveys, Feedback, and Interviews
Pull in data from other tools like Google Analytics and Optimizely to target and filter behavior data
Generate custom trend reports and visualize website performance in the Hotjar Dashboard
Use AI insights to speed up data analysis, like automated survey reports, recording relevancy scoring, and frustration signal detection
Export data by CSV, API, and integrations
Share digestible reports with team members and stakeholders
(If that sounds like a whole lot to get to grips with, play around with the Hotjar Demo account to see exactly what each feature could do for you.)
Alternative user behavior insight platforms:
Microsoft Clarity (heatmaps and session recordings only)
Analyze customer data with Hotjar
Turn your customer feedback and browsing behavior into actionable marketing insights.

4. Google Analytics (GA4)
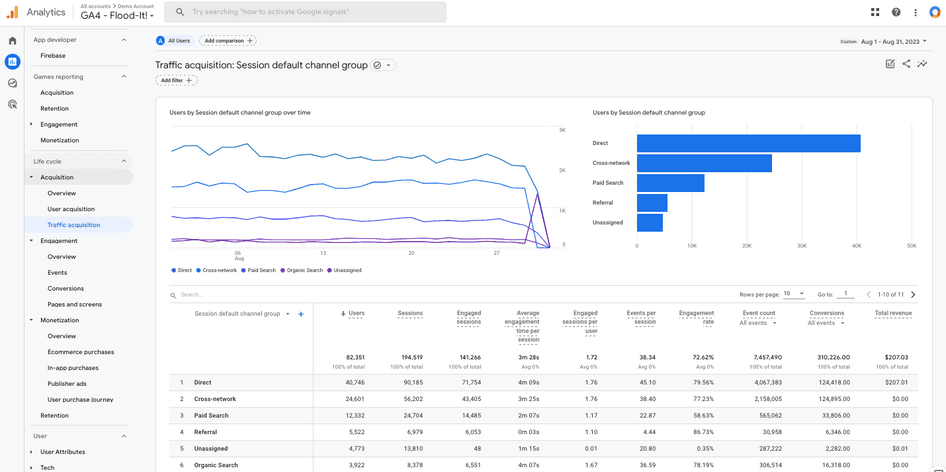
What it is: Google Analytics is a popular web analytics tool for tracking quantitative events like pageviews, purchases, and ad campaign clicks. GA4, the current version, can be used for free with sampling over 10 million events, or as part of Google Analytics 360 (sampling over 1 billion events).
Why marketers use Google Analytics for data analysis: like its predecessor, Universal Analytics (UA), GA4 is popular because it’s free to get started, offers plenty of tutorials for common marketing use-cases, and integrates easily with other marketing services and tools—including Hotjar!
🛠 Use GA to
Track and share website traffic, sales, and ad performance data
Perform quantitative data analysis to generate custom reports
Generate predictive analytics using machine learning, including purchase probability, churn probability, and predicted revenue
View real-time dashboards of traffic and events happening on your website
🔥 If you’re using Hotjar
Use the Google Analytics integration to filter Hotjar data by GA events like ‘GA_started_checkout’ and ‘GA_didnt_complete_order’. Then, view session recordings and heatmaps to find out why users did or didn’t convert.
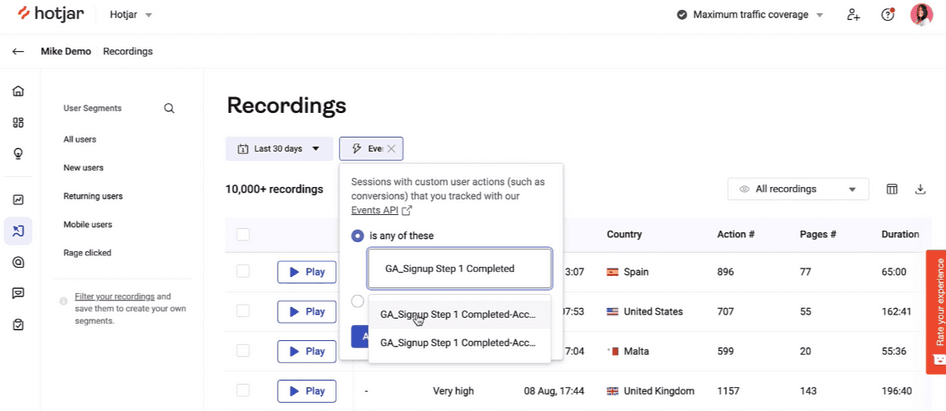
Filtering Hotjar Recordings by GA events
Popular Google Analytics alternatives:
Matomo (formerly Piwik)
5. Lexalytics Spotlight
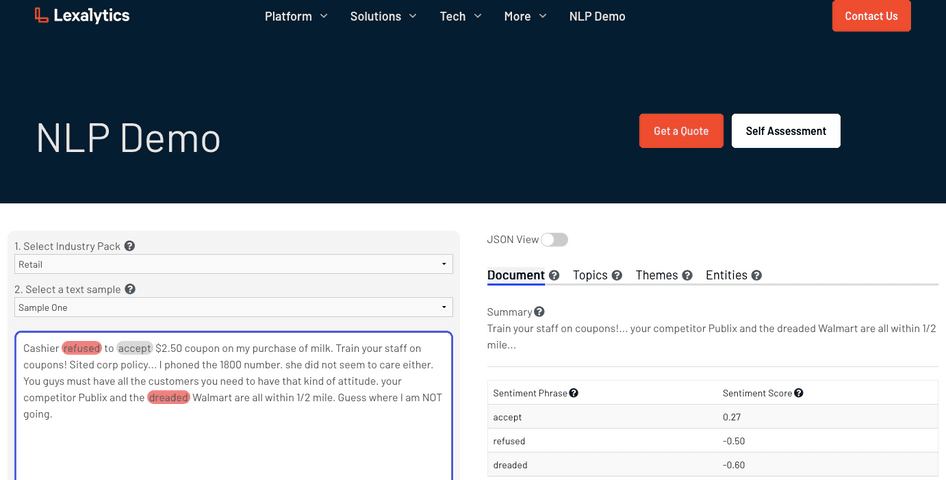
What it is: Lexalytics Spotlight is a premium, web-based qualitative data analysis tool—try Lexalytics’ NLP demo to see what it’s capable of.
Why marketers use Lexalytics Spotlight for data analysis: Lexalytics Spotlight and similar text analysis tools are useful for marketers who need to save time when categorizing and quantifying large volumes of text-based data like customer support chats, social media posts, and product reviews.
🛠 Use Lexalytics Spotlight to
Analyze customer reviews to quantify and monitor overall sentiment
Summarize social media conversations about your product and brand
Quantify voice-of-the-customer (VoC) insights like survey responses
Build and share customer experience and brand reputation dashboards
🔥 If you’re using Hotjar
The Hotjar Surveys tool lets you generate instant survey reports with Hotjar AI and save time manually analyzing individual responses and feedback ratings. Try it out!
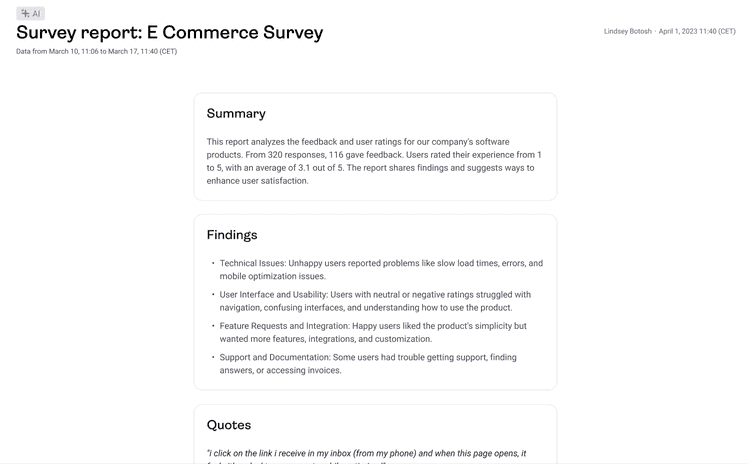
An ecommerce survey report generated by Hotjar AI
Alternative NLP analysis and machine learning tools:
6. KNIME Analytics Platform
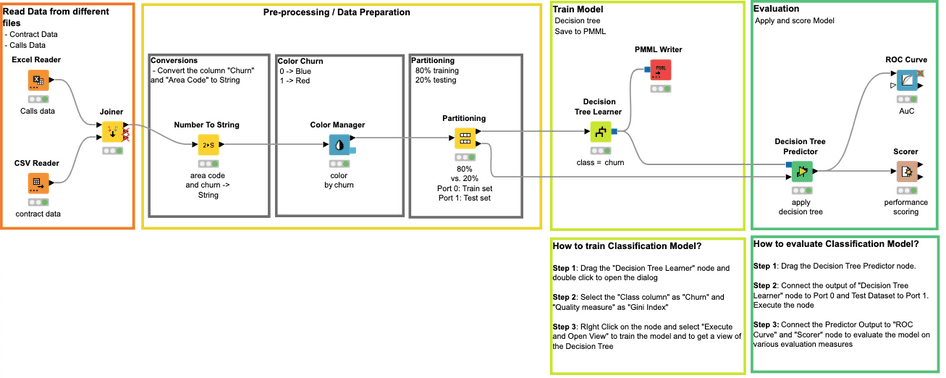
What it is: KNIME Analytics Platform is a free, open-source, low-code analytics and data science platform. Premium plans are also available for the cloud-based, enterprise-level KNIME Business Hub.
Why marketers use KNIME for data analysis: KNIME is popular with marketers and data scientists alike because it's free to use and works with a wide range of data sources. As a bonus, the platform has an active community forum with over 250,000 members, and a community hub with thousands of free workflows to copy.
🛠 Use KNIME to
Build drag-and-drop visual workflows without coding knowledge
Integrate data from over 300 sources, analyze it, and send it to target destinations
Add custom functionality with programming languages like R, Python, and Java
Pull data from databases using SQL queries
Run data-mining tasks to find trends and patterns
Integrate with open-source big data analytics tools like Apache Hadoop and Apache Spark
Share reports and data visualizations with teams and stakeholders
Alternative data management platforms:
Action > analysis
Whatever tools you choose to help you do it, data analysis on its own won’t magically make you outperform competitors or persuade customers to stick around. What will make a difference is putting your insights into action.
And if you start using Hotjar to analyze user data, it’ll be easy to turn your customer feedback and browsing behavior into actionable marketing insights. Give it a try.
Analyze customer data with Hotjar
Turn your customer feedback and browsing behavior into actionable marketing insights.