Learn / Guides / Customer satisfaction guide
9 key metrics to track to improve customer satisfaction
The best way to improve customer satisfaction is by understanding your customers’ wants and needs at every stage of the user journey to optimize their entire product experience (PX).
But it can be hard to know which metrics and key performance indicators (KPIs) will really help you track shifting customer experiences and expectations, and measure the success of your efforts to improve customer satisfaction.

We’ve written a guide on the nine key metrics you need to track to improve customer satisfaction and stay on top of what’s working and what’s not—and continually delight your customers with better products.
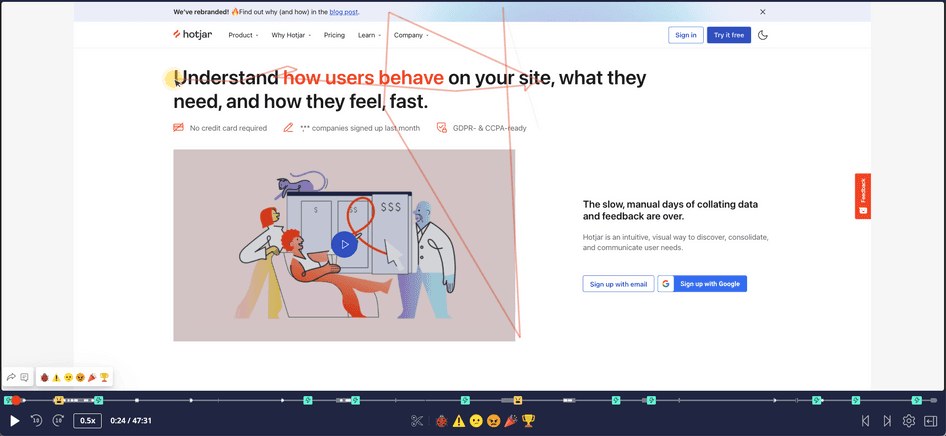
Get more out of your metrics with Hotjar
Use Hotjar's Observe and Ask tools to really understand your customer satisfaction scores—and improve them.

9 key metrics to track to boost customer satisfaction
Below, we’ve listed nine essential metrics businesses need to track to boost customer experience and satisfaction.
Tracking these metrics helps you understand whether you’re delighting customers by analyzing a range of user behavior patterns and trends, as you become alert of drops in customer engagement and satisfaction, and determine if you’ve made the right product or website changes.
1. Referral rate
The number of referrals you get tells you how effective your product is at meeting your customers’ needs and expectations. A high referral rate means customers are willing to vouch for your product as an effective solution to their pain points.
There are different ways to keep track of your referrals. For example:
Web analytics tools: software like Google Analytics tells you how many times your site was accessed through another web page's referral link
Referral code or voucher: issue referral codes to loyal customers to send out to their networks and track how many times their code was used to access your website by a referred-in friend
Calculate your referral rate by taking the number of referred purchases and dividing it by the number of total purchases.
Once you have a clear understanding of your referral rate, you’ll be able to see whether you’re successfully turning customers into brand champions and advocates, which is a good indicator they’re satisfied with your product.
2. Conversion rate
Conversion rate measures how many users completed a desired action on your website, by dividing conversions by the total number of site visitors.
Tracking conversion rate tells you how successful you are at getting users to buy your product or, depending on your objectives, signing up for a trial or service or completing a form.
A low conversion rate means you’re likely not satisfying your customers’ needs and is a strong indicator that you need to make informed website, product, or marketing changes.
Here’s how to track conversions to improve customer satisfaction:
Calculate conversion rate by using the above formula or standard web analytics tools
Next, use product experience insights tools to go deeper and get a granular understanding of your customers’ experience on your site. For example, if you're an ecommerce company, watching Hotjar Recordings on a product page with low performance might reveal that users are rage clicking on a broken ‘add to cart’ link—impacting their ability to convert.
After you've identified the problem with PX insights, take action to remove any blockers in the customer journey and quickly fix bugs to avoid frustration and dissatisfaction during the user experience (UX).
💡Pro tip: combine standard web analytics with Hotjar's Observe and Ask products to discover the ‘why’ behind behavior trends and build a data-informed conversion rate optimization strategy. See where and how users move, and ask them about their customer experience in their own words, for clear insight into increasing conversion and satisfaction.
3. CSAT score
Customer Satisfaction Scores (CSAT) are gathered by asking customers a closed-ended question, like “Did our product meet your expectations?”
CSAT scores help you understand if there’s a sudden drop in customer approval to quickly address your customer satisfaction challenges and improve the user experience.
For example, CSAT scores could show a SaaS product team that customers are dissatisfied with their new product feature because the update takes longer to load and is prone to bugs. By asking customers about their user experience, and responding to spikes in dissatisfaction, teams can quickly roll out better products without negatively impacting customer satisfaction over time.
That’s why, to reach your customer satisfaction goals, dive deeper into why customers are satisfied or dissatisfied with your brand by asking them about their product experience (PX). Use Hotjar Surveys to create and administer effective CSAT surveys to gauge how well you’re meeting customers’ needs and optimize your website or products accordingly.
4. Engagement rate
Engagement rate measures how often users interact with your online brand and website by tracking certain actions—for example, watching a video, reading a blog post, or clicking and scrolling.
Engagement rates tell you how successful you are at captivating your audience with your website, content, and product offering.
Use Google Analytics to calculate your website’s engagement levels. Then go beyond standard analytics to gather qualitative information about why users are or aren’t engaged by visualizing their experience—so you know what product changes to make to keep them happy and meet their needs.
If you're a UX designer, for example, watch Hotjar Session Recordings to see users as they explore your site to help you create a more engaging and intuitive product experience with actionable insights into which web page elements draw customers in, and what isn’t catching their attention.
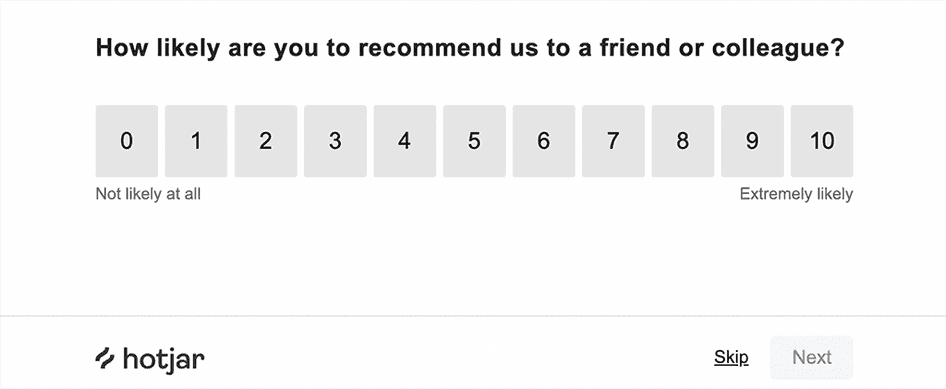
5. NPS® score
Check your Net Promoter Score® by asking customers how likely they are to recommend your product or service on a scale of 0-10.
Your NPS score helps you gauge customer satisfaction over time, understand customer loyalty across segments, and determine your ability to meet customer needs.
Use Hotjar Surveys to create targeted NPS surveys and learn what impacts customer perception of your product to drive effective improvements.
6. Click-through rate
Click-through rate (CTR) tells you how many users are clicking through to your website from an external link found in emails, advertisements, or images—or clicking on internal links within your CTAs, blogs, or other website content.
Tracking CTR helps you understand if you’re successfully driving traffic to your website with your marketing campaigns. Get a strong sense of customer satisfaction by tracking how many conversions you get once users click through and staying on top of your internal click-through rate.
Calculate your click-through rate by taking the number of clicks you get and dividing it by the number of times your content/CTA/advertisement is shown (also known as impressions). Or measure your click-through rate with web analytics tools to see how well your campaigns and content compel users to engage. Track key conversion moments like landing pages, CTAs, advertisements, and blog posts to see how well they’re performing. Then, experiment with your UX design and product positioning to invite more user interest.
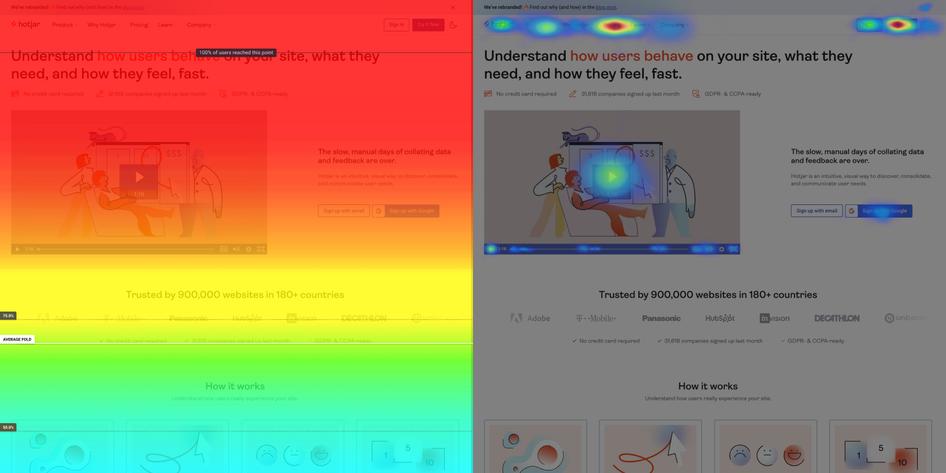
7. Exit rate
The point of exit is where a user exits or drops off your website. Track your exit rates for specific pages by dividing the total number of page exits by the total number of page visits. Tracking point of exit pages gives you valuable information about the customer journey and helps you identify which website touchpoints you should further optimize for your users.
Once you have a sense of your exit rates, analyze Heatmaps to discover unpopular elements of your website that you need to alter or remove completely, as well as popular elements that are capturing your users' special interest.
For example, a marketing team might view heatmaps of key landing pages and see that users aren’t scrolling below the fold and exiting before they reach the CTA. They can then use these insights to inform strategic marketing decisions: like writing more persuasive copy, communicating with UX design to relocate CTAs, or creating a more engaging webpage experience with visual media or user testimonials.
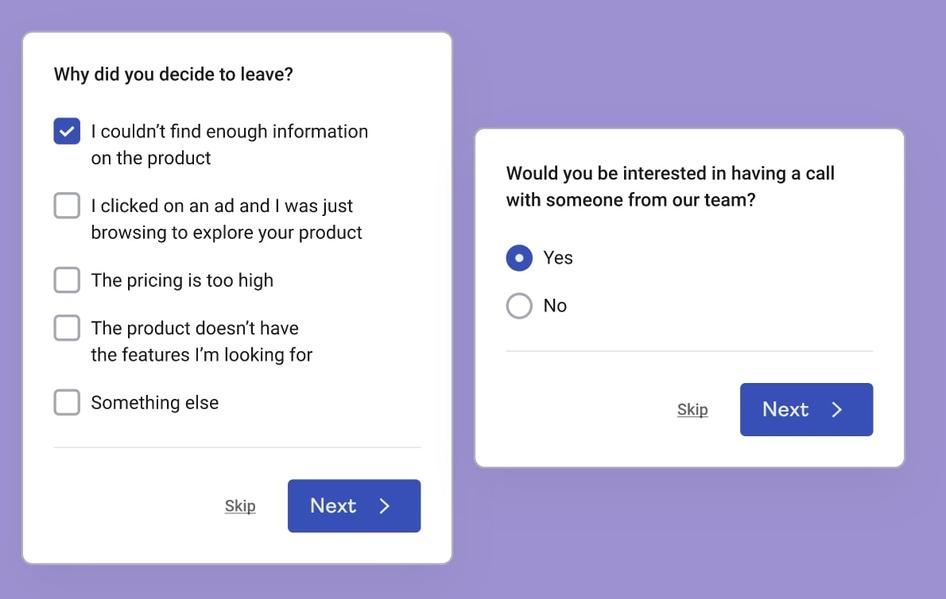
8. Customer churn rate
Churn rate is the percentage of customers who’ve stopped using or purchasing your product or service. It’s a meaningful indicator of your ability to meet user needs by measuring how successful you are at retaining customers.
Calculate customer churn by taking the total number of lost customers and dividing it by the total number of customers at a given time, and then multiplying it by 100. You can also track customer churn by segment using web analytics tools, which tell you if there are any trends or patterns in the types of customers that are churning.
Then get deeper insights into why they’re churning with exit-intent surveys that ask users about their customer experience as they’re leaving or canceling their subscription.
For example, exit-intent surveys might indicate that customers are churning because they don’t understand the full value of your product. Teams can then come up with customer activation solutions to boost satisfaction levels, like improving the onboarding process with useful tooltips and knowledge bases that help with product and feature adoption.
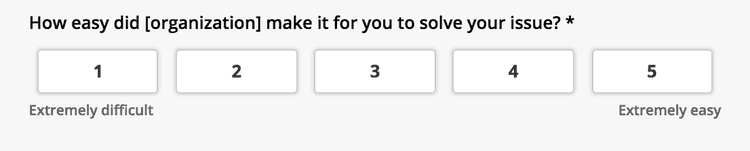
9. Customer effort score
Customer effort scores (CES) tell you how easy it is for customers to use your product or service. It’s a useful metric to understand whether customers are able to intuitively complete desired actions and find the information they’re looking for—which directly relates to their satisfaction levels.
CES scores are collected by surveying customers after they complete a particular action or interaction—like making a purchase or clicking on a video—on your site or product. For example, you may want to ask customers who’ve successfully checked out to rate how easy they found it to complete the checkout process or navigate your site to find the products they were looking for.
Use Hotjar's CES Survey to better understand the customer experience you provide, and what you could change to increase satisfaction.
Take action on metrics and KPIs to drive customer satisfaction
It’s important to find the right customer satisfaction metrics for your specific user and organizational needs. Start by selecting the key metrics that align most closely with your overall company or departmental KPIs, and track them consistently over time to reveal patterns and trends in customer behavior.
But the metrics alone won’t always tell the whole story or clarify the actions you need to take. Maybe basic analytics show you that your conversions are low on one page, but user engagement is high—so you’re not sure which changes to make. To understand the ‘why’ behind customer patterns, talk to your users, watch recordings of their full sessions, and understand why they’re engaging but not converting.
Use customer satisfaction metrics as a starting point to dive deeper and better empathize and understand your users. Asking users about their experiences directly and seeing exactly how they engage with your site and product pages give you actionable context on your customers’ satisfaction.
Get more out of your metrics with Hotjar
Use Hotjar Observe and Ask tools to really understand your customer satisfaction scores—and improve them.