Learn / Guides / Feedback guide
5 steps to analyzing user feedback for deeper customer insights
Gathering user feedback provides a wealth of valuable insights, helping you connect with your customers and hear where you are (or aren’t) hitting the mark.
The challenge is that language is complex, opinions are varied, and trying to make intelligent optimizations based on hundreds of responses quickly leads to information overload. The solution? Thoroughly analyzing your customer insights.

Effective user feedback analysis breaks down qualitative and quantitative feedback from customers into digestible insights about your product or website.
This guide gives you practical tips for analyzing your user feedback to discover your product’s delights, frustrations, and opportunity areas. Follow these steps to hear your customer’s voice, loud and clear—and build a better business.
Gather valuable insights with one simple tool
Try Hotjar Feedback today and get a direct line to what makes your customers tick.

5 steps for effective feedback analysis
Analyzing user feedback from various sources—and people—is no small feat, and finding meaning in your results may be challenging.
But taking this data and breaking it down into digestible insights turns the complex into the actionable, leading to powerful, customer-centric optimizations and a deeper understanding of your users.
Below, we share step-by-step guidance on how to compile and analyze feedback in a structured and cohesive way.
❗️Before you get started, remember that feedback takes many forms and should be prioritized accordingly. Consider the following:
Ready to distill your data into its purest, most practical form? Let’s begin your user feedback analysis process!
Step 1: collate your data
First things first, you need to put all the information you’ve collected into one cohesive place, so it’s easy to analyze in depth.
Feedback comes from a range of different sources, including social media, customer interviews, surveys, and website widgets. Getting all of these responses—no matter the format—into one location sets the foundation for strategic data analysis and provides a clearer overview of user sentiment. It also allows for sharing knowledge with other teams and stakeholders.
When collecting feedback directly on your site or in your product, integrate your feedback analytics tools with other communication tools to easily collate responses and alert relevant teammates.
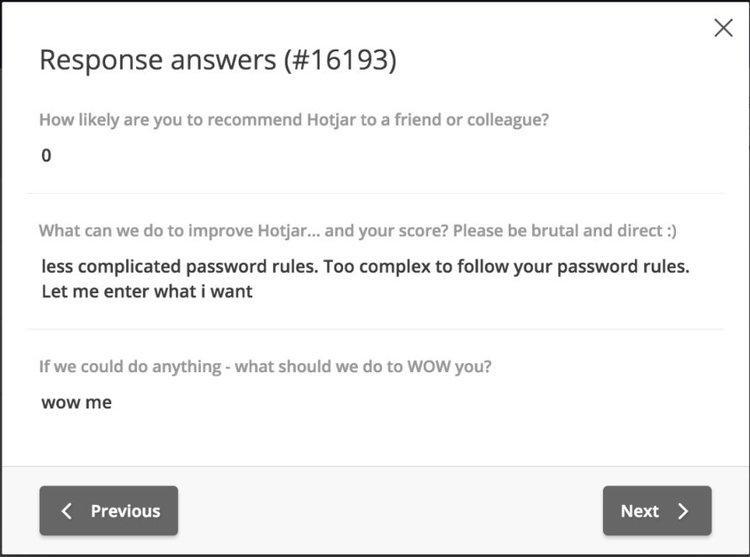
For example, the Hotjar Feedback widget (that’s the little red tag to the right of the page!) integrates with Slack and Microsoft Teams so you can send feedback responses to a dedicated channel and keep the right people in the know.
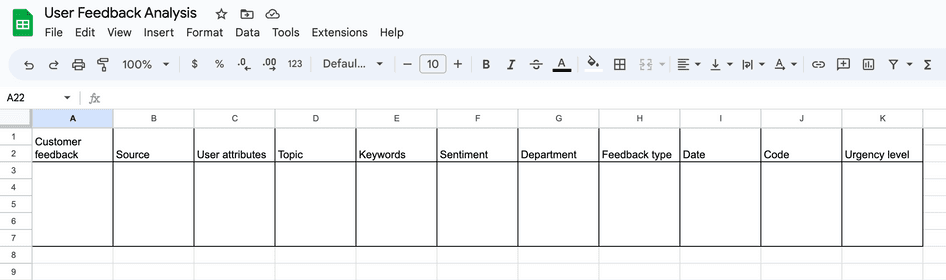
For the ultimate centralized data warehouse for your feedback collation, we recommend integrating your feedback collection tools with Google Sheets, Excel, or Miro.
These tools allow for the structured organization of your feedback into its purest form, filtered by the categories you decide on (more on this in a moment).
💡 Pro tip: the Hotjar API is a must-have for analyzing user feedback fast and effectively.
The perfect partner to Hotjar Surveys, the Responses API exports feedback collected from user surveys to tools of your choice—such as Snowflake, Tableau, Google Sheets, and more.
Analyze your results at scale, turn user feedback into visuals, create presentations, and get to the crux of what your data means.
Step 2: determine your priorities
We mentioned earlier the need to determine your priorities when analyzing your user feedback, but creating a clear roadmap of goals and next steps is challenging. There are many voices to listen to, multiple opinions to consider, and conflicting—or highly subjective—responses that are difficult to act on.
Apply a scale of importance to the topics raised in user feedback to ensure you don’t lose sight of your main objectives. This practice groups your feedback by order of urgency, so you can understand the difference between ‘this must be fixed ASAP’ and ‘important, but can wait.’
For example, high-priority feedback might address:
Pricing: feedback expressing interest, frustration, or confusion about payment or pricing options
Security: feedback flagging issues in data protection or security on your website
Bugs: complaints of buttons not clicking, pages not loading, or any issues blocking your customers from completing an action
Other feedback that, while important, can be addressed less urgently might mention:
User interface (UI): feedback mentioning frustrations in the layout of a landing page or the flow of your site
Feature requests: comments asking for certain optimizations or additions to your product or site
Thirty comments requesting more customizability options may strike a sense of urgency. However, with clear, predetermined priorities like the above, recognizing that other issues are of greater importance ultimately benefits your customers more in the long run.

All this is not to say that some customers should be ignored—the Hotjar team believes in the importance of taking an empathetic, customer-centric approach to every business development decision. But this practice of prioritizing is essential for maintaining clarity when sorting through large amounts of feedback.
🔥 If you’re using Hotjar
Hotjar Feedback’s filter options let you search responses by keyword. Instead of sorting through the noise, skip straight to what’s most important.
Whether you’re only interested in feedback flagging bugs onsite or you’re in need of a little ego boost and want to hear what people ‘love’, Feedback has got you covered.
Step 3: categorize your feedback
Categorization is a crucial step in customer feedback analysis—it’s where you’ll see the data falling into place and the magic start to happen.
The particular set of categories you choose to filter your feedback is up to you, and will depend on your business priorities and the type of feedback you gather.
However, we believe these are some of the most essential categories to consider when segmenting your data:
Urgency level, e.g. high, medium, low
User attributes, e.g. location, pricing plan, average spend, customer lifespan
Topics, e.g. product, pricing, customer service, delivery
Keywords, e.g. ‘bug’, ‘payment’, ‘love’, ‘broken’
Source of the feedback, e.g. customer satisfaction surveys, social media, customer service teams, feedback widget, notes taken during user testing
Sentiment, e.g. positive feedback, negative reviews, neutral responses, junk
Department responsible, e.g. finance, customer service, user experience (UX) design
When determining which categorizations are best for your business, be sure to consider what value the information will bring you. Avoid vanity metrics and focus on the feedback that inspires you, teaches you, and informs your future product optimizations and business growth.
☝️ Caveat: once you’ve compared the potential parameters for filtering your data and against the complexity of the feedback you’ve collected, it may seem like the options for categorization are endless. We recommend limiting yourself to no more than 20 to avoid becoming lost in the noise of information, and force yourself to distill your data into the most impactful insights.
💡 Pro tip: opt for a tool like the Hotjar Feedback widget to home in on the specifics of your user feedback results.
Easily filter your feedback by:
Date
Country
Keywords
Rating
Page URL
Looking for impressions of a specific update you made recently? Or are you curious about the ratio of positive to negative responses you’ve received over the past three months?
Start exploring your Feedback dashboard to dive into deeper UX insights.
Step 4: create codes to simplify your feedback
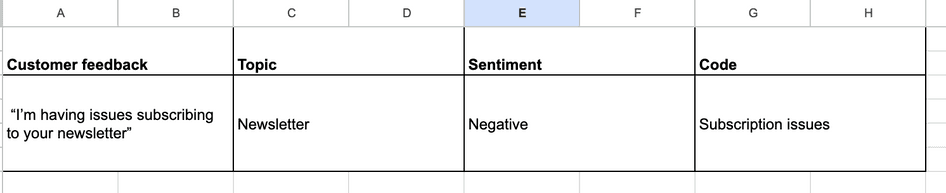
Coding is a method of grouping and labeling feedback even further, so it’s easy to evaluate the context at a glance and make a plan of action.
Simply put, it’s taking the feedback, or qualitative data, you’ve gathered and breaking it down into its most practical terms, or quantitative data. This process turns information such as “I’m having issues subscribing to your newsletter” into data like “There are 150 reports of sign-up issues.”
Coding differs from filtering in that it’s an additional breakdown of pre-categorized data into purely actionable information.
Applying codes to your feedback analysis allows you to instantly see trends in topics and understand where customers may be experiencing issues on your website. It also trains you to recognize the root of different feedback responses without getting stuck in the nuances of language.
Here are some examples of how to code feedback:
Comments saying the customer wants to tailor their Feedback widget more to fit their brand could be coded as ‘More customizability options’
Comments reporting that the website won’t load when they enter their email address could be coded as ‘Page not loading’
Comments claiming a CTA isn’t responding when they try to pay could be coded as ‘Purchase button not working’
Code instances can then be calculated, giving you an overview of the most common issues.
For example, if there are a number of feedback reports that a page on your site isn’t working, you don’t need to know the specifics of the issue straight away. A ‘page not loading’ code used multiple times means this is a recurring problem needing urgent attention.
If you’re only interested in looking at login issues, filter your feedback by a related code (such as ‘issues logging in’). Then, dig deeper to see which keywords crop up again and again—such as ‘loading’ or ‘crashing’—to get closer to the source.
You’ll learn to recognize which codes to assign to each piece of feedback, regardless of how much superfluous information a comment might include.
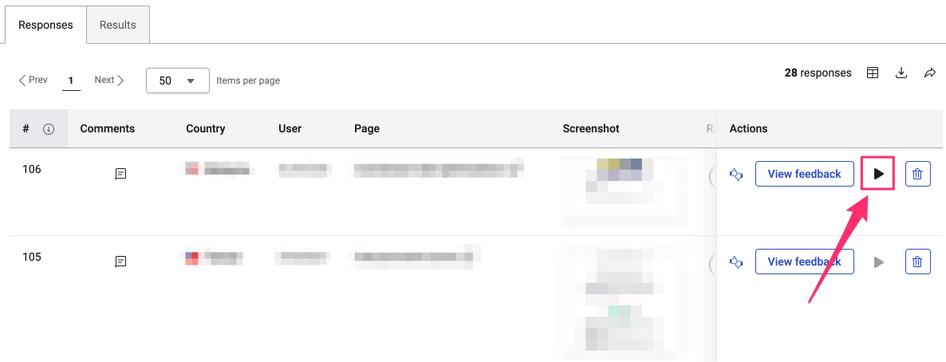
🔥 If you’re using Hotjar
Combine Hotjar Recordings with Feedback to analyze customer behavior and give context to even your vaguest responses.
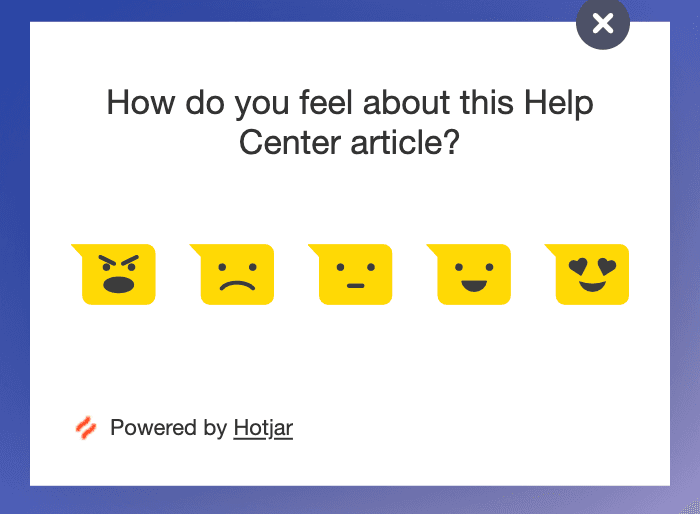
Got feedback in the form of a confusing comment or an angry emoji? Watching the accompanying session recordings reveals what the user actually experienced, so you know how to code it.
Recordings reveal the behavior behind the comments, show the steps your users take in their flow, and give deeper insights into your customers’ needs and wants.
Filter your recordings using filters like page visited, date, or sentiment to skip past anything irrelevant and get right to the bottom of your user experience.
🎓 Check out our guide for more advanced Feedback tips.
Step 5: compile your learnings for knowledge sharing
If you’ve followed the steps above, you should now be looking at a pretty thorough data warehouse of all of your feedback responses. You’ve broken it down by category and applied codes, and you’re seeing trends in topics, themes, and sentiment across your entire users’ journey.
So now what?
With all this information at your fingertips and simplified as much as possible, it’s time to build an analytical report for sharing with other teams and stakeholders.
As with your choice of categories and codes, the information you highlight depends on your business goals and the feedback you’ve collected.
That said, some of the most insightful data to look at include:
Increase or decrease of negative and positive reactions over time
General sentiment following an update or product release
Keywords and the frequency of their occurrence
Trends in specific topics or themes mentioned
The types of customer leaving certain feedback
Get familiar with your feedback analysis reporting tool to explore patterns and trends, filter by topic or user attributes, and create visual reports illustrating your learnings.
Consider creating separate reports targeting specific teams or topics, so everyone who should be in the know is. This is an excellent way to streamline your reporting for teams like UX design, finance, or product, so each can focus on their respective priorities with clear visibility into next steps.
💡 Pro tip: Hotjar’s Dashboard gives you the ability to build charts, plot results on graphs, view trends, and create a highly visual breakdown of the responses you’ve collected.
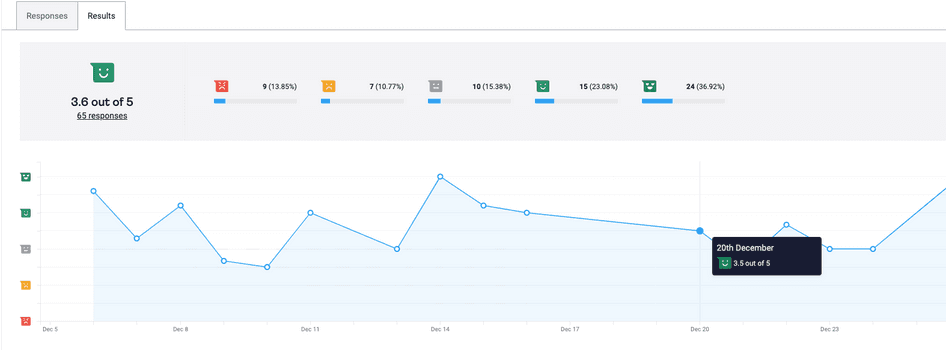
Viewing trends in feedback over time using the Dashboard’s visualization features
Filter your data into digestible learnings, create reports for sharing performance results, and get right to the core of your insights—all in one place.
Keep your customers at the heart of user feedback analysis
Analyzing user feedback may seem daunting at first, but with a methodical approach and structured strategy, it won’t be long before you’ll uncover valuable insights about your user needs, straight from the source.
Go into feedback analysis without a predetermined idea of what you hope to find. Stay open to whatever your users have to share, and you’ll be on track to developing the most customer-centric, data-driven optimizations possible.
Make UX optimizations the customer-centric way
Turn customer feedback into actionable insights for your website with Hotjar Feedback.