Learn / Guides / PX insights guide
Product analytics vs product experience insights: what’s the difference?
Product analytics, also known as product management analytics or behavior analytics, is hard data that helps you identify where your product is working and where it's falling short. But product analytics data doesn't tell the full story of the user experience (UX).
Product experience (PX) insights help you connect the dots between what's happening and why it happens.
PX is more human than product analytics—it's like sitting down and talking to your customers. It lets you empathize with them and understand the intentions behind their behavior, so you can prioritize changes and improvements to your product.
You need both product analytics and product experience insights to fully understand how your customers interact with and experience your website or mobile app, what they like and don't like, and how you can improve UX and the customer experience (CX) to create customer delight and get better business results.
So, what are the differences between product analytics and PX insights? And how can you use them together? Right this way. 👇
Page-level data differences
Page-level data indicates how users behave on a page—like how many people click your CTA button, where they linger, and which pages they skim for five seconds then leave (aka 'bounce').
Product analytics gives you quantitative page-level data: numbers that tell you which pages are performing above or below industry averages. Product experience insights complement product analytics data by showing you why those pages are doing well—or why your customers are clicking away.
Product analytics reveals trends in page-level data
Product analytics can be found on platforms like Google Analytics (GA), where you can measure quantitative page-level data. Trackable metrics like paid and organic pageviews, goal conversions, CTRs, and referral sources help you identify trends in user behavior and form hypotheses about your product's UX.
Product analytics metrics are easy to find and track, which is why product manager KPIs are usually built around product analytics data. But they can be difficult to interpret on their own.
For example, Charli Marie, a web designer, found that one of her product pages had 1,000 views but only nine conversions (i.e. a 0.9% conversion rate). You can form many different hypotheses about underperforming pages, but let's use these four possibilities as an example:
The messaging on the page isn't clear, and users aren't finding what they need fast enough.
The user experience (UX) of the page needs to be improved.
Something critical (e.g., your CTA button) is broken.
People don't like your product.
Until you gather product experience insights and determine which hypothesis is correct, you won't know what you need to do to improve conversions.
Improve UX with product experience insights from Hotjar
Use Hotjar to understand how real users are experiencing your website or app—then improve it for them!
No credit card required

No credit card required

56,549 users signed up last month

GDPR- & CCPA-ready

Product experience insights explain the trends
Product experience (PX) insights help you validate (or invalidate) hypotheses about your product's UX, and tell the story behind the user behavior trends you identify through product analytics.
Finding out the motivation behind user behavior will guide you in building a better product and identifying what information needs to be surfaced earlier.
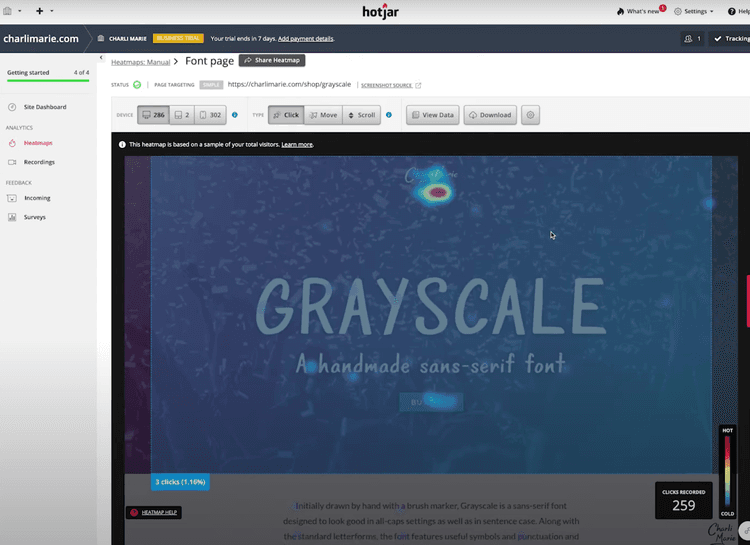
Charli Marie looked at the individual behavior of her visitors using Hotjar (that's us! 👋), a product experience insights tool. She used Hotjar Heatmaps to see which web elements most of her visitors were clicking on and how far down the page they would scroll on average. She also watched a couple of Hotjar Session Recordings to see playbacks of user interactions on both her web and mobile product pages.
One of the things she learned was that visitors were clicking on the Buy Now button at the top of the page, which indicates buying intent. The problem was that the button scrolled to another Buy Now button instead of taking visitors directly to a purchasing page, which was causing users to click away.
With product experience (PX) insights, Charli Marie was able to align with her customers' thought processes, validate hypothesis number two (from the above section), and identify that the next step would be to allow visitors to purchase using the first Buy Now button.
Within a month of implementing those changes, Charli Marie's product page's conversion rate increased by 2%. 💪
Customer journey insights
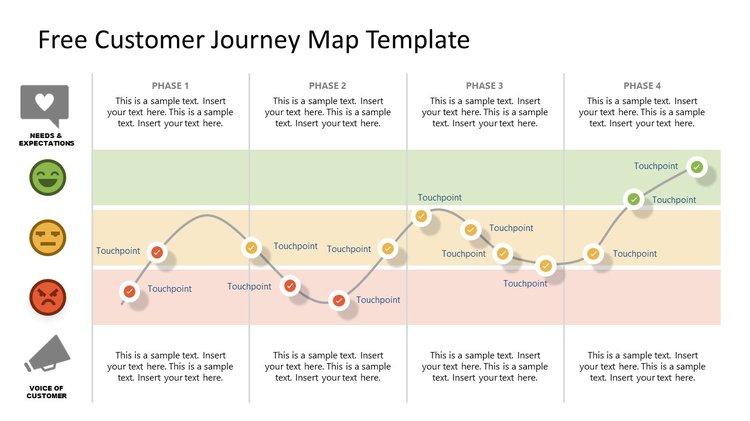
A customer journey map helps you understand how your customers experience your product at multiple touchpoints. Customers decide to buy your products for different reasons, use your product to solve different problems, and experience frustration at different points in their journeys.
Quantitative and qualitative data about your customers’ product journeys and your product's performance will tell you what and where you need to improve, why you need to improve it, and how—that is, which steps to take—to create customer delight.
Product analytics shows a user’s path
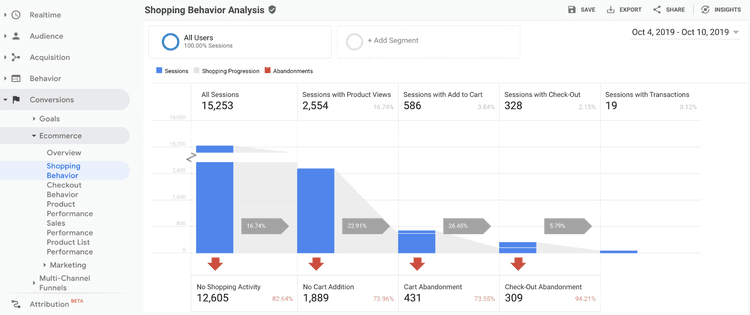
Product analytics shows quantitative data about how your users go from discovering your product to finally making a purchase. The user path is important because it identifies your highest-converting pages, and customers' shopping and checkout behavior.
Integrate your website with a product analytics tool like Mixpanel or GA to find out how many visitors made it to a product page but didn't check out—or how many visitors made it to the checkout page but didn't complete their purchase. If you're offering a SaaS product, you can find out where most of your existing customers are dropping off or where they churn—is it during the customer onboarding stage? After two months of using your product?
But again, to see the complete picture of the user and customer experience, you need to complement your product analytics data with product experience insights directly from your customers to learn why they decided not to add items to their cart, not to complete a purchase, or to churn.
Product experience insights show you why they take the journey
If product analytics shows you how your customers traveled from discovery to purchase (and where they're dropping off), product experience insights show you why they take that journey (or decide not to). And you need to know when and why your customers are getting frustrated because 33% of customers walk away after just one bad experience.
Your customers will have different motivations throughout their customer journey that only product experience insights can reveal. For example, not all customers who churn are frustrated, and not all customers who purchase your product are your ideal users.
Understand and empathize with your customers’ experiences at each stage of the customer journey by getting direct feedback from them with Hotjar Surveys and the Incoming Feedback widget.
Ask questions like, “Why didn't you add this to your cart today?” or “Why aren't you completing this purchase?” before users exit.
User testing and session replays can also help you understand the reasons for low customer retention. Members of your team are familiar with your website, but real-life users aren’t—they'll encounter issues that insiders may have become blind to.
When you bring in new users and capture their interactions with Hotjar Session Recordings, you can see how your site works for them and whether they can complete actions without friction.
Understanding the why behind user behavior at each stage in your customer journey can help you make informed product decisions and improve your messaging to reduce churn and increase customer retention.
Understand customer pain points
Product analytics and product experience insights help you identify customer pain points, contextualize them, and prioritize changes to improve the product experience—and to show your customers that you are listening and that you appreciate them. 🤗
Product analytics reveals users’ pain points
Product analytics can show you what blockers or pain points your customers experience and where they experience them. Some indicators might be high exit and high bounce rates. Other indicators could be low time on page and session durations.
But, as always, there’s a bigger picture to the user experience that goes beyond the numbers: gathering voice of the customer feedback (more on this in a second) will tell you exactly what your customers are experiencing and how you can improve UX by solving problems and removing blockers for them.
Product experience insights add context to user pain points
Product experience insights tools (like Hotjar) let you collect feedback directly from your customers on an individual level, also known as voice of the customer (VoC) feedback. Listening to customer stories will help you put yourself in their shoes and empathize with them by understanding the problems your customers face.
Use Hotjar's Incoming Feedback widget to gather VoC feedback in the customers’ own words. The widget also lets customers select elements on the page, so you know exactly what caused the poor experience. Use Incoming Feedback to track common customer questions, ask prospects why they're considering buying your product, and cross-reference their input with Session Recordings on the same page.
Product analytics and product experience insights work together to help you improve UX
Numbers and data are just as important as the stories behind them.
Data from product analytics and product experience (PX) insights lets you identify UX blockers and pain points, empathize with your customers, and understand the user experience, so you can make the right changes at the right time, and delight your customers at every turn.
Improve UX with product experience insights from Hotjar
Use Hotjar to understand how real users are experiencing your website or app—then improve it for them!
No credit card required
No credit card required
56,549 users signed up last month
GDPR- & CCPA-ready