Learn / Guides / GA glossary (A-Z)
Average session duration in Google Analytics
Average session duration in Google Analytics 4 (GA4) is a user engagement metric that tells you the average length of engaged sessions on your website or app.

GA4 starts calculating a session (whether engaged or unengaged) when a visitor opens your app in the foreground or views a page or screen—and no previous session is currently active. If they stay active for a certain length of time (the default is at least ten seconds), it’s considered an engaged session.
There’s no limit to how long a single session can last. But a session automatically expires after 30 minutes of inactivity.
Checking how long visitors stay on your site or app helps you gauge their interaction with and interest in your brand, products, or services.
For example, let’s say you see new users spending around five minutes on your site. If the average session duration for this segment used to be far shorter, it could indicate that your landing pages and campaigns are now piquing their interest. The increase could prompt you to dig into what’s really happening and make more of the same effective optimizations.
Discover what really happens on your app or website
Get the insight you need: use Hotjar Recordings and launch on-site surveys to learn more about your users and optimize your site or app.

How does Google Analytics 4 calculate average session duration?
The GA4 average session duration refers to the length of all engaged sessions* divided by the number of all sessions on your site or app. Here’s how to write the formula:
Avg session duration = total engaged sessions within a certain time period / total sessions in the same time period
Of course, Google Analytics already makes this data available to you—although with a few extra steps compared to Universal Analytics (UA). Keep scrolling to learn where and how to look for it.
* Again, a session is ‘engaged’ if it goes beyond a single pageview or screenview or triggers a conversion event and lasts longer than your preferred limit (you can set it between ten and 60 seconds).
How to find average session duration in Google Analytics 4
Unlike in UA, which stopped processing data on July 1, 2023, average session duration isn't included in GA4 reports by default. But it only takes minutes to add it to your standard reports. Track this metric in GA4 and analyze it alongside other engagement metrics with these steps:
Step 1: first, you need Admin or Editor permission for the Google account or property on which you're generating a report. Or ask the teammate who has the appropriate permission to take it from here.
Step 2: click on ‘Reports’ in the left-hand menu. Choose any report. In this case, we’ll use ‘Traffic acquisition: Session default channel group’.
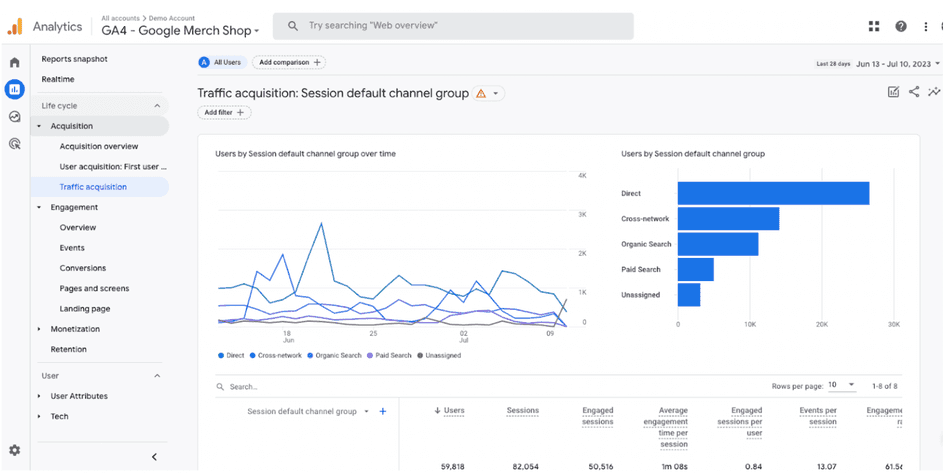
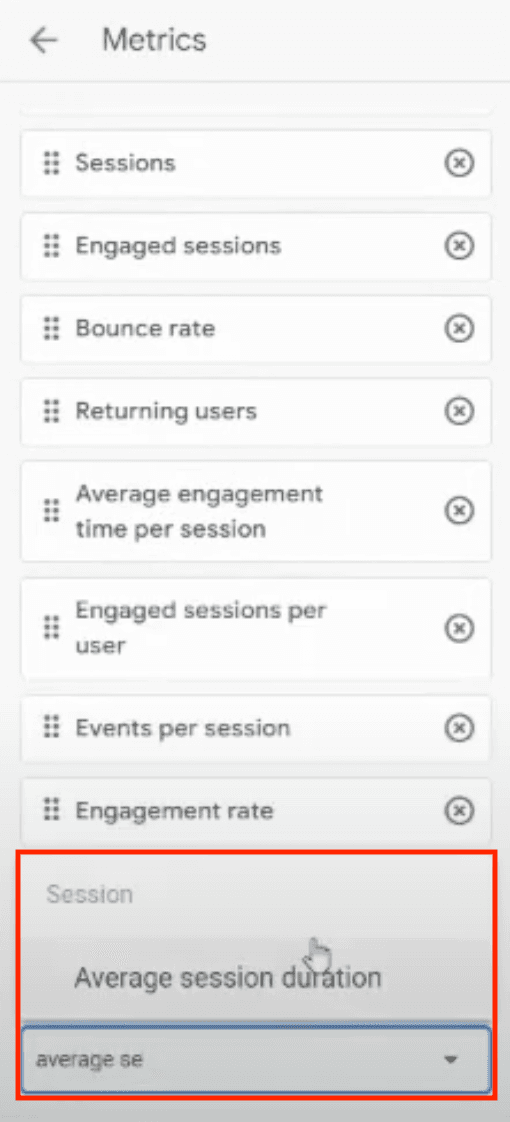
Step 3: click on the pencil icon at the top-right corner and select 'Metrics'. In the bottom search box that says 'Add metric', type 'average session duration' to find it immediately. Hit the 'Apply' button.
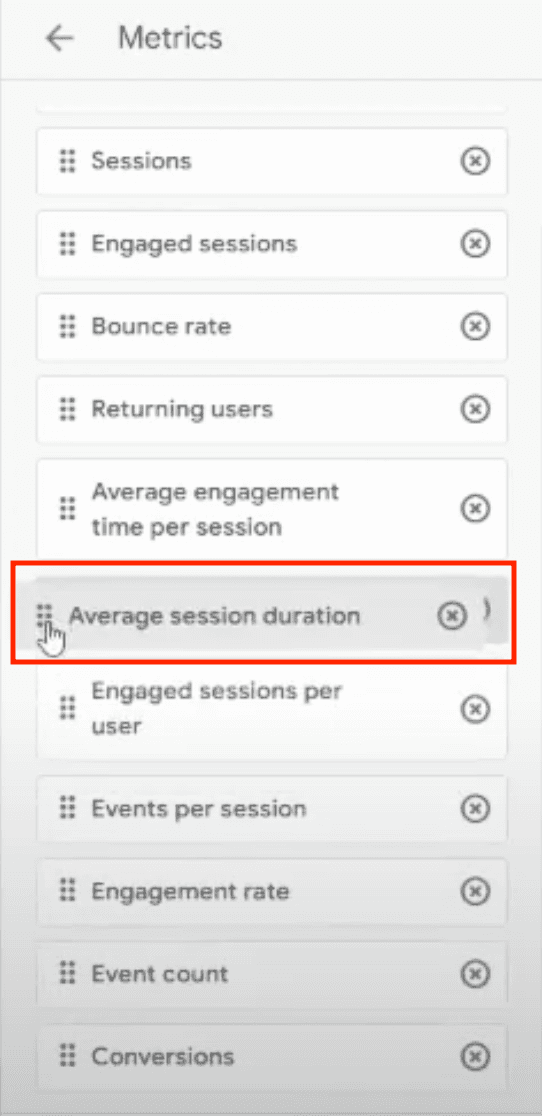
Step 4: now drag the metric above or below relevant metrics so they appear side-by-side when viewed in a report table.
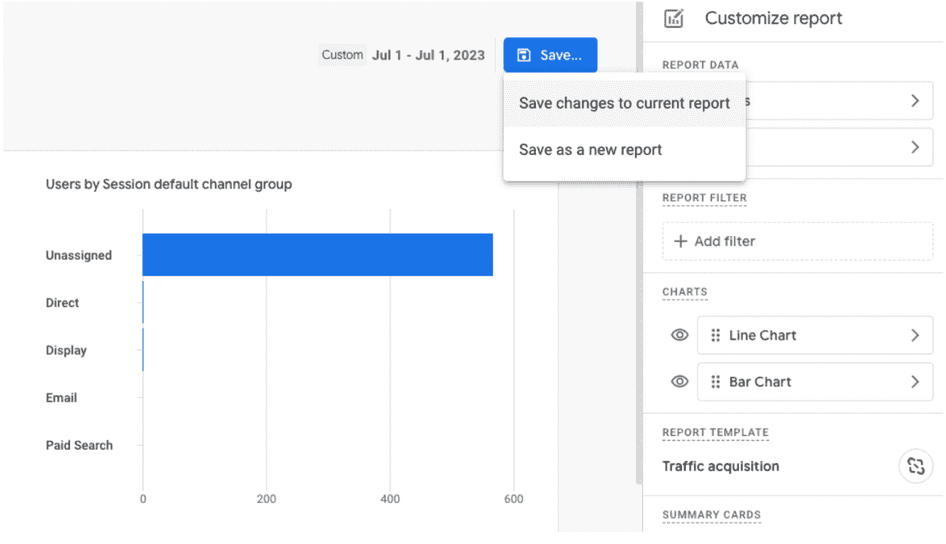
Step 5: once you’re happy with its placement, hit ‘Apply + Save + Save changes to current report’ to the left of the ‘Metrics’ pane. A prompt will confirm which current report you want to update with the changes.
🔥 Pro tip: try GA4’s exploration reports if you prefer advanced reporting and further customization. Explorations provides data access and analytical techniques that aren't available in reports, allowing you to
Focus on the most relevant data
Find out if users encounter blockers in their buying journey
Uncover user experience issues and website bugs
Google shares some Explorations starter tips so your company or team can take advantage of this feature.
What the average session duration in Google Analytics 4 tells you (and what it doesn’t)
Observing how much time visitors spend on your site or app on average offers some vital business insights.
For example, average session duration and 'average engagement time' tell you how long a user might take to get through a sales funnel. A sales funnel includes interactions across multiple pages, such as: homepage > category page > product page > shopping cart > checkout.
If it takes users an unrealistically short or unusually long amount of time to get through the funnel, the data's erratic trend might push you to investigate potential problems. However, you can't know what's wrong without looking past the numbers (more on this later).
Let's look into the four things you should be wary of when checking average session duration in GA4—and some bonus tips on what to do to understand the user experience better.
1. Average session duration raises more questions than it answers
As much as this metric gives you quantitative data—which is good enough if you want to know what's happening on your site—it doesn't offer context to help you learn why users behave a certain way.
Identifying the reasons users experience issues in the customer journey is more meaningful if you plan to fix them fast and avoid costly do-overs. Meanwhile, the lack of context only leads to more questions, such as
How did particular users get through the sales funnel so fast? Did they miss any important page elements or details?
Why did those users take so long to get through the sales funnel? Was there information missing? Did they encounter a website bug? Or were the next steps not clear?
🔥 Recordings gives you a glimpse of how users experience your app or website
Use session recordings to get into your users’ headspace: how they engage with your app or site from page to page, up to the point of exit. This front-row view helps you think beyond session duration and consider drivers of user behavior.
For example, you can see if an area or element causes them to repeatedly click or tap, leading to a series of rage clicks that indicate frustration. Tap into these replays of real, anonymized users clicking and moving around pages to identify pain points or blockers and optimize your app or site accordingly.
Session recordings shed light on situations, such as the user
Encountering broken links, missing elements, or website bugs
Exhibiting frustration through rage clicks or u-turns (when a user opens a new page and returns quickly to the previous page)
Getting distracted by pop-ups or other elements and becoming inactive on a page
2. Session duration now accounts for users navigating away, but it still doesn’t uncover the behavioral cause
GA4 accounts for when a user leaves a page open and returns to continue browsing a second page. For instance, imagine someone scrolls through your homepage for one minute and then checks another site (say a competitor's). Before the 30 minutes of inactivity elapses, they go back, navigate to a second page, and stay there for six minutes. Their entire session lasts seven minutes.
If the other page was a product page, and the user left without buying anything, you'd want to know what actually happened. Were they just browsing options? Or did something on your app or site turn them off, like a broken checkout button or a confusing product description?
Average session duration provides an incomplete picture if treated as a standalone indicator.
3. Average session duration is not the best indicator of engagement
As we said, solely looking at the average length of engaged sessions won't give you an accurate understanding of the user journey. You should include average engagement time—that is, the total time active users engaged with a web page.
Analyzing pages with the highest average engagement time lets you determine what you're doing right. On the other hand, those at the bottom drive you to dig deeper into what makes users leave—is it because your content doesn't meet their expectations, or there are too many errors on the checkout page? Perhaps they're not sure what to do next after reaching your landing page.
🔥 Launch a user-friendly survey on high-exit pages
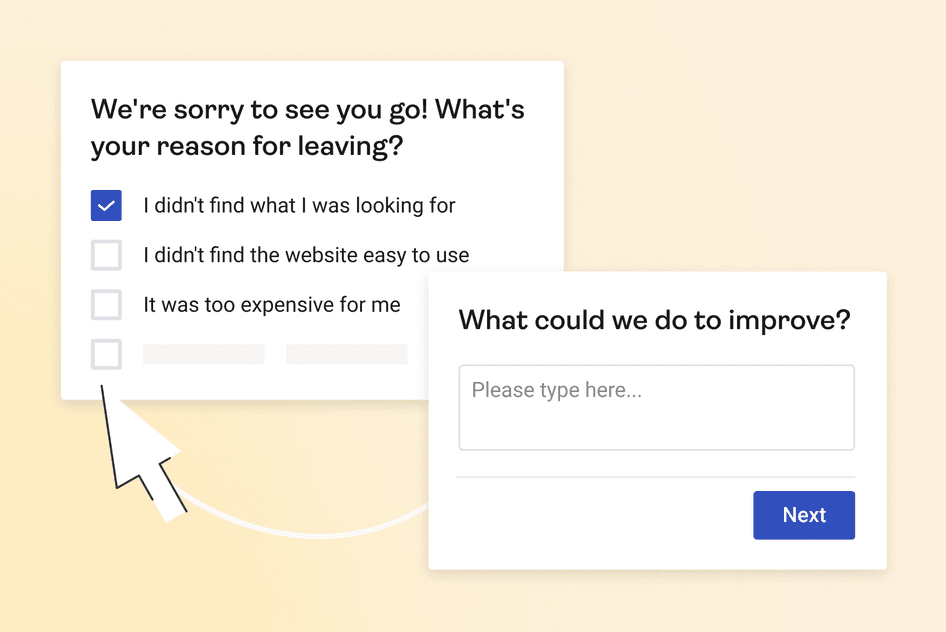
The last page of a session is called the exit page. You can track high-exit pages by creating a custom report or 'Exploration'. Consequently, place a well-timed, on-site survey to ask real users directly why they leave a page, so you can learn about what they're looking for and are hoping to see improved on your app or site.
Ask your visitors a combination of open- and closed-ended questions, like
Will you be making a purchase today? [Yes/No]
What's stopping you from buying today?
How can we make this page better?
Not sure what type of survey to launch and what to ask? Create a survey matching your goals using our AI or one of our pre-built templates (see: exit-intent survey)—with a comprehensive bank of survey questions to boot.
4. Session duration can be ‘fixed’ or altered
One case in which this can happen is when you change your timeout setting in GA4. As mentioned earlier, a session expires by default after 30 minutes of inactivity. Make it too short, and you get a high number of sessions but low engagement time; make it too long, and you artificially extend how long users stay on your app or site.
Either way, you end up collecting inaccurate data. And this doesn't help you gauge how much your pages pique people's interest or discover their actual experience on your app or website.
🔥 Ask users for feedback on high-exit pages
Get to the bottom of people's likes and dislikes by hearing from them directly as they experience your app or website. Roll out our nifty Feedback widget and ask them to rate their experience.
Having feedback scores on each page reveals what users love and hate, and enables you to spot problems as they develop. From there, you can make a data-driven decision and avoid deploying improvements people didn't ask for.
Easily go beyond average session duration to optimize your site brilliantly
Complement the average session duration metric with user behavior and visualization tools to better understand how people experience your website or app. This opens you up to more valuable insights, which you can use to optimize website performance and delight your customers.
Ready to get started? The Hotjar and Google Analytics integration facilitates a seamless switch between extensive app and web analytics and eye-opening digital experience insights. It's time to get the best of both worlds.
Discover what really happens on your app or website
Get the insight you need: use Hotjar Recordings and on-site surveys to learn more about your users and optimize your site.