Learn / Guides / Product experimentation guide
Product experimentation framework: a step-by-step guide for successful product experiments
The mission of a product team is deceptively simple: make your users’ lives and jobs easier.
But your work is never done—you’re always iterating and improving your product to meet users' needs.

As your product evolves, you might be tempted to follow industry 'best practices'. You could also make assumptions about your customers, and make changes to your product until one of them sticks.
But these approaches don’t take into account what your customers already think about your product, how they feel while they use it, and what they might be missing or struggling with. You’re working in the dark, so when your product change works well—or fails—it’s hard to tell why.
Product experiments, and a step-by-step product experimentation framework, let you make product changes with confidence and empathy. This guide gives you six steps to run successful product experiments and delight customers with the product improvements they need.
Run product experiments that create customer delight
Use Hotjar’s product experience insights to discover what your customers need, which experiments to run, and which product updates to prioritize.

What is a product experimentation framework (and why you need one)
A product experimentation framework is a set of structured steps for testing the impact of product changes. It’s based on building and testing a hypothesis about your product, so you can make data-informed changes to improve the product experience (PX).
This framework encourages curiosity, minimizes risk, and drives continuous improvement. Without experimentation, you’re making product changes based on assumptions. Product experimentation lets you use those assumptions to build hypotheses, and then test them to prove or disprove them—and act accordingly.
The best part? Product experiments are useful even when they disprove your hypothesis, thanks to the clearly defined steps that make up a product experimentation framework.
A 6-step framework for effective product experiments
Useful experiments are structured and repeatable—as are the steps to running them. Here are six steps to follow every time you’re running a product experiment.
1. Define a product goal and its impact on your users
Great experiments start with the end goal in mind. Without a goal to work towards, you’ll struggle to analyze your experiment’s results (and even to build it).
When defining your goal and its impact on customers, consider these five experiment components:
The problem: what do your users already struggle with and need from your product?
The (possible) solution: what are potential solutions to that problem?
The benefit: what is the benefit of that solution, both for your users and for your business?
The users: which audience segment is this solution most relevant to?
The data: what will success look like? Which metrics are you looking to change?
Great product goals come from existing customer experience and feedback. Quantitative and qualitative data from your product will reveal goals worth pursuing.
Quantitative data will reveal potential gaps in your product experience (like a low task completion rate or high churn rate) or a declining metric (like a longer task completion time or a lower NPS than usual).
Qualitative data will show you how your customers feel while using your product, and where they struggle. For example, session recordings can reveal which areas of your product confuse users, and open-ended survey questions let your users explain why they are (or aren’t) taking specific actions.
Combine the data to clarify your product goal. For example:
"The goal is to increase the user onboarding completion rate to improve the overall product experience and increase usage. This goal is based on dropoff data and user behavior and feedback during the final three steps of the onboarding process."
"The goal is to shorten task completion time to help users see success faster. This goal is based on the metric that reveals users spend longer than expected on a specific page and the direct, voice-of-the-customer (VoC) feedback we gathered on that page."
If you skip this step of the product experimentation framework, the potential impact of your product experiment will be fuzzy. It'll be harder to get buy-in from stakeholders to run the experiment at all, or you could end up wasting time and energy on pointless product changes.
2. Build a hypothesis relevant to your goal
A product experiment hypothesis helps remove emotional involvement from your product goals and ideas.
The structure of a hypothesis takes into account the goal you’ve set and the insights you’ve used to set it, which helps your team understand why a product change did or didn’t work.
Here’s the structure you can follow to build your product experiment hypothesis:
"We believe that [a solution] will [the change that will happen] for [audience segment] because [reason for change]."
Let’s take the onboarding completion rate goal from the previous step. Here’s what a hypothesis might look like for that goal:
"We believe that reducing the number of suggested actions in the final three onboarding steps will increase the onboarding completion rate for new customers because it will reduce confusion and overwhelm."
A product experiment hypothesis is made up of the outcome you want to see, the action you believe will get you there, and your theory as to why.
How a UX design agency supports product experimentation with Hotjar
Turum-burum anchors all client projects on analytical proof and uses A/B testing to minimize risks when rolling out changes. In that process, they use Hotjar to form experiment hypotheses and remove guesswork and assumptions.
For one of their clients, the team collected user feedback with Surveys and analyzed the user journey with Heatmaps and Recordings. Based on what they learned, they made several changes to the checkout process and ran A/B tests to analyze the impact of these changes.
The results? Average revenue per user (ARPU) grew by 11.46%, and checkout bounce rate decreased by 13.35%. 💪
3. Choose KPIs to measure your experiment
Key performance indicators (KPIs) are values that allow you to measure the impact of your product change. KPIs are essential to either prove or disprove your hypothesis—it’s how you know whether you’ve achieved the goal you’ve set in step one.
Your product experiment could have just one KPI, but shouldn’t have more than three.
To set your key performance indicator(s), ask yourself:
What needs to change to prove or disprove a hypothesis?
You’ll find clues for your KPIs in your hypothesis. The “[change that will happen]” part is the foundation for the metrics you’ll use to analyze your experiment’s results.
In our user onboarding completion example, the obvious KPI is the onboarding completion rate. To prove the hypothesis, this number needs to increase. You could also track the Customer Effort Score (CES) as a secondary KPI to learn whether your product change made the product experience easier and more efficient.
Here are some other examples of KPIs to inspire your thinking:
Conversion rate from free trial to paid subscription
Customer Satisfaction Score (CSAT)
Task completion time
Task completion rate
Form completion rate
Churn rate
Net Promoter Score® (NPS)
If you’re using Hotjar 🔥
Product teams can use Hotjar to get a deeper understanding of the impact product changes have. Analyze heatmaps and session recordings for variations of product elements you’re A/B testing to see how user behavior differs between them.
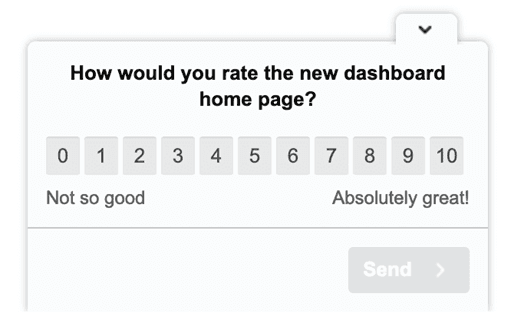
You can also ask for customer feedback on a product change. Razorpay, a suite of end-to-end payment solutions, used Hotjar Surveys to collect feedback from a small portion of their users who got access to a new dashboard. The CSAT scores—their KPI for this experiment—weren’t great at first, but the team incorporated user feedback and saw great success.
4. Set up experiment parameters
Next up are the sample size and length of your product experiment.
A sample size is the total number of data points collected in your experiment. To define your sample size, it’s important to consider statistical significance and whether the data you collect accurately reflects the population as a whole.
Put simply, higher statistical significance means there’s a smaller chance your experiment results are down to pure randomness, giving you more accurate results.
For example, if 5,000 people go through your user onboarding flow every month, it’s risky to make sweeping changes to your onboarding based on data from only 40 sessions.
Check out Hotjar’s guides to statistical significance and sample sizes for our best advice and favorite tools to determine your experiment’s sample size.
The length of your experiment will be tied to your sample size based on the number of customers who use your product (or a relevant section of it) in a day, week, or month. However, it’s worth considering running your experiment for at least a week, even if you’re working with large user numbers. This is because user behavior may vary between different days of the week.
Apply the same approach to any non-typical periods for your product, too, such as holiday periods or months with noticeably higher or lower product usage compared to other months.
5. Run your product experiment
So, now you've got your experiment goal and hypothesis, and you know the KPIs you’re tracking and for how long. Next up: launching your experiment.
For this, you’ll need to set up some product experimentation tools. Here are some suggestions:
Google Optimize, a free experiment platform you can use to run A/B, multivariate, redirect, personalization, and banner split tests
Optimizely, a digital experience platform that enables tests like A/B, multivariate, and personalization campaigns
Omniconvert, an experimentation tool that lets you run experiments for detailed user cohorts
On top of those, it will pay off to add a layer of qualitative insights with a tool like Hotjar. This way, you’ll learn not only which variation is winning, but also why.
Make sure your user segments, variations you’re testing, and the tools you’re using to collect data and insights are correctly set up so you get the most accurate, actionable results possible.
Find everything you need to know about these tools and ways to integrate their results with qualitative insights in the product experimentation tools chapter.
6. Review results to prioritize product updates and inform future experiments
There are two main possible outcomes of your experiment:
You’ve confirmed your hypothesis, which means the product change you’ve tested should be rolled out to all users in that user segment.
You’ve disproved your hypothesis, meaning the outcome you’ve outlined in your hypothesis didn’t happen. That isn’t the end of the world—you can learn from it.
Both scenarios are important and valuable opportunities to understand your users better, empathize with them, and inform future goals, hypotheses, and experiments.
First, be sure to share your experiment results with your team and map out next steps, like making a product change you validated or brainstorming product goals for your next experiment.
Then, dig into the why of your experiment results (yes, even if you’ve proven your hypothesis!). This involves unpacking your product experiment’s KPIs. For example, if your KPI was the product onboarding completion rate and it did improve, it’s worth spending some time to add a qualitative layer to the new number.
Hotjar (👋) helps you do that with tools like:
Session Recordings: watch how users move from one onboarding step to the other, where they linger, what helps them move faster, and where they focus their attention. By comparing pre-experiment recordings with those from your experiment, you’ll learn the direct impact the change had on their product experience.
Heatmaps: review scroll maps, move maps, and click maps for each step of onboarding, including if you’re running an A/B test, to see patterns in user behavior during onboarding.
Surveys and Feedback widgets: let users voice their direct feedback on a page or even for a specific page element.
Finally, remember this: following a product experimentation framework is a cyclical process. When you complete one experiment, you’re building a foundation and collecting data for the next one. And when you learn how your users react to product changes and why, you’re laying a permanent foundation for a successful, customer-obsessed product.
Learn how your users feel about product updates
Use Hotjar to run experiments with confidence and understand not only what works best for your customers, but also why.