Learn / Guides / Intro to Trends
Hotjar Trends: what is it and why is it useful?
Hotjar’s new tool, Trends, helps you spot patterns in user behaviors and understand your metrics on a deeper level.

When your team is trying to make better product decisions, keeping a close eye on key metrics in your analytics tools can be a great help. But metrics alone won’t show you the trends developing over time—or tell you why they’re happening.
That’s why we’ve launched Hotjar Trends, a new tool that helps you identify and understand patterns in user behavior.
Let’s explore what Trends is, and why it’s useful for your team.
Get the answers you need
Hotjar shows you exactly what users are doing, then lets you look further into the behavior of the segments that matter most.

Why understanding patterns in user behavior is crucial
Analytics tools help you find out how users are responding to features, products, and campaigns.
However, these tools rarely give you the complete picture of what’s happening, and can leave you with more questions than answers.
For example:
When you update your product, you might notice usage patterns change—but numbers alone won’t tell you why
When you’re running A/B tests or a new marketing campaign, you gather raw data about sales. However, the data alone doesn’t show you the reason a marketing initiative succeeded or failed.
If you’re using a behavior analytics platform like Hotjar, you can rely on tools like our Heatmaps, Recordings and Feedback to make sense of your findings. By combining your quantitative and qualitative data in this way, you can (theoretically) zero in on important opportunities and issues.
However, this is easier said than done, because…
Digging through the data can be overwhelming
You’re already using platforms like Google Analytics to measure key metrics like conversions, average session duration, and average order volume.
When you notice a change in behavior, like a drop in conversions, you can use Hotjar tools like Recordings to dig deeper. But looking through hundreds or even thousands of recordings to find ones related to the issue could take hours—or days.
Custom metrics can be hard to track
When you’re really trying to get answers from your data, you might need to look beyond metrics like sales or clicks. For example, you might need to know:
How many sales you got in the last year from existing customers vs new customers
What percentage of users on mobile devices made u-turns on your site in the last three months
How average time on site varies for low lifetime value customers vs customers who previously spent over $500
The better you can segment your data, the more likely it is you’ll get useful insights. But generic tools like Google Analytics make it hard to track custom metrics, especially if you’re cross-referencing multiple data points.
Using multiple tools can be cumbersome
There are many great tools out there that can help you identify behavior trends. For example, you could use Mixpanel to create a graph of a segment’s behavior, and then look at recordings from the same segment in Hotjar.
If you’re using Hotjar, our Mixpanel integration (via Zapier) will speed up the process. But using multiple tools for your analyses is time-consuming and costly—and all too often, it simply doesn’t work well.
Hotjar Trends gives you a smarter way to identify and understand behavior patterns
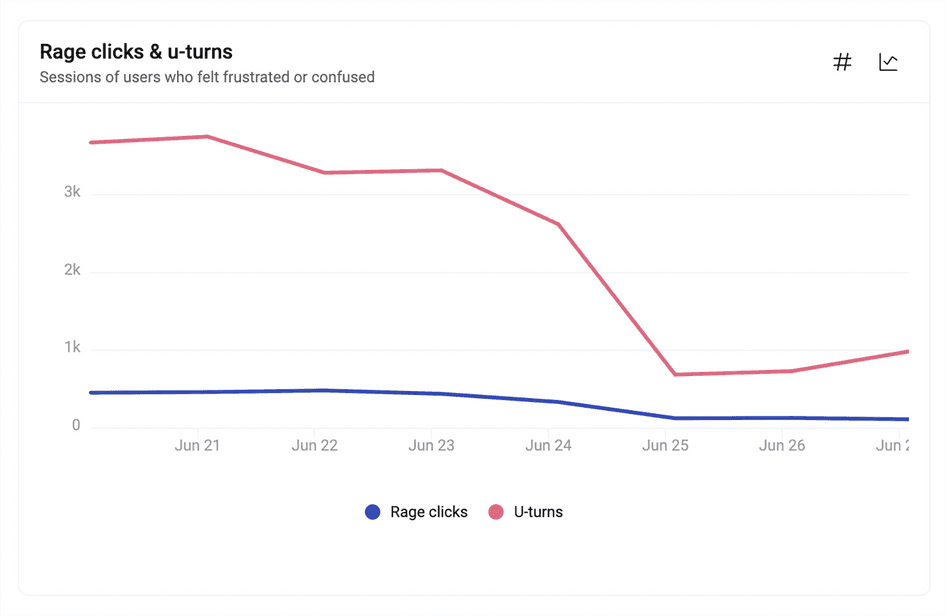
With Hotjar Trends, you can select the metrics that matter most to you and see how they change over time. The tool lets you create handy visualizations, so you can identify significant spikes or dips in key metrics.
You can use filters, Events and User Attributes to create custom metrics—like customers abandoning their shopping cart, or users rage-clicking on your sign-up page.
Trends also instantly shows you heatmaps, recordings, and feedback related to the spike—so you can find the “why” behind those behavior patterns.
So, how does Trends actually work?
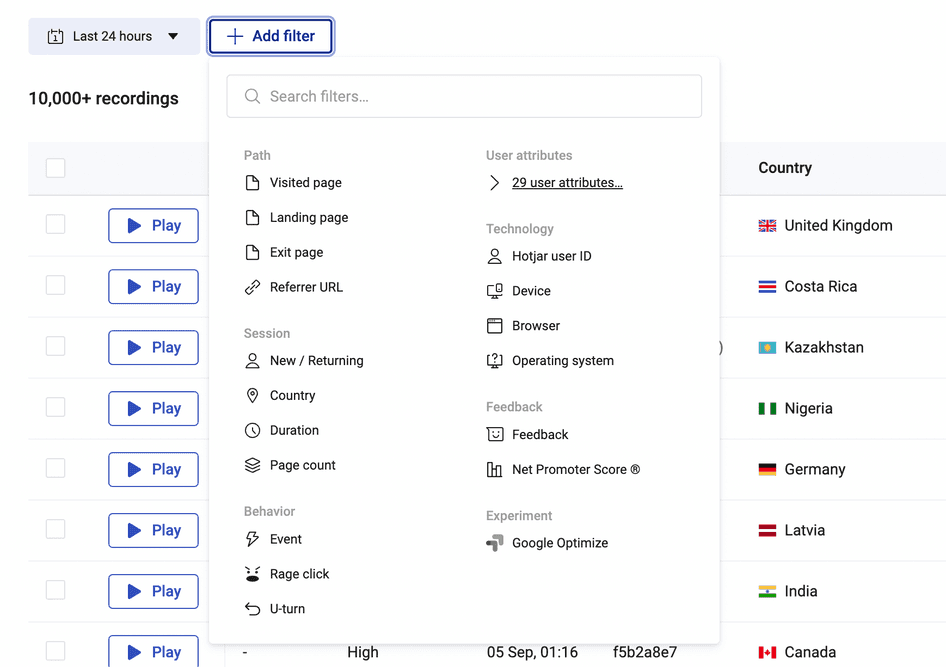
It helps you home in on the data you need
Within the Trends dashboard, you can select the data you want to look at, like:
Users who visited from a specific traffic source or country
Users who showed signs of frustration, like rage clicking
Customers who spent over $500
These are just a few examples of the countless ways you can filter your data. You can combine filters to identify any conceivable audience segment, based on traffic source, viewing device, user actions, and much more.
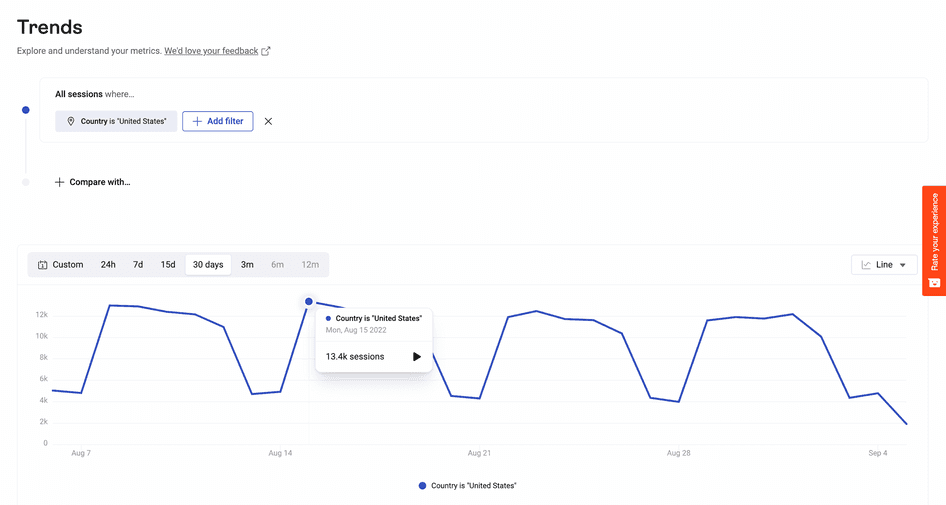
It visualizes your data in handy charts
Trends gives you the option of presenting your data in line, bar, or pie charts, so you can get key insights without manual number-crunching.

It lets you compare key metrics and segments
Trends allows you to create line graphs with multiple datasets, so you can make quick comparisons of behavior over time.
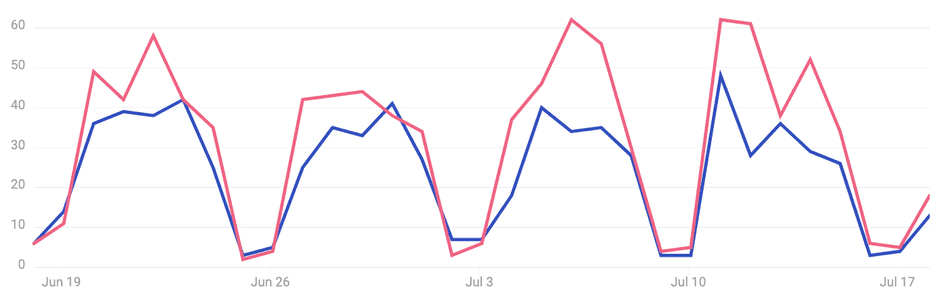
This is ideal when you want to understand how your A/B test variations performed or look for differences in how key audience segments behave.
It enables you to dig deeper into Hotjar data at key moments
When there’s a spike or dip in user behavior, Hotjar data can help you understand the “why” behind the change.
In viewing the visualization, you’ll be able to bring up recordings and feedback from a specific moment, or heatmaps for a specific page and audience.
5 ways Hotjar Trends helps you make better decisions
Trends takes your product experience insights to the next level by giving you access to qualitative and quantitative data in the same place. Let’s take a closer look at how this helps you in the long run.
1. Identify important changes in user behavior faster
With handy visualizations provided in Trends, you can spot significant patterns in what users are doing over time.
For example…
On your ecommerce site, Trends shows you that one of your best-selling products had two major dips in sales over the last year
For your SaaS product, Trends reveals an increase in rage clicks on your trial sign-up page over the last three weeks
Without Trends, you’d need to plot this data into graphs manually using spreadsheets—so long, lunch break!
2. Keep an eye on your custom metrics
With Trends, you can combine multiple filters to create visualizations of almost any metric, then see how it changes over time.
Plus, you can use Hotjar Events to filter for specific actions, like a user unsubscribing or logging in. Refine your filtering even further with User Attributes to analyze specific segments, such as customers based in France or free-trial users.
3. Compare usage metrics across segments
Using Trends, you can quickly create custom visualizations to analyze (and compare) how your user groups behave.
For example…
When you’re A/B testing a new page, create a visualization to see if each variation performed better on mobile or desktop
When you see a spike in rage clicks, compare line graphs for new users vs. old users. If new users rage-click more, you might have a problem with a recent change to your website.
4. Quickly find the “why” behind key behavior patterns
When you notice a pattern in your data, the next step is to investigate further. But when you have thousands of recordings or feedback responses to sift through, it’s not easy to pinpoint the data points that will answer your questions.
With Trends, you can bring up the most relevant Hotjar data with a single click to reveal the “why” behind user behavior patterns. For example:
5. Customize your Hotjar dashboard
Need to keep track of an important metric, like weekly active users or clicks of your call-to-action (CTA) button?
With Trends, you can create that visualization and pin it to your Hotjar dashboard. You’ll be able to see any important changes at a glance, so you can respond to opportunities and issues faster.
Who can benefit from using Hotjar Trends?
The Trends tool is available on our Observe Scale plan. Almost anyone can benefit from using Trends—especially if you want to compare data from Hotjar tools over time.
Trends is particularly helpful if you are…
Looking to keep track of custom metrics that aren’t available in other tools: for example, because Google Analytics doesn’t track the metrics you need to identify behavior patterns
Frequently experimenting with new ideas on your website or app: Trends shortcuts the process of finding the right recordings and heatmaps so you can assess your results faster
Give more meaning to your insights
The chances are that there are incredible product experience insights hidden in your data: the kind that show you where users experience problems, what grabs their attention, and how you can serve them better.
Trends helps you uncover these insights by identifying and understanding key behavior patterns in a flash. That means less time digging through data—and more time building products and experiences your users love.
Unearth the hidden insights in your data
Use Hotjar Trends to bridge the gap between your qualitative and quantitative data, so you can find the user insights you’d otherwise miss.