Learn / Guides / A/B testing guide
How to conduct effective, user-centered A/B testing in 5 steps
In an ideal world, digital businesses test everything they ship, enabling teams to make informed decisions that drive fortunes. In real life, companies strive to meet this standard by cultivating a culture of experimentation—and that means A/B testing specific ideas on a control group and measuring their impact.
This ensures two helpful things happen: good ideas mature and develop fully, and bad ones go back to the drawing board.

This guide shows you how to conduct effective A/B testing to consistently ship website changes your users love.
It gets better! Our detailed walkthrough also explains how to know which version is winning users' hearts and uncover why that’s the case. Spoiler alert: the key to unlocking the why lies in using complementary tools like Hotjar (yes, that's us!).
Excited to see how? Let's begin.
Run A/B tests with confidence
Collect valuable qualitative insights during experiments and learn which versions are winning—and why.

How to do A/B testing the right way: 5 steps for success
A/B testing, sometimes called split testing, is your best bet in setting the direction for your teams—whether that's devs, user experience (UX), product, marketing, or design. While relatively simple to set up, impactful A/B testing involves more than you think.
Combining test results with recordings, heatmaps, and user feedback tools allows you to evaluate performance, spark new ideas, and encourage user-led innovation like never before. It also reduces the time needed to run tests that yield valid, actionable results—but more on that later.
First, let’s look at how to run A/B testing the right way in five easy steps.
Step 1: formulate an evidence-based hypothesis
It all starts with an idea. For example:
A streaming platform wants to update its personalization system to help users find more content, with the goal of boosting customer satisfaction and retention
An ecommerce store wants to streamline the sign-up flow for new users, leading to a potential sales uplift
But an A/B test must run on more than assumptions. It requires some informal research—digging into available data to generate ideas worth testing. Commonly, teams formulate a hypothesis based on blended quantitative and qualitative insights—like top exit page lists combined with exit-intent survey responses.
🧪 What makes a good hypothesis?
A good hypothesis is an educated and testable statement that:
Proposes a solution or explanation to a problem
Predicts an outcome for the experiment
Provides reasoning for the expected result
Here's a sample hypothesis we grabbed from Netflix:
If we make change X, it will improve the member experience in a way that makes metric Y improve.
When the user experience (UX) wizards at Netflix were planning to test the 'Top 10' lists we see on the web user interface (UI), the hypothesis went:
Showing members the Top 10 experience will help them find something to watch, increasing member joy and satisfaction.

Step 2: select your A/B testing tool
Next, find a suitable A/B testing tool to run your experiment. Here’s a quick rundown of some of the top options:
4 most popular A/B testing and product experimentation tools
1. Google Optimize
Google Optimize is a free platform for website experimentation, specifically A/B testing, multivariate testing, and redirect testing. Powered by advanced targeting options, it allows you to test multiple changes on a single page, compare their performance, and measure the results against a company objective.
👍 Pros:
Easy to set up and use
Integrates well with Google Analytics
Includes qualitative data in your experiments (you’ll need to select third-party insights tools like Hotjar)
👎 Cons:
Has limited customization options
Will sunset in September 2023
2. Optimizely
A leading experimentation platform, Optimizely enables even non-developers to run A/B and multivariate tests on their websites. Its user-friendly interface and intuitive UX cater to a broad range of users, including designers and marketers.
👍 Pros:
Facilitates effective reporting
Triggers surveys in test variations
Enhances conversion rate optimization (CRO) efforts
👎 Cons:
One of the pricier options
3. Omniconvert
Omniconvert is a complete CRO platform offering A/B testing, web personalization, on-site surveys, and advanced segmentation. Mix and match 40 segmentation parameters, such as your visitors' geolocation and on-site behavior, to run a specific experiment for a target audience.
👍 Pros:
Ideal for product and ecommerce teams
Adds qualitative data to experiments
Offers excellent personalization options
👎 Cons:
Can get buggy at times
4. Hotjar
Hotjar (hi again!) is a digital experience insights platform that supplements your A/B tests and helps you identify real opportunities for improvement. Integrating Hotjar with an A/B testing tool (find the tips and tricks below) or using it independently allows you to monitor your tests and make data-driven decisions.
Instead of listing Hotjar's pros and cons, we’ll give the floor to our actual users: 👉 read their reviews here.
Note: steps 2 and 3 are interchangeable. You can decide on the nitty-gritty of your test before settling on a tool with all the features you need to run your experiment effectively.
Step 3: set up your experiment
Remember, your hypothesis clarifies what you're trying to change and the primary metric you're measuring. When you finalize your hypothesis, proceed to:
Create two versions of…something. Anything!—an email subject line, a call-to-action (CTA) button, or a landing page layout. The baseline or 'control' version A displays the incumbent element, design, or page. At the same time, ‘variation’ B deploys with the change or group of changes you want to study. Both versions should be identical in all other ways.
Take a subset of your users or members to act as your sample. Then, split your sample evenly into two groups using random assignment. One group sees the control version, and the other encounters the variation.
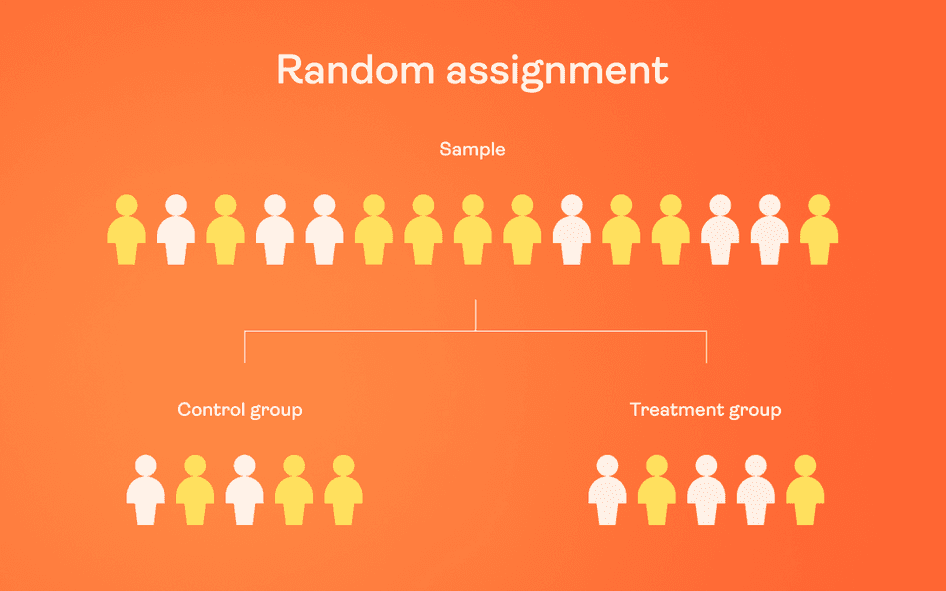
Decide what your confidence level should be. Confidence level determines how sure you can be of your results. In market research, it's common to use a 95% confidence level. This means if you ran the experiment 20 times, you'd get the same results (with a margin of error) about 19 times.
Determine the sample size and timeframe for your split tests. Depending on your A/B testing tool, you can set the sample size and test duration. If you need help deciding what to choose and there's no analyst to ask, try this sample size calculator.
Set up and run your experiment on your chosen A/B testing tool. A/B test landing pages, CTAs, headers, and other variables one at a time for the same marketing campaign to ensure the causal chain will be linked back to a specific change or set of changes instead of a jumble of factors.
Step 4: analyze your A/B test results
When analyzing test results in your A/B testing tool, paying attention to statistical significance is super important. You don’t want to push forward with a version that only appears superior because of a sampling error or random chance. Generally, a statistical significance of 95% indicates you have a clear winner to give the go-ahead.
Celebrate if you've got a statistically significant outcome, disable the losing variation in your A/B testing tool, and move forward with the winning version! 🎉
But what if neither variation is statistically better? In that case, you'll have to mark the test as inconclusive, indicating that the variable you tested didn't significantly impact the results.
Don't worry, you can still learn from the experience: stick with the original version or use the failed data to help you create a fresh iteration for a new test.
For instance, imagine your ecommerce marketing team just finished A/B testing two different product page layouts. You've collected data on click-through rates, add-to-cart rates, and sales, but the results show no clear winner.
Now what?
You could take a closer look at the data to see if there are any user subgroups that respond differently to the variations. Or, you could try a new test with a different variable, such as one involving alternative product descriptions or pricing strategies.
💡Pro-tip: running A/B tests can reveal what users like or dislike about your website, products, or services. But they lack the context—the answer to why customers prefer one variation over another. Behavior analytics platforms help you confidently fill in the gaps and better understand user behavior and preferences.
Through Hotjar’s integrations, you can view recordings and heatmaps or trigger surveys for your Google Optimize, Optimizely, and Omniconvert experiments.
Now, you’ll be able to gather qualitative insights into, say, your homepage redesign from a subset of your users before you spend all the time, money, and effort rolling it out to the masses.
Using Hotjar to show a survey to an Optimizely variant
Step 5: view session recordings of your experiments
With the help of complementary A/B testing tools offering deeper behavior analytics insights, look at session recordings to see exactly how users interact with your experiment variant—where they move, what they click, and what they ignore.
This way, you won’t just know which version is the winner—you’ll also know exactly why.
Here are some ways to analyze your recordings and add qualitative insights to your product experimentation method:
Keep an eye out for engagement and expected behavior, but also note any unexpected signs of friction, like rage clicks
Follow the visitor's path throughout the recording to see where the tested element fits into the user journey and if it's making the experience easier or changing the trajectory
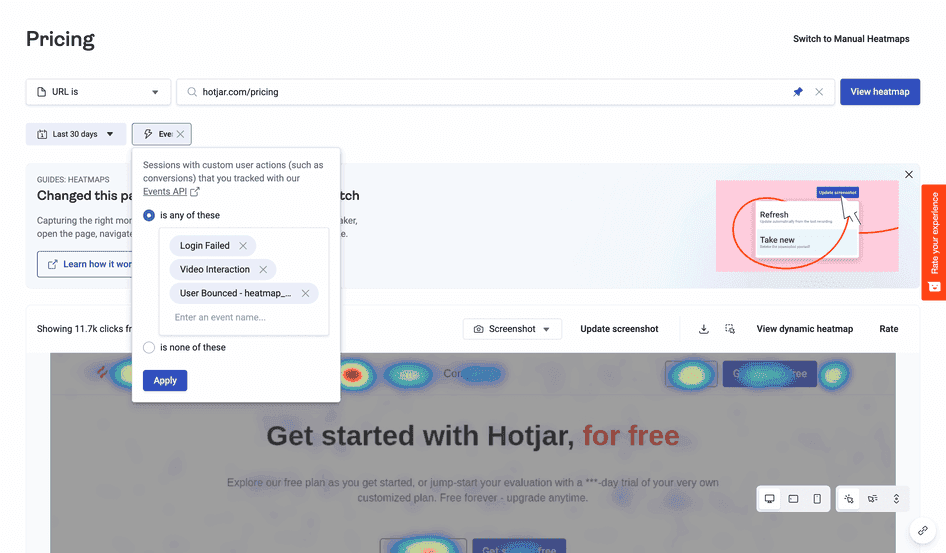
💡Pro-tip: use recordings and heatmaps with Hotjar’s Omniconvert integration. Once enabled, Hotjar saves your Omniconvert session recordings as events—user actions or changes that occur on your website, such as clicks, scrolls, and typing.
Events (green lightning bolts) in a Hotjar recording’s events timeline
Hotjar uses these events to trigger session capture, display feedback widgets or surveys, and filter collected data to reveal further insights.
With events in place, you can filter relevant Omniconvert recordings from the playback list by experiment ID, experiment name, variation ID, or variation name.
Further, generate heatmaps of your experiments by:
Going to the Heatmaps page
Adding a new heatmap for the relevant URL
Repeating the filtering process for session recordings
Clicking 'Apply' to finish creating a heatmap of the corresponding experiment ID
Interested in trying it out? Here’s our guide on how to integrate Hotjar with Omniconvert.
A/B testing best practices with Hotjar
As we mentioned, you can also set up Hotjar's tools outside of the integrations to help monitor A/B tests and add depth to your A/B testing with the qualitative data these tools provide. You'll know what to do (or not do) next, ensuring no resources are wasted on ineffective changes.
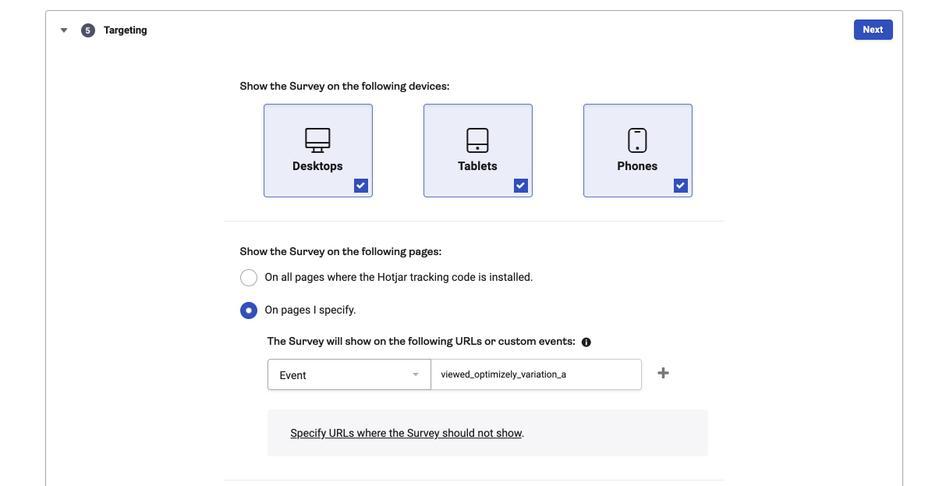
Show a feedback widget or survey on a variant
Get user feedback on a specific page variant with Events in Hotjar. In this case, add the relevant event code to trigger the feedback widget or on-site survey.
Keep in mind that events take priority over URL-based targeting rules, so they'll show up regardless of any URL-specific rules you've set.
Need help setting up events? Check out our Events API documentation.
Compare heatmaps for your control and variant
Track your A/B test using heatmaps, depending on the following conditions:
When your variations are on the same URL: this means your A/B test is set up to randomly load any of your two variations for each user visiting the same page. In this case, use Events in Hotjar. Set up unique event names for your control and variant and apply session filters to view their corresponding heatmap.
When your variations are on different URLs: use the heatmap URL filter to track data for each variation. Select a heatmap URL filter and enter your control URL and/or variant URL, then view the corresponding heatmap. Here are the guidelines on how to choose the correct heatmap URL filter for your control and variant.
Note: implementing Events in Hotjar may involve adding JavaScript to your site or using Google Tag Manager or Segment. Read more of the technical stuff here before getting started.
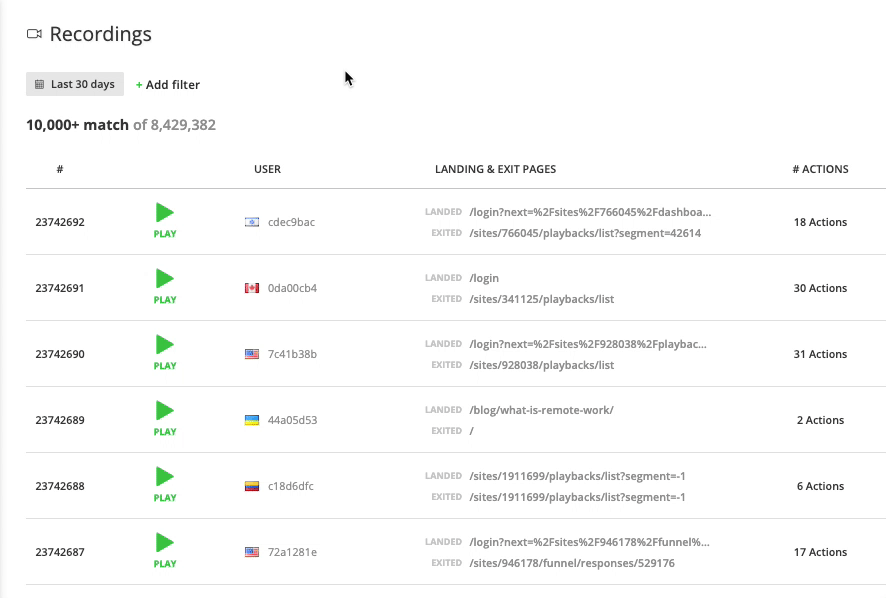
Watch recordings of users exposed to the variant
Recordings show you how users behave on your site or page variations firsthand. Hotjar's Events API passes an event to Hotjar whenever users land on a specific version of an A/B test page. Use the event filter to isolate sessions where a particular variant was visited and see how people interacted with it.
💡Pro-tip: through the Optimize integration, Hotjar seamlessly recognizes and captures recordings of Optimize experiments on your site. You can then easily filter these session recordings by test variant.
Enter the Google Optimize experiment ID whose recordings you want to watch (Hotjar picks up experiment IDs instead of names). If you're unsure which one to use, find the matching experiment ID on your Google Optimize dashboard.
How to filter Optimize experiments from your recordings playback list on Hotjar
We have around 17,000 shops hosted on our site, if you consider the free users, and that’s a lot of data. With that in mind, we set out to study the pages with a similar layout and flow, such as the checkout page. Hotjar helped us gain insight into how people use our features and where we can improve them for our clients. That means conversion improvements—and happier customers!
Deliver conversion-driven changes consistently
Now there's nothing left to do but to take those steps. Start A/B testing even the tiniest tweak before shipping it to your entire user base. And combine multiple sources of qualitative data, like heatmaps, session recordings, and user surveys, to uncover even more opportunities that aren’t obvious when looking at test results alone.
Ensure you're not making changes that could hurt your conversion rates or user engagement—and waste precious company resources—when you enhance your experiments with Hotjar.
Run A/B tests with confidence
Collect valuable qualitative insights during experiments and learn which versions are winning—and why.