Learn / Blog / Article
Introducing new features and UX improvements to Hotjar Funnels
We launched it, you tried it, and we’ve been improving it based on your feedback.

Since we launched Funnels last February, we’ve been collecting user feedback on what you’d like to see in the tool so we could prioritize new features.
You told us that when using Funnels, you’d like to
Save your funnels to Dashboards to view them later
Compare conversion rates across audiences and filters
Add more steps to each funnel
Visualize the data in different ways
Create funnels faster
Well, we listened, and made ALL of that possible, and more. Now you can
Understand where and why your users drop off
Discover where users get stuck throughout your conversion flows and understand what’s preventing them from converting.

Save funnels to the Dashboards
We know building the perfect funnel is a high-effort task. It takes time. And of course you don’t want to go through the same process every time you need to conduct funnel analysis.
Until now, the only way to view one of your existing funnels was to bookmark its URL. Not a great user experience, we admit. 🤦
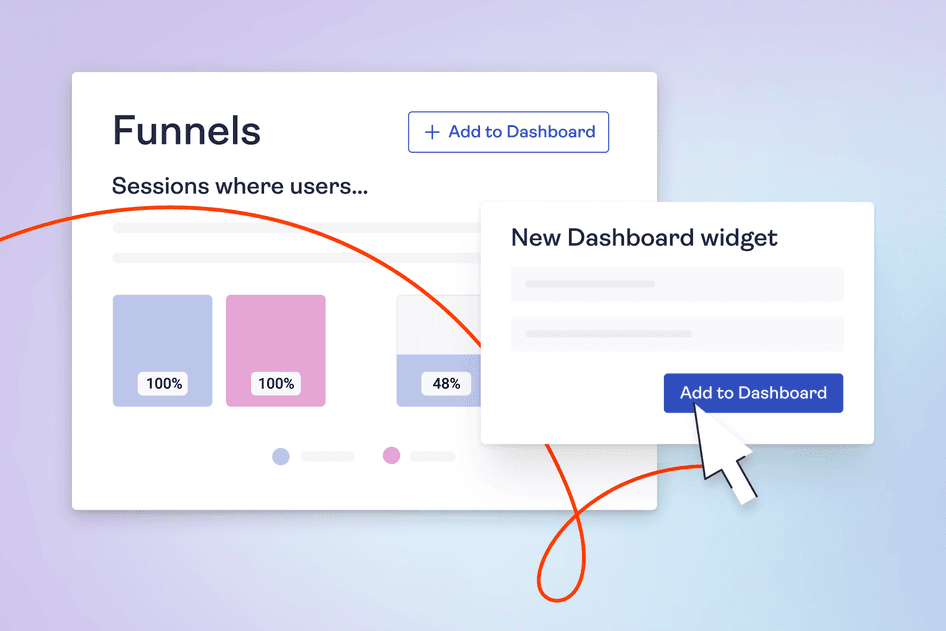
Now, with the 'Add to Dashboards' button, you can create your funnel once and save it to your Dashboards.
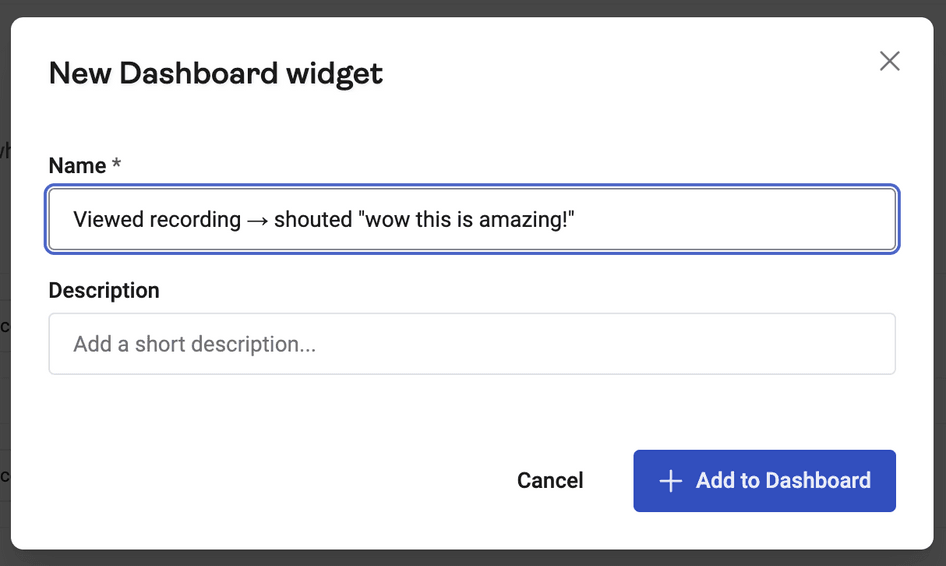
Why it’s useful: every time you need to check how your conversion rates are doing, the funnel will be there, waiting for you. No need to build the same funnel over and over.
Of course, your needs may change over time. That’s why you’re also able to:
Move your funnel where you want on your Dashboards
Delete it with a single click
💡Pro tip: those funnel widgets in your Dashboards support all the functionalities that make Funnels an invaluable tool, including
Watching recordings of conversions or drop-offs
Keeping the filters that were applied when the funnel was saved
Saving the comparisons that were applied when the funnel was saved (more on that below)
Viewing the funnel data in the format it was displayed when the funnel was saved (more on that below too)
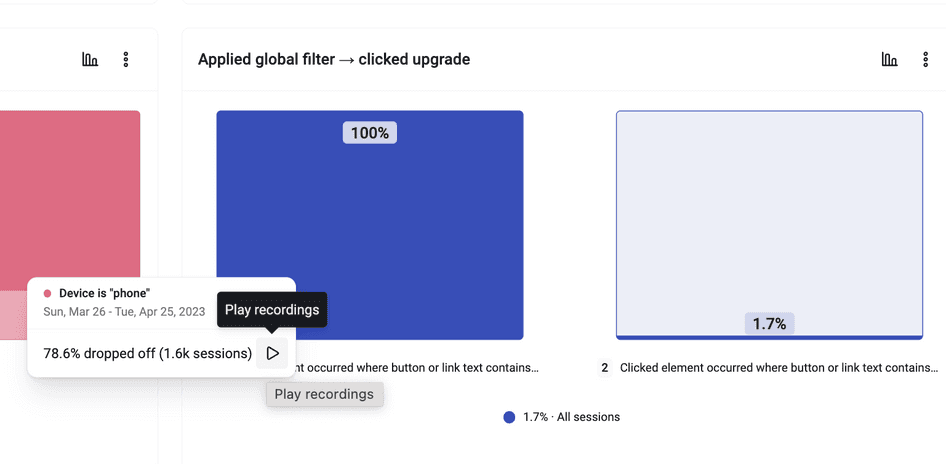
Compare conversion rates across audiences and filters
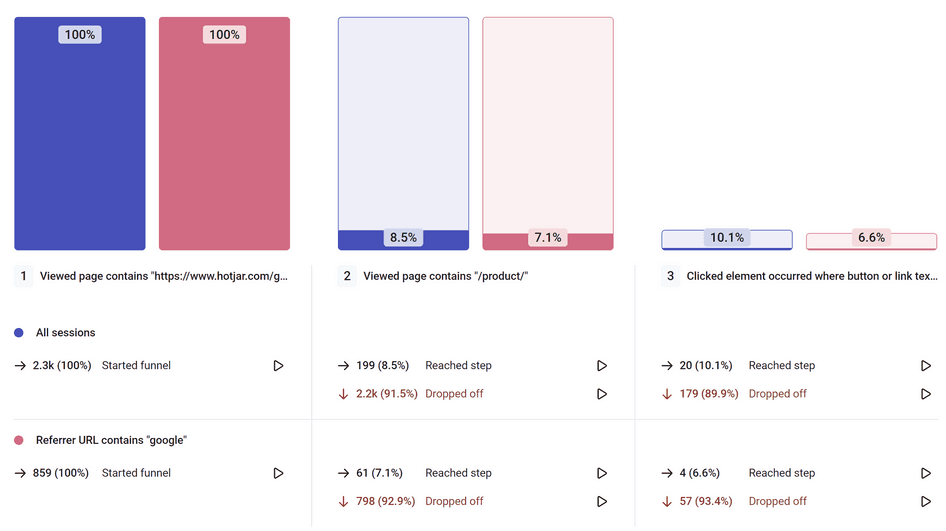
Why it’s useful: not all users engage with your product or service the same way. You’ve told us you want to compare conversion rates and user behavior for different segments.
Now, rather than building a different funnel for each user segment (as you had to when we first launched Funnels), simply set up a comparison in a single funnel with the filter groups.
For instance, compare conversion rates (and churn rates) between
A control version and a variant during an A/B test
New vs. returning users
Different marketing channels, by using the traffic channel filter to compare UTM parameters
High-tier vs. low-tier plans, if you’re tracking this with user attributes
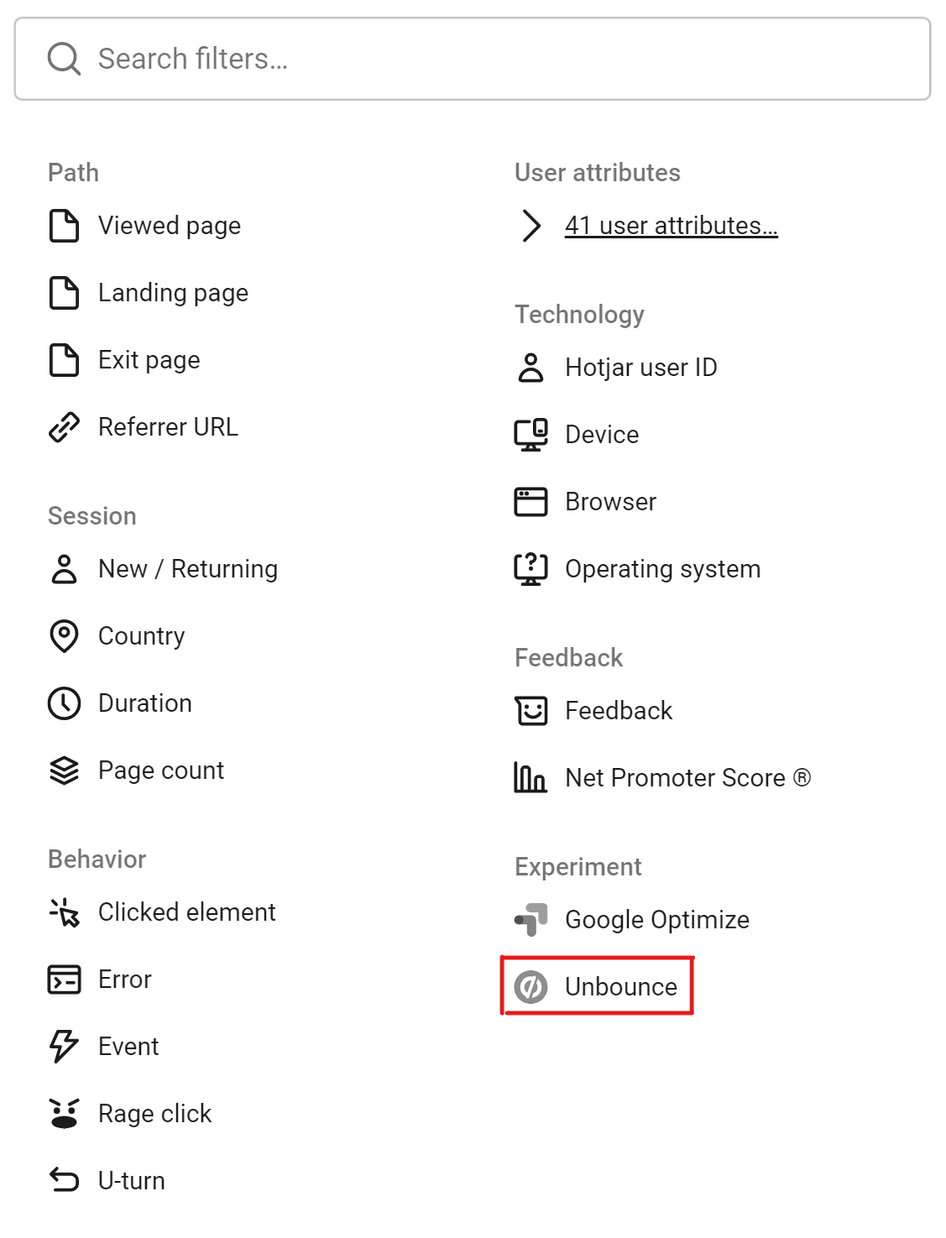
💡Pro tip: if you're trying to optimize your landing pages with the Hotjar and Unbounce integration, compare how different variants perform with the Unbounce experiment filter in Funnels.
View funnel steps in Recordings
When we built Funnels, we wanted to give you a key to not only help you measure your conversion rate, but also understand why it dropped or increased. That’s why we made it possible for you to zoom into session recordings to see through your users’ eyes where they get stuck.
But some of you shared some very valuable feedback with us, letting us know it’s easy to get lost once in the recording:
Where are the steps you defined?
When did the user reach the drop off point exactly?
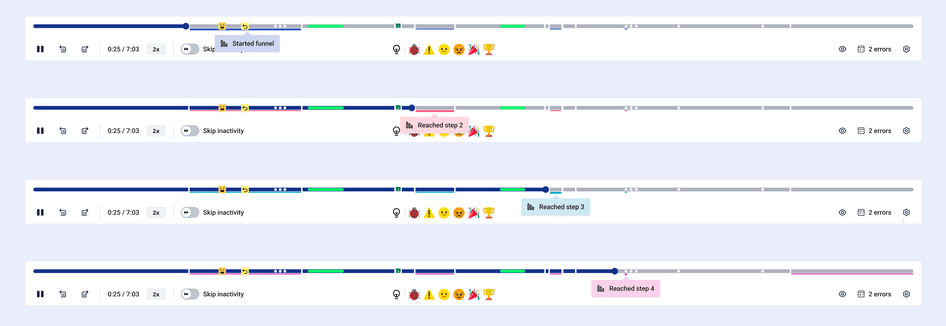
Now, when you zoom into a user session, you’ll see all of your funnel’s steps directly in the timeline.
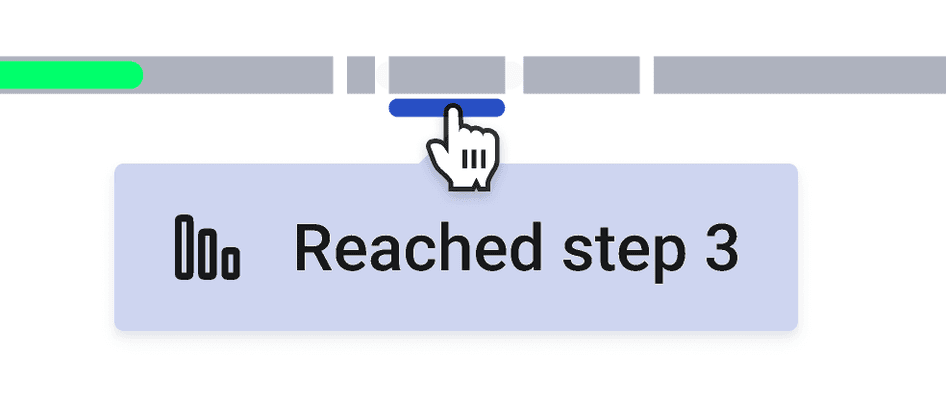
Why it’s useful: by highlighting the funnel steps right in the recording’s timeline, it’ll be easier for you to spot the moments the user progressed along the funnel—or got stuck.
This lets you understand precisely why a user dropped off and identify improvement opportunities.
💡Pro tip: did a user run into a website bug at the drop-off step? Connect Hotjar with Jira to report and resolve the issue faster. By automatically attaching the recording to the card, you’ll be giving your developers all the context they need to prioritize and fix the issue.
Understand where and why your users drop off
Discover where users get stuck throughout your conversion flows and understand what’s preventing them from converting.
Add up to 10 steps to each funnel
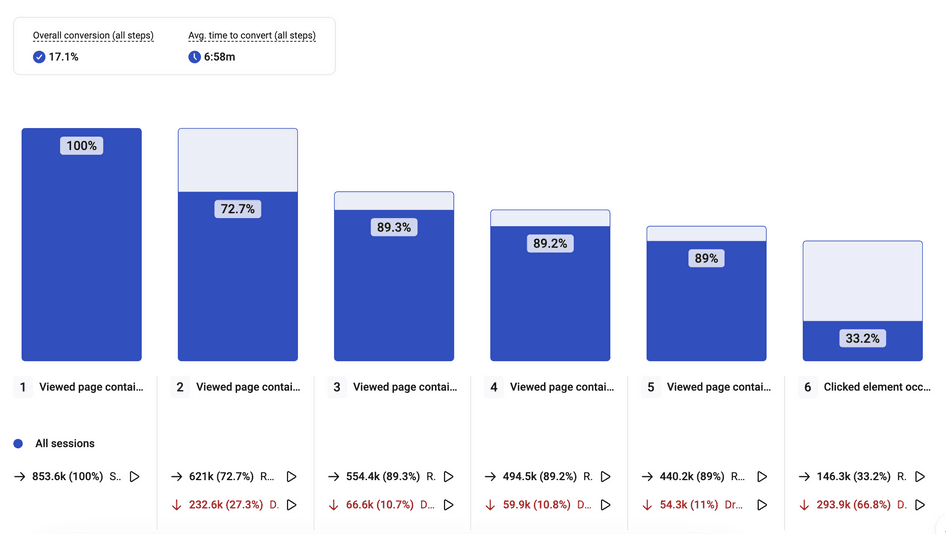
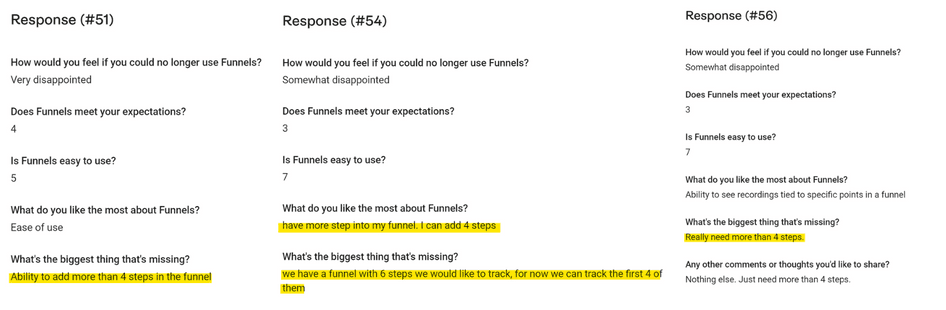
Upon release, you could only add up to four steps to your funnels. This has been one of the main pain points you’ve experienced.
We’ve heard you, and have increased that limit to ten steps.
Why it’s useful: some conversion flows are longer than others. If you can’t add all the steps in your customers’ journey, you’re going to miss out on key insights.
Instead of creating several funnels to cover the entire flow, or worse, skipping steps altogether, you can now view conversion rates for up to ten steps and investigate why users drop off in a single funnel.
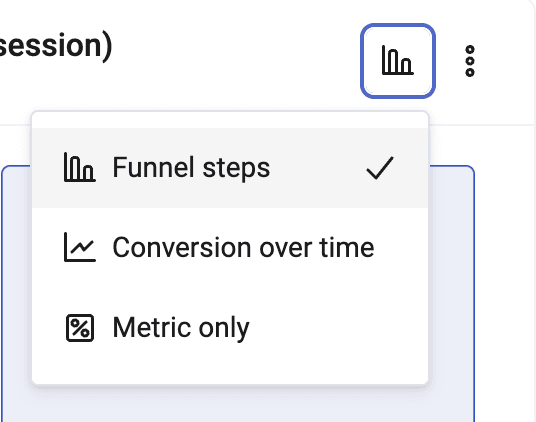
Visualize funnel data as steps, conversions over time, or metrics only
We’ve added two more views to Funnels to help you visualize your data in the way that matters to you. In addition to the default ‘Funnel steps’ view, you can now track
Conversions over time
Metric only
Why it’s useful: funnel steps are only one way to look at your conversion data.
If you want to view how your conversion rate evolves over time to identify when it dropped (or increased!), you can now easily do so with the ‘Conversion over time’ view. And just like with the default view, you can jump straight into recordings to understand why that change occurred.
Likewise, maybe you’re more interested in knowing the average conversion rate of your funnel to get an overview of its overall performance at a glance. The ‘Metric only’ view lets you do just that.
💡Pro tip: in addition to the default ‘Funnel steps’ view, add both the ‘Conversion over time’ and ‘Metric-only’ views of the same funnel to your dashboard so all the key metrics will be at your fingertips.
Reorder and duplicate steps and filter groups to create funnels faster
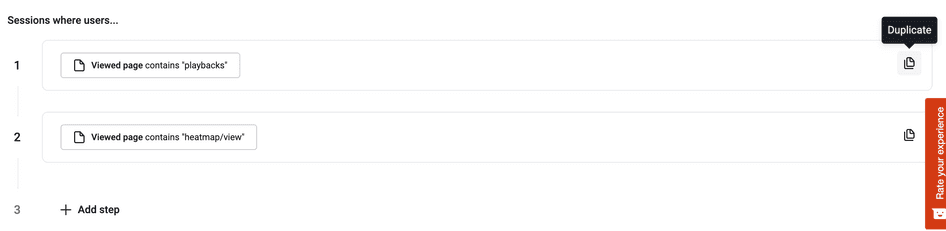
You no longer need to create each step from scratch. If two or more steps are similar, simply create it once and duplicate it.
Similarly, when using filters in Funnels (or Trends), you can now duplicate filter groups.
Why it’s useful: this improvement saves you time when building your funnels, so you can spend more time analyzing data and gathering actionable insights instead.
It also lets you make comparisons much faster. For instance, as a product manager, you might want to check the proportion of users who trigger a specific event and compare the data between the plans they’re on.
Instead of manually creating each filter, you can do it once, then copy the filter and just change the acquisition channel.
And that’s not all: what if you want to reorder the steps of your funnel? After all, customer journeys aren’t linear.
All it takes to do that in Funnels is to grab a step and move it around:
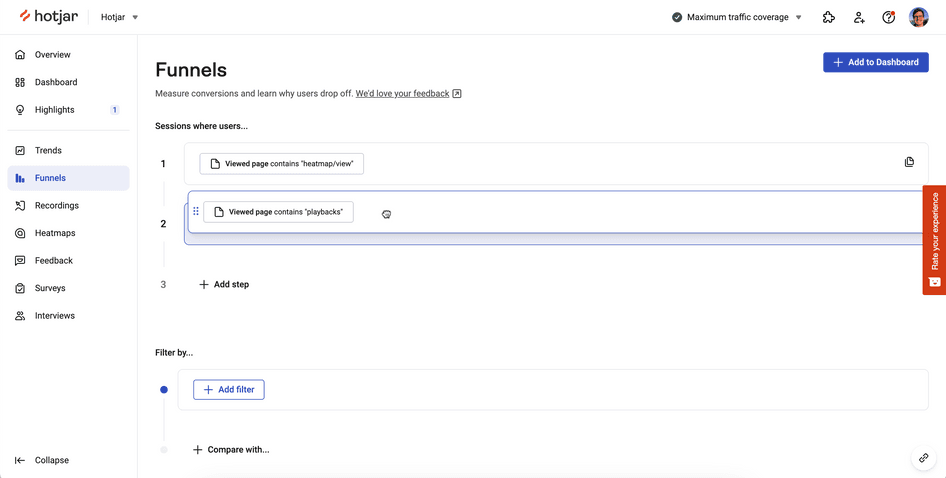
Why it’s useful: you might want to check in what order users go through your pages.
For example, as the product manager of a product with a multitude of features, you might be interested in learning the percentage of customers activating with Feature 1 first, then Feature 2, and compare it with the percentage of customers activating with Feature 2 first, then Feature 1.
This kind of precious insight informs how your activation campaign is doing and lets you get buy-in with your team when you suggest revisiting it.
Likewise, you can now also reorder folder groups.
🚀 Use case: at Hotjar, this allowed us to compare the percentages of users starting off with Recordings, then Heatmaps; vs. users activating with Heatmaps first, then Recordings.
We’re building Funnels for you
Are there more features you’d like to see in Funnels? We’re all ears!
Use the feedback widget on the right side of this page to tell us what else you’d like to be able to do in Funnels. 👉
Understand where and why your users drop off
Discover where users get stuck throughout your conversion flows and understand what’s preventing them from converting.
Related articles
Hotjar product updates
🔥 Read it while it’s hot: February 2024 updates in the Hotjar world
February’s update is all about frustration 😤
Hotjar team
Hotjar product updates
Say goodbye to the Hotjar Dashboard. Long live Dashboards.
Hotjar Dashboard is now Hotjar Dashboards—with an ‘s’. 🤯
Look, we get it. Every product and their dog has a dashboard. They’re not new.
But bear with us—this is way more exciting than it sounds. It’s one small ‘s’ for Dashboards, and one big win for your team.

Richard Roberts

Hotjar product updates
A year in review: how Hotjar revolutionized its suite for users in 2023
Hotjar team