Learn / Guides / Website problems guide
How to find (and fix) website bugs fast: your ultimate strategy for 2024
You don’t have to be a developer to know that combing through your website to search for issues after an update or redesign is not cool. Manually ensuring everything looks good and works correctly is humanly impossible, not to mention highly impractical. Read on for tips that make bug-hunting accessible—and painless.
This guide helps you automate the process of finding bugs with simple strategies that involve monitoring user behavior and interactions on your most critical web pages. We’ll teach you how to find website bugs and spot problems as they happen using a couple of creative methods you may not have thought of.
When regular bug-busting becomes part of your workflow, you and your team are free to focus on what matters most: understanding your users, resolving their issues, and meeting their needs consistently.
Uncover hidden issues with ease
Use Hotjar's tools to find and investigate bugs quickly, so your team can deliver fixes and delight your customers.

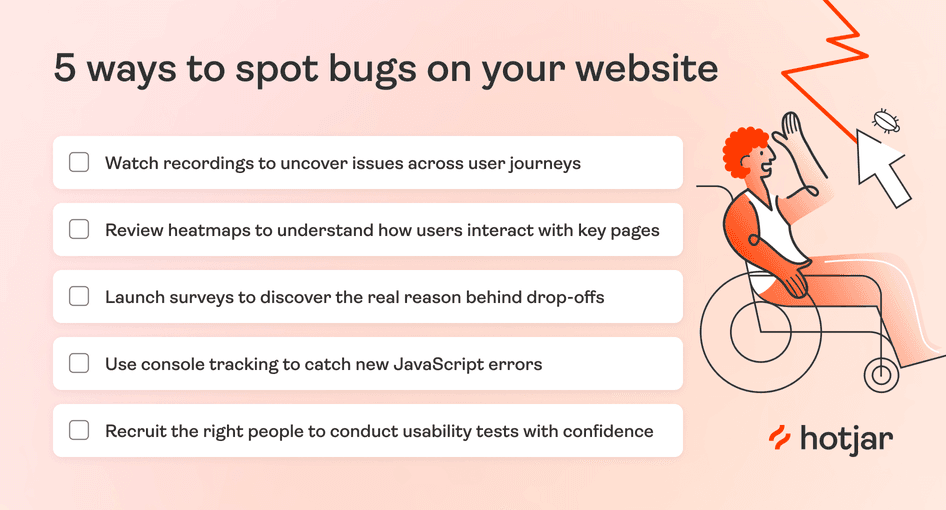
5 ways to spot bugs on your website
Let's dive right into what you came here for: how to find website bugs. We're also throwing in some tips on how to plan and prioritize a fix. Skip to what you need, or start from the top:
Note: this framework requires you to use specialist web application software like Hotjar (which you can use for free).
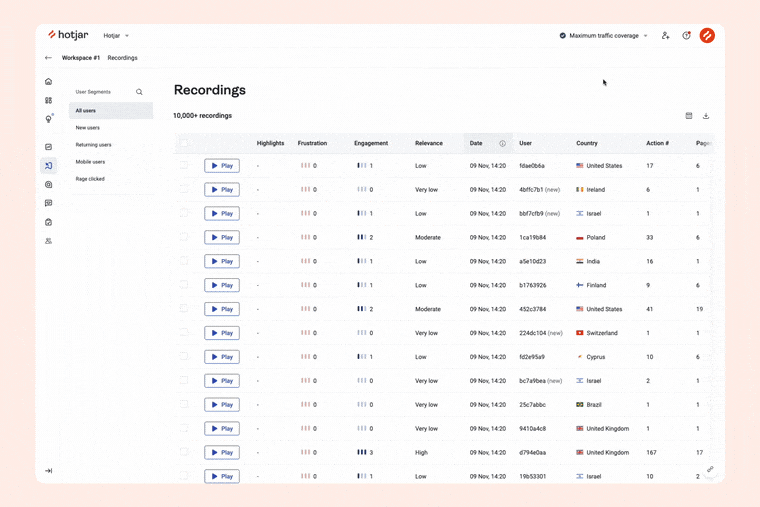
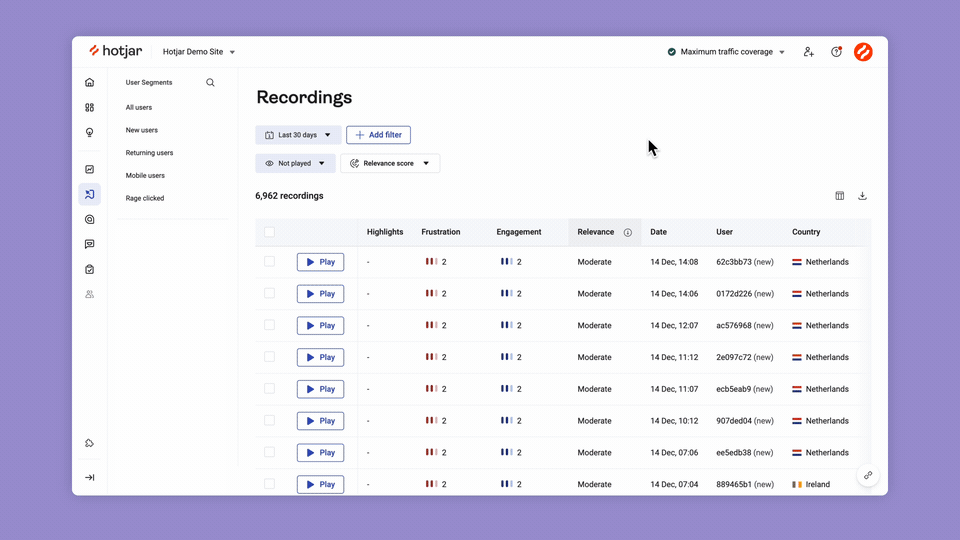
1. Watch session recordings to uncover issues across user journeys
Session recordings are video playbacks of real users interacting with your site. They let you see where users click, tap, scroll, and type—i.e. how they experience your website.
If you notice a rising bounce rate for your sign-up page, for example, watch recordings to pinpoint the source of the problem and the reason people bounce. It could be a functionality bug, like a broken call-to-action (CTA) button, or an issue that factors into website performance and search engine optimization (SEO), such as slow page loading times.
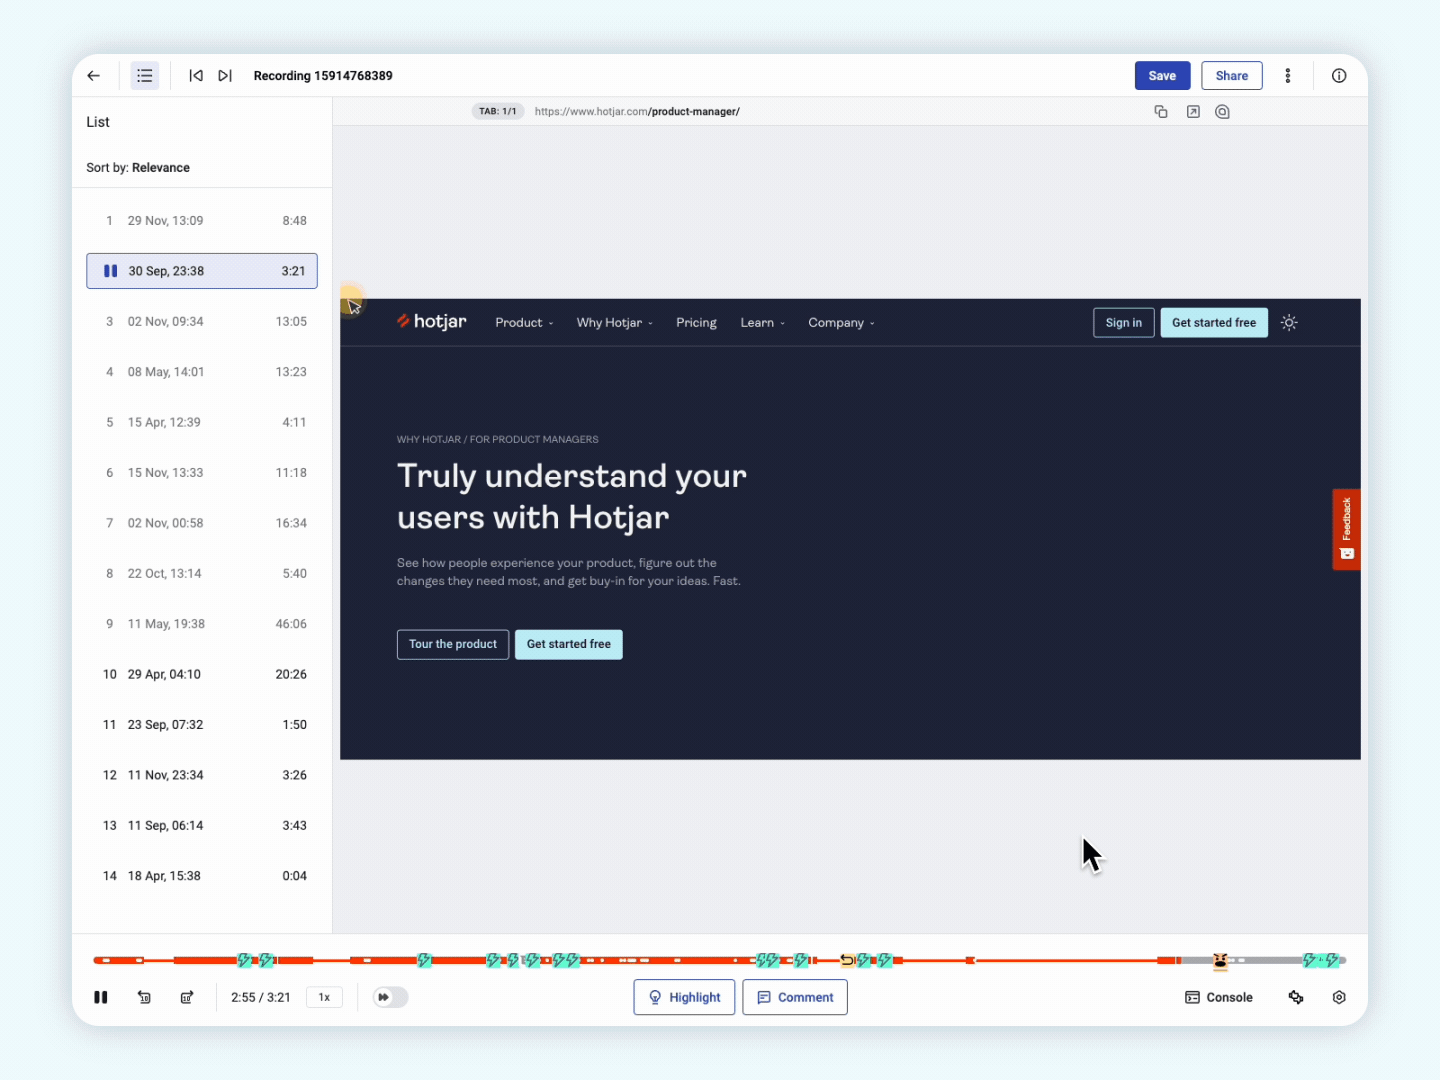
A snippet of a recording of a user journey on the Mighty Fine website
Use Hotjar Recordings immediately after rolling out an update or redesigning your site. Hotjar starts capturing sessions the moment it detects traffic on your website, and new recordings will appear on your Recordings List page.
If this is your first Recordings rodeo, follow our guide for setting up the tool and enabling Session Capture. 🤠
Let's take a closer look at how recordings help you discover bugs across different user journeys:
Fast-track your investigation by looking at frustration signals
Shorten the time you spend searching for the most relevant recordings with the frustration score, a handy feature on the Hotjar Recordings dashboard. It combines frustration signals like u-turns, rage clicks, or negative feedback users leave during their sessions.
The frustration score helps you instantly identify pain points by surfacing the recordings that matter in your problem-solving.
For instance, perhaps you’ve made an assumption based on feedback from a user on their checkout experience. To validate it, go to Recordings and filter by your checkout URL. Then, sort by frustration to see the list of recordings most likely to enhance your validation, prioritization, and development process.
Check out this page for more details about the frustration score, alongside another update called the engagement score.
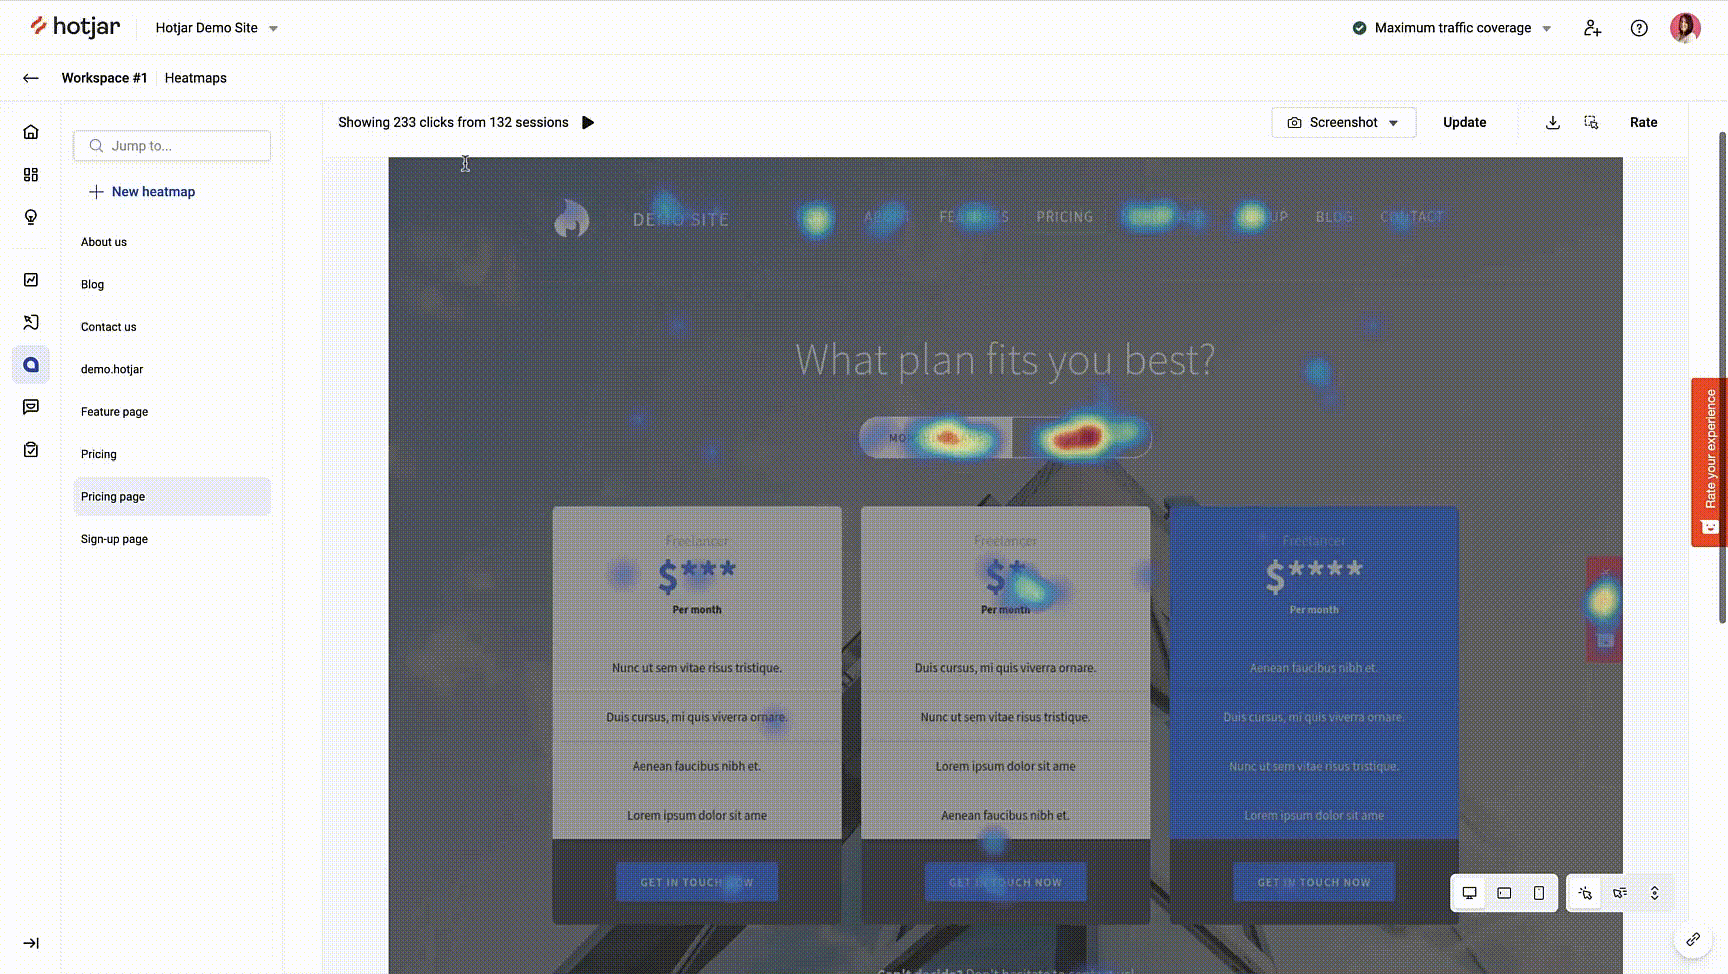
2. Review heatmaps of key pages to understand how users interact with them
While recordings show individual user journeys across multiple pages, heatmaps paint the big picture of how users behave on specific pages.
Visualizing visitor behavior at a larger scale allows you to quickly identify weak spots in your layout, navigation, content hierarchy, and CTA button placement. For example, after refreshing your layout, use heatmaps to visualize clicks and mouse movements above the fold to see if significant elements are noticed or ignored.
Let’s delve a bit deeper into how Hotjar Heatmaps help you catch user interface (UI) design and CSS issues—a crucial factor in driving website conversions:
Track user interactions pre- and post-launch
Use Hotjar’s two-step approach to analyze your website changes effectively:
Set up a heatmap on your most important pages before the changes. Valuable pages might include the sign-up page and the upgrade page (where you compel users to switch from a free/basic plan to a paid/advanced one).
Then, after making the changes, set up another heatmap on the same page(s) to compare the before-and-after versions.
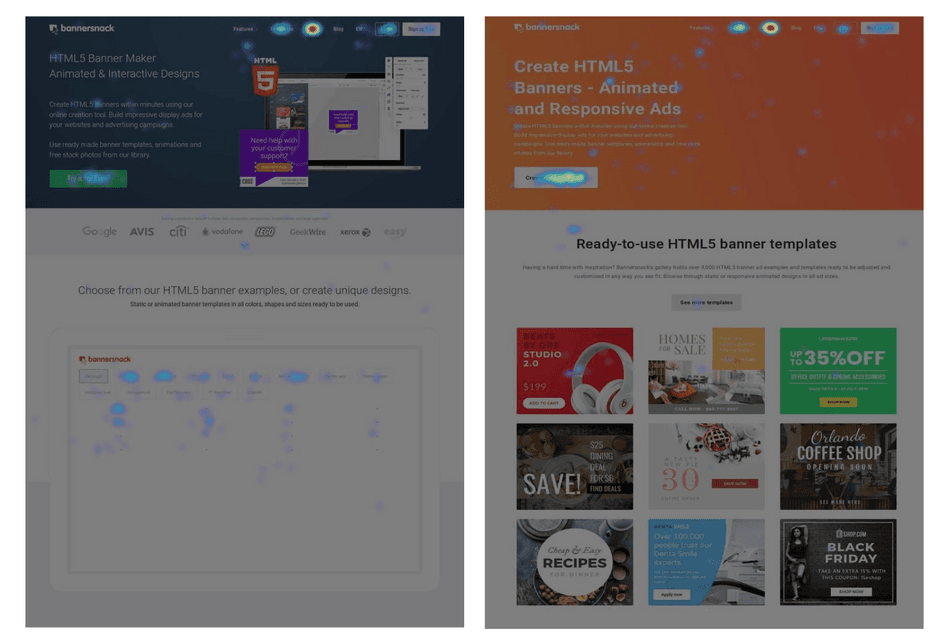
Heatmaps of the old and new versions of Bannersnack’s homepage
📖 First time generating heatmaps in Hotjar? Find detailed instructions here.
After creating heatmaps, start catching UI design problems and mistakes. Here are five pointers to live by:
Once you’ve installed the tracking code, Hotjar starts collecting data from the first visit to your site. We recommend waiting until you reach at least 100-200 sessions for an accurate analysis.
View click maps to find where visitors click on desktop and tap on mobile. The reddest elements on the heatmap received the most clicks and taps.
Analyze the red elements to see if users interact with critical links and buttons on a page. For instance, if you notice visitors clicking your new CTA button, consider it validation for your decision to enlarge it and add contrast to the background.
On the other hand, blue heatmap areas indicate lower attention. Your target audience could be ignoring an element or area that's vital to their conversion.
Take a look at your heatmap’s side panel: if you find people rage-clicking on an element that’s not a link, it's a sign to investigate further. The element may be confusing and frustrating for users who click furiously—and nothing happens. 🤷

Compare engagement on mobile and desktop devices
Sometimes page elements and content may render incorrectly—and we've seen this often happen on mobile devices. Take the time to compare click (or tap) maps, move maps, and scroll maps across different devices to detect friction points.
If you realize users experience friction on the mobile app sign-up page, use a heatmap to analyze the best way to rearrange the elements and content. It's quick and requires only a few steps:
Create a heatmap of the page
See where users click the most and the least
Save a highlight of the areas of concern (we’ll talk more about this feature in a minute) for further analysis and discussion with your team
Decide whether the issue merits a change: think about adding or revising your error message for a problematic area, or reducing the number of fields and increasing the size of your CTA button
3. Launch surveys to discover the real reason behind drop-offs
Not all unhappy users make a support call or email their complaint; most just get frustrated and leave your site.
Feedback widgets and on-site surveys enable you to directly ask people why they're leaving in real time: why were they frustrated? Was a step unclear or a button not working? What was missing in their experience?
Filling in the gaps with user feedback
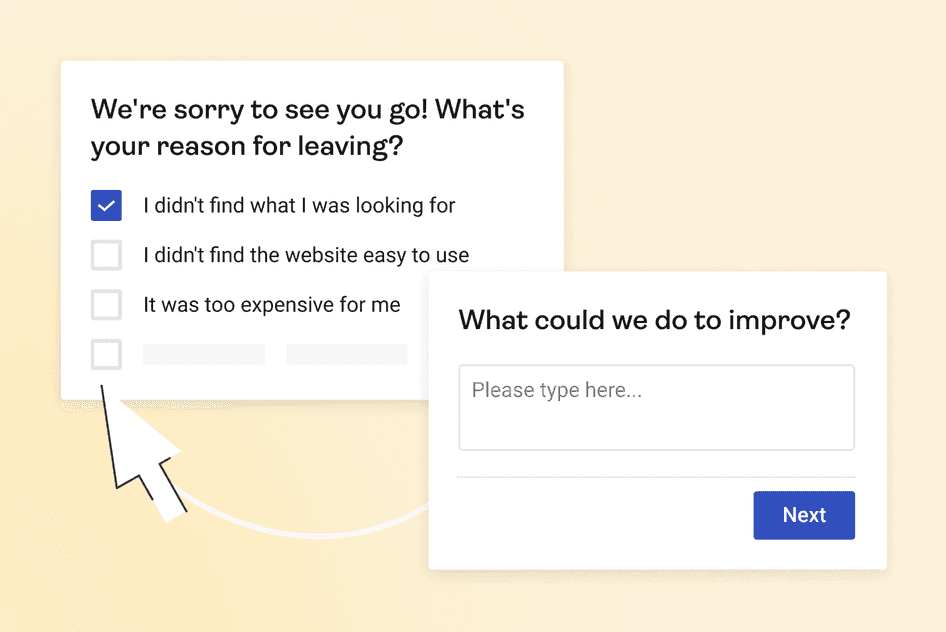
Here’s a practical example: digital agency Turum-burum helps ecommerce businesses elevate their user experience (UX) design to improve conversions. They run Hotjar Surveys on their clients’ websites to identify hidden UX errors, which are notorious conversion blockers.
Using our exit-intent survey, they collected feedback from the users of the online store Intertop. Customers who dropped off at checkout were asked “Why would you like to stop placing the order?” 48.6% of 444 respondents said something was stopping them from completing their purchase.
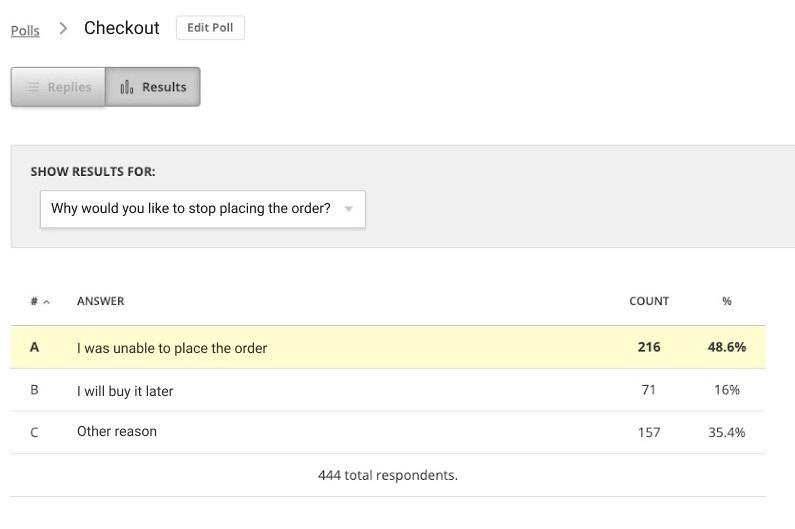
User feedback from a Hotjar exit-intent survey
Hotjar Surveys are easy to craft and launch. Take inspiration from our survey templates and launch polls to complement other website monitoring tools like Google Analytics, Hotjar Recordings, and Hotjar Heatmaps. You can also generate a survey in seconds with AI for Surveys, then watch as it prepares an automated report with feedback insights and suggested next steps to take.
More tips for maximizing Surveys:
Surveys work best for sites with higher traffic volumes of around 1000+ users per day.
While surveys start showing up as soon as you launch them, it may take some time to get enough responses to draw meaningful conclusions. If you have yet to receive many answers after a few days, try changing the survey's position or color, or rephrase your questions to make them more compelling.
Aside from the exit page, capture feedback on other valuable pages during key moments of the customer journey. Use these website survey questions to uncover issues, prioritize fixes, and explore opportunities.
4. Use console tracking to catch new JavaScript errors
Whether due to coding, end-user input, or other unforeseeable reasons, errors will happen on a JavaScript-based website. Console tracking—a new Hotjar feature✨—lets you track JavaScript errors on your website. This makes spotting (and fixing) issues faster, easier, and more efficient.
Here are some ways console tracking helps you stay on top of JavaScript bugs:
Quickly identify a session with an error and watch the recording to see exactly where the error happened, why it happened, and how it impacts UX
Use the errors filter to search for specific errors on certain pages and see whether they reoccur over time
Combine the errors filter with other Recordings segmentation—such as the user's browser, device type, or clicked element—to know if the errors you fixed still occur
Share errors with your team via Slack, Microsoft Teams, or other apps via Zapier APIs to prioritize fixes
5. Recruit the right people to conduct usability tests with confidence
Usability testing focuses on whether users can complete the tasks they've set out to do on your site. It also reveals problems indicating your website's not working as it should, preventing people from accomplishing a goal.
Identify usability issues on the fly with the correct subset of testers. After releasing a newly developed feature, use Hotjar’s user interview tool, Engage, to recruit existing users already familiar with your brand and observe them as they complete tasks on your website.
Engage allows you to screen candidates according to your criteria and test scenario. For example, you could specify that only those who have previously interacted with your site’s sign-up flow will be qualified to participate in your usability test.

📖 Learn more about usability testing tools and methods here and how to enable Engage as a Hotjar user here.
Uncover hidden issues with ease
Use Hotjar's tools to find and investigate bugs quickly, so your team can deliver fixes and delight your customers.
How to solve bugs on your website
Ask different web developers, project managers, and web admins how to fix website bugs, and you'll get a variety of approaches and processes. Covering this topic requires its own encyclopedia!
But we can share a few techniques to help you and your team resolve fixes faster and more strategically. Here it goes:
Uncover issues, prioritize fixes
Take advantage of the suite of tools and features in Hotjar to know whether you should prioritize a fix.
For example, let's say you notice a new JavaScript error on your checkout page and want to know how many users are affected.
The Trends tool lets you filter errors by the specific JavaScript error message seen on the checkout page, so you can see how big the issue is and determine the priority level for its resolution.
Share qualitative insights and findings with your team or clients
Do you struggle to get buy-in from stakeholders? Show and tell with heatmaps. By displaying a heatmap of the new and improved site, or the winning variant from an A/B test case, you prove to clients and higher-ups that your changes are driving results.
We have around 17,000 shops hosted on our site, if you consider the free users, and that’s a lot of data. With that in mind, we set out to study the pages with a similar layout and flow, such as the checkout page. Hotjar helped us gain insight into how people use our features and where we can improve them for our clients. That means conversion improvements…and happier customers!
Keep it organized
But that's not all—staying organized is key to a successful project.
Log each bug by tagging recordings. Later, filter by individual tags and re-watch relevant sessions only. Pick a naming convention that makes sense to your team. Some examples are:
Error
Filters used
Unsuccessful
To investigate
Verification issue
Broken link to contact us
Didn’t seem to find pricing
(These are actual tags we use at Hotjar.)
Here’s another simple trick that makes a big difference in getting things done right the first time: if you use Jira, Trello, or any project management tool, add recording links to individual tickets or requests for fixes. Bug reporting allows whoever's working on the problem to see it happen before making any changes to the code or design—your development team will thank you.
Share console errors and corresponding visual evidence with Hotjar’s Jira integration to start debugging faster
💡 Pro tip: use Highlights in Hotjar to organize your insights within the platform and share them with your team, boss, and other important stakeholders in your company.
For example, when you spot a bug or discover something interesting, highlight an area on your heatmap or a clip of your recording. Add a comment and label it accordingly before sending it to the Highlights tab, where your intended audience can view it.
Head to our guide for additional tips and tricks to make the most of this collaboration-focused feature.
Spend more time resolving problems and making users happy
We just demonstrated how accessible and creative spotting bugs can be, even for non-developers.
This is your cue to start tinkering and take Hotjar to its farthest limits. Once you uncover the issues (perhaps find that elusive bug that's been giving your team a headache for weeks), use Hotjar again to gain the support of your bosses, clients, and other stakeholders.
Deliver fixes, stay on top of new problems, rinse, and repeat. It's a cycle you—and your customers—will come to love. Happy bug-hunting!
Uncover hidden issues with ease
Use Hotjar's tools to find and investigate bugs quickly, so your team can deliver fixes and delight your customers.