Learn / Guides / CRO guide
10 key conversion rate optimization metrics + KPIs to build a better product experience
Conversion rate optimization (CRO) is all about giving your users the value they came for on your website by deeply understanding their goals, wants, and needs.
Tracking CRO metrics and key performance indicators (KPIs) shows you where visitors are converting or getting blocked on your page—so you can ensure your design, messaging, and marketing steer users towards completing key conversion actions.

You can’t track everything without losing focus. So which conversion metrics and KPIs are the most important to understanding your customers’ journey and path to purchase?
Our guide will walk you through the 10 essential conversion rate optimization metrics you need to track to feel confident in and validate your CRO efforts.
Want to better understand your website conversion rate?
Hotjar tracks how users engage with your site and gives you direct user insights so you know exactly what to optimize

10 key CRO metrics you need to measure to increase website conversions
Below, we’ve listed the most important conversion rate optimization metrics you can use to measure and increase conversions.
Before you check them out, keep in mind that no two websites, products, or customer bases are the same. It’s easy to fall into the trap of comparing your efforts to industry figures that aren’t necessarily relevant to your organization.
Stay focused on measuring the right metrics for your company: ask yourself which metrics best fit with your overall KPIs, and what reasonable targets are for you.
First, we’ll explore different types of conversion rates you should track to improve your CRO best practices. Then, we’ll take you through other key metrics you should track to create a stellar CRO program.
1. Macro-conversions
Your overall macro-conversion rate tells you how many users converted on your website by dividing the total number of conversions by the total number of site visitors.
Macro conversions happen when a user completes a major end-goal action. Depending on your industry and specific objectives, this could be a sale, a product or trial signup, or a completed contact form.
2. Micro-conversions
Micro-conversions are the smaller steps users take on your website that bring them closer to larger conversion goals. These micro-actions include users visiting category or product pages, watching a demo video, or adding a product to their cart or wishlist.
Tracking micro-conversions helps teams identify weak spots in their marketing or sales funnels, like pages where users drop off, helping them see where they’re failing to engage their website visitors.
Tracking micro-conversions helps you find and fix the weakest links in your funnel, especially when you combine conversion metrics with qualitative user insights.
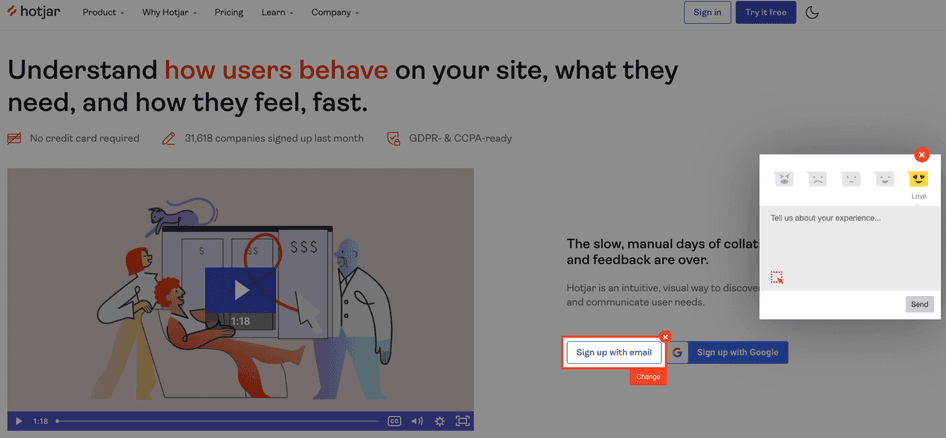
Once you have a sense of your macro and micro conversions, place Hotjar’s Feedback widget or on-site Survey on key conversion pages (like checkout or signup pages) and ask users to share their experience and why they converted or not. Voice-of-the-customer (VoC) data shows you what’s blocking users and helps you spot areas of improvement and website bugs that could be negatively affecting conversions.
3. Returning user conversions
The returning visitor metric tracks users who’ve been to your website before, and whether they’re converting when they return. This helps you understand how successful you are at building and retaining your audience, and check whether you’re meeting their needs when they return to your site.
First, use web analytics tools to track returning user metrics and understand if you’re attracting repeat visitors to your website. Then watch Hotjar Session Recordings and see what your users see on your website and what made them come back—so you know what to optimize.
4. Form conversions
Form conversion metrics track how many users fill out and submit forms, for instance: newsletter or demo signups, or notification contact forms that let visitors know when a product is back in stock. It’s important to stay on top of form conversions as they often indicate customer interest and predict future macro-conversions.
Monitor form conversion rates for an overall sense of how effective your forms are at converting and enticing users. But to dig even deeper, you’ll need to combine standard web analytics with tools like Heatmaps that show you exactly which form elements users interact with versus ignore. This helps you understand how to optimize form design, copy, and placement.
5. CTA conversions
CTA conversion metrics track what percentage of users clicked directly on your CTA. Tracking CTA conversions helps teams understand whether their calls to action are doing their job and compelling users to convert.
Pro tip: use a click Heatmap to find out whether your CTA is attracting your users' attention or whether other elements on the page are distracting them. If you find that users are clicking on irrelevant elements after analyzing heatmaps, go for a change by making your CTA more prominent by changing its placement or making the font bigger, enticing more users to convert.
6. Bounce rate
Your bounce rate indicates the number of users who click on your site and leave before performing any kind of action, whether that’s clicking on another page or reading a blog post. Bounce rates give you a clear indication of whether your site immediately engages your users, or whether you need to make improvements to actively meet their expectations and needs.
Start by checking your bounce rate with web analytics software, then use more in-depth tools like Hotjar Session Recordings to see how users click, scroll, and navigate your site and quickly uncover where they got stuck or what made them leave.
7. User path
User path analysis is a visual depiction of what happens when visitors enter or use your website. Tracking user paths shows you whether you’ve built an intuitive website that’s easy to navigate—so users can easily find what they’re looking for and convert.
With Google Analytics, you can track user paths from one point to another to hone in on the user journey within specific touchpoints on your website. This way, you know where users get blocked on their journey and fix what's not working, instead of redesigning your entire website. Then go deeper with Hotjar Surveys to ask users directly about their customer experience while navigating your site for additional insights not covered by quantitative data.
8. NPS® score
Calculate your Net Promoter Score® by surveying your users and asking them how likely they are to recommend your product or service on a scale of 0-10. NPS scores give you direct insights on whether customers are satisfied with your product and draw your attention to possible improvements to optimize your conversion rates for future and returning customers.
Use Hotjar's NPS Surveys to gauge customer satisfaction, loyalty, and enthusiasm—and use these insights to drive conversions and better meet user needs.

9. Click and scroll depth metrics
On-page clicks and scroll depth metrics tell you how many clicks you’ve generated per page and the average scrolling depth per user. These metrics give you a strong overview of user engagement with your website, page by page, and let you gauge customer interest in your product.
If your team sees a percentage drop in either metric, it’s a good indicator that users aren’t feeling compelled enough by your page content or offer to learn more, or that they’re getting frustrated with the product experience (PX) you're providing. This is a big warning sign that you need to optimize key pages to avoid losing conversions.
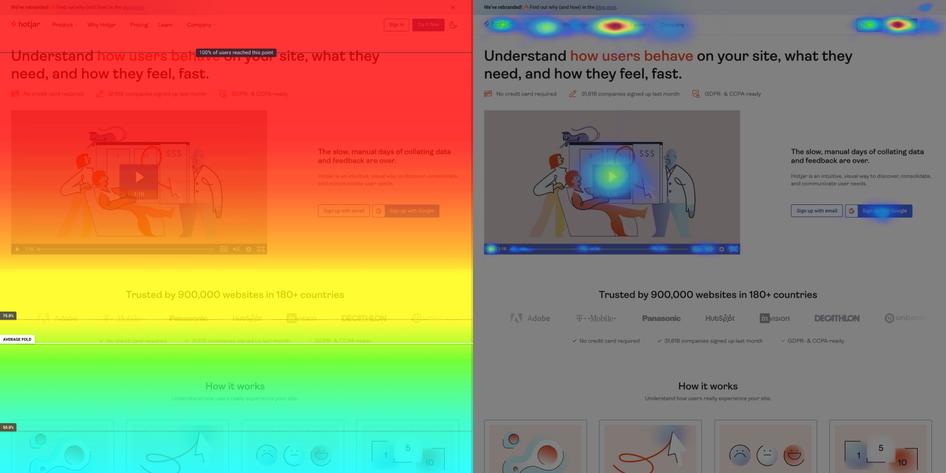
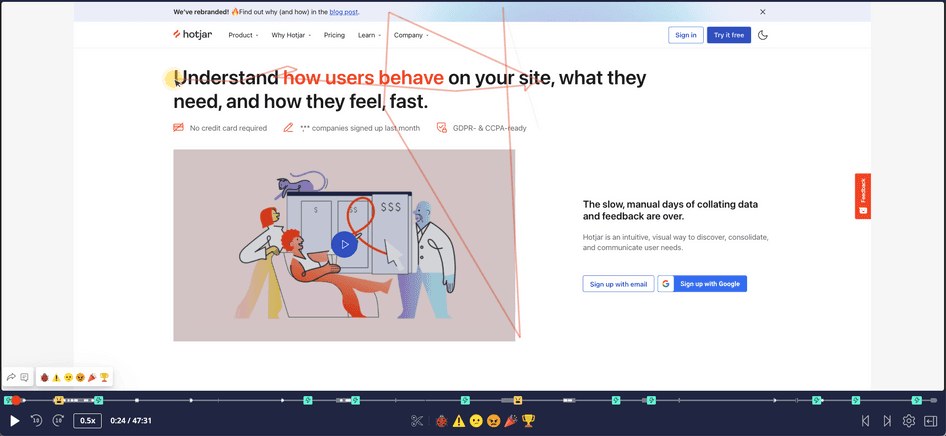
Use Hotjar Recordings and Heatmaps to go beyond the metrics and visualize exactly how users behave on your site, seeing where they click, how far down they scroll, and whether they’re rage-clicking or u-turning. This helps you understand how to improve key pages and page elements to boost conversions.
10. Click-through rate
Your click-through rate is the percentage of users who click on a specific link, either from an email, image, or advertisement, that leads them to your website. It's a useful metric to measure the success of your marketing campaigns and see whether they’re bringing traffic to your site.
If users aren’t clicking through to get to your website, they’re less likely to convert. Track your click-through rate with web analytics tools to see how well your campaigns are attracting customers. Then, get creative with tailoring messaging to your users’ needs and preferred channels to spark more interest.
Track user-centric CRO metrics to improve UX
Tracking CRO metrics gives you a quantitative understanding of how well you’re converting users and which pages, paths, and campaigns best meet their needs to help you remove blockers and spot opportunities to improve the user experience (UX) and optimize conversions. But you need to combine quantitative metrics with qualitative insights that give you a fuller, user-centered picture of their product experience.
Remember to keep tracking your CRO metrics long-term to check whether your optimization efforts are working and make sure your site and product offer users what they truly need.
Want to better understand your website conversion rate?
Hotjar tracks how users engage with your site and gives you direct user insights so you know exactly what to optimize