Learn / Guides / Ecommerce guide
Everything you need to know about checkout abandonment
Losing customers during checkout—when they're so close to the finish line—can be extremely disheartening. It’s like giving away a book before you read the final 50 pages or your alarm going off just as your dream gets interesting.
It's also bad for business: each time a shopper leaves your site in the middle of checking out is a sign that something’s confusing about your process. Understanding what checkout abandonment rate is and calculating it helps you pick up on the signals customers send, so you can make it easier for them to convert.

This guide defines checkout abandonment rate and teaches you customer-centric strategies to help you create a positive user experience (UX) and close more sales. You'll learn:
Learn why customers leave your site
Hotjar’s tools show you how customers interact with your checkout flow so you can spot improvement opportunities immediately.

What is a checkout abandonment rate?
Checkout abandonment rate is the percentage of potential customers who begin the checkout process but don’t finish.
For example, customers may leave your site when you ask for payment details or show shipping options. At its core, checkout abandonment rate signals something frustrating or confusing your customers during checkout.
Businesses often use ‘cart abandonment’ and ‘checkout abandonment’ interchangeably, but they represent different steps in the ecommerce customer journey. Let's take a look.
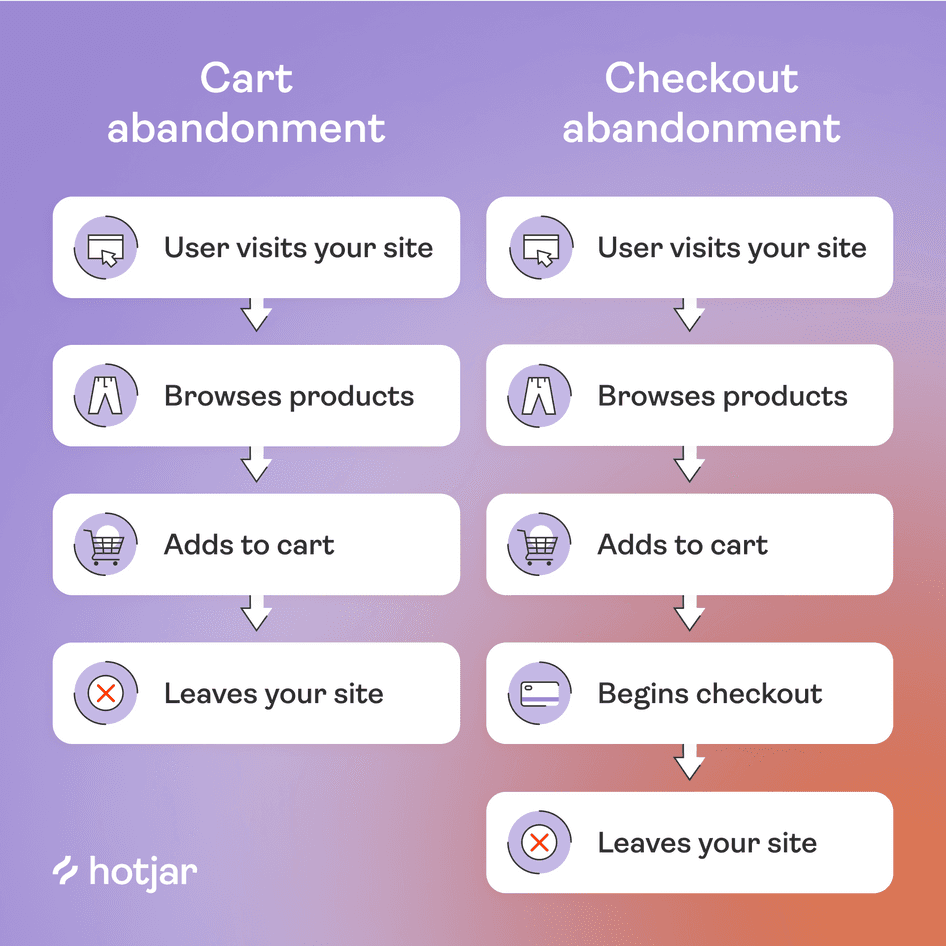
Cart abandonment vs. checkout abandonment
'Cart abandonment' occurs when customers add something to their online shopping cart and then leave your website.
For example, imagine you run a denim ecommerce store. Customer A likes the look of your pants as they browse the site, so they add it to their cart. However, they're unsure if the quality will match the price, so they close the tab and get back to work—that’s cart abandonment.
'Checkout abandonment' occurs when customers add something to their cart, begin the checkout process, and then leave your website.
Let’s say customer B likes the same pair of pants, adds them to their cart, and starts to checkout. Then they see that shipping to their country takes three weeks, so they close the tab and get back to work—that’s checkout abandonment.
Why your checkout abandonment rate matters
To run a successful ecommerce business, you need to create a great customer experience (CX). Ensuring every touchpoint your customers have with your brand is positive, engaging, and easy to navigate helps lower your checkout abandonment rate, leading to:
Active, engaged customers who teach you more about your target audience and offer useful product feedback that guides improvements
Satisfied customers with high Net Promoter Scores® (NPS) who recommend your company to friends
Retained customers who come back over and over and increase your average customer lifetime value
Not a single company achieves a 0% checkout abandonment rate—and that’s okay. A low abandonment rate is an opportunity to investigate and understand your customer’s experience, so you can improve it.
However, a rising or high abandonment rate leads to long-term issues. Here are a few ways high checkout abandonment rates negatively impact your business:
How to calculate your checkout abandonment rate
You can calculate your checkout abandonment rate by hand using data from traditional website analytics tools—like Google Analytics—with this formula:
Checkout abandonment rate = 1 - # of orders completed/# of orders initiated x 100
For example, if 1,000 customers pressed ‘checkout now’ from their shopping cart this month and there were 645 completed sales, your checkout abandonment rate would be 35.5%.
1 - (645/1000) x 100 = 35.5%
You can also set up a Google Analytics goal to automatically calculate your checkout abandonment rate.
Naturally, you wonder, “What’s a good checkout abandonment rate for online retailers?”
It depends. Public data for average checkout abandonment rates fluctuate, with some studies saying 60%-80% of customers abandoning checkout is typical. However, there are two problems with relying on industry benchmarks.
First, most reports focus on cart abandonment statistics which, as you remember, is different from checkout abandonment. Second, ecommerce averages don’t account for your specific industry, customers, or products. That’s why it’s best to compare your checkout abandonment rate to your past performance and track it over time.
For instance, the online denim store would check their checkout abandonment rate every month to catch any upward trends before they rose too high. Of course, if you’re actively improving your checkout experience, you’ll test and iterate more often.
6 tools for checkout rate optimization
Online shoppers may leave because they’re confused, frustrated, uncertain, distracted, or unready at any point in the checkout process.
For example, customers will abandon your checkout flow if:
There are too many form fields, steps, or pages
You ask them to enter the same information multiple times
You don’t have a guest checkout option
There are additional shipping costs or fees they didn’t anticipate
There are website bugs that make the checkout flow difficult
You have long shipping times
You don’t offer their preferred or trusted payment option
Luckily, product experience (PX) insights give you a front-row seat to the customer experience during checkout to determine the abandonment cause and fix it quickly. Rather than making assumptions about how your customers think and feel, use these six tools to make informed decisions and improve your checkout abandonment rate.
1. Recordings
Recordings let you watch what customers do on your online store, like how they move back and forth between steps in your checkout flow.
Filter recordings by attributes like visit time, first-time vs. returning customers, location, or browsers to find previously unnoticed issues. For example, recordings revealed that Wyldson customers using Internet Explorer had problems with checkout, so all the engineering team had to do was fix the problem for that single browser.
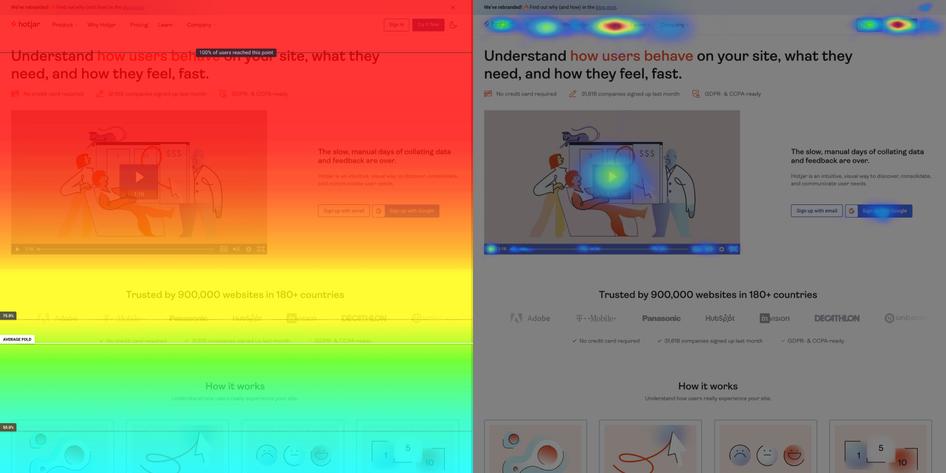
2. Heatmaps
Heatmaps show you where customers spend time and attention, including what they click on, scroll through, and ignore. For example, Materials Market used heatmaps to see that mobile users didn’t scroll down far enough to see a call to action (CTA), so they raised it higher on the page.
3. Rage clicks
When an element on your page doesn’t work or loads slowly, some customers let off steam with rage clicks. Tracking where and when customers repeatedly click in rapid succession reveals broken buttons or un-clickable elements that customers think should lead somewhere.

4. Feedback widget
A website feedback widget tracks customer satisfaction with different pages, and is a way to collect feedback without distracting customers from their next checkout steps. For example, if most customers click a frowning face on a checkout page, you know you need to improve design or usability.
We love Feedback because it gives us instant feedback from shoppers. It doesn’t interrupt the checkout flow, and it allows us to fully understand our shopper’s experience, in real time. This helps us study performance trends and identify shopper concerns.
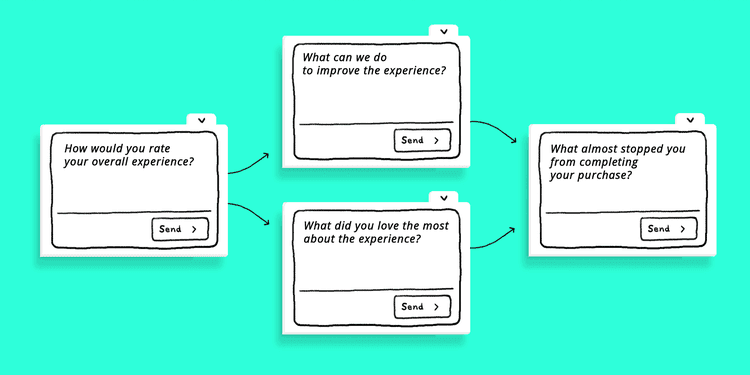
5. Surveys
You can also learn about your checkout experience from customers who have already completed the buying process. Use a post-purchase survey to ask customers what you can do to improve the checkout experience and what almost kept them from completing the transaction.
For example, if customers say they want to know international shipping times upfront, you’d add those details to the product page, so potential customers feel more secure in their decision. Then, you’d A/B test the new design to see if the update lowers checkout abandonment.
6. Customer interviews
Face-to-face in-person testing or remote interviews are useful if you want to dig deeper into a checkout abandonment issue or hypothesis. For example, if customers dislike your shipping details page, conduct interviews to ask how they’d like to see your company remedy it.
Remove the mystery from checkout abandonment rate with PX insights
Without quantitative and qualitative data, the checkout process is a black box—customers go in, they interact with the checkout flow, and only some complete the purchase.
PX insights help you see your checkout experience from the customers' perspective, which means you find and fix issues immediately rather than guessing first and checking after. Gathering feedback and improving the customer experience also go a long way in showing customers you care.
Give your customers a turn at the mic
Hotjar’s tools let you listen to feedback and learn from user experiences to make customer-centric checkout improvements.