Learn / Guides / Marketers guide
How great marketers create insightful and actionable reports (with steps + tools)
Any great marketer knows that marketing reporting is more than just spitting out stats. Think of it as storytelling: you dive into the ‘why’ behind the numbers and metrics to uncover real user stories and experiences.
Weaving a narrative into your reporting with qualitative data helps you make a case for customer-centric strategies. It also gives decision-makers and team members clear action points while painting a complete picture of customer behavior, needs, and preferences.

It’s not half as daunting as it sounds—and this guide breaks down the process for you. Here, you’ll find concrete ways to complement numeric data, like performance and campaign metrics, with qualitative insights from observation, surveys, and user feedback.
Stick with us to know exactly which tools to leverage in each step.
Summary
Get inspired to craft a compelling marketing campaign report. Study the following use cases for a good idea of how to combine performance data and user insights:
Discover what’s happening on your website or product
You just overhauled your outdated website—an effort that involved cross-functional teams and a significant chunk of the company budget. It’s now time to track and report on the changes’ impact: do they bring delight to customers, align with their needs, and improve your bottom line? Why or why not?
Delve into these key performance metrics to know the answers to those questions:
Website performance: pull up numeric data to determine whether your redesign pays off. Examples of quantitative data include cart abandonment rate, conversion rate, drop-off rate, total clicks, and number of rage clicks.
Customer satisfaction: connect user behavior to site performance to understand why the metrics are what they are. Gather qualitative data derived from surveys like Customer Satisfaction Score (CSAT), Net Promoter Score® (NPS®), and Customer Effort Score (CES), and see if there’s a decline in support question/ticket volume.
🛠 Which tools to use: Google Analytics, Mixpanel, Adobe Analytics, Hotjar
💡 Did you know? Hotjar integrates with Google Analytics and Mixpanel, combining insights from your favorite website traffic analytics platforms and our product experience insights tools. Easily connect the what to the why and build actionable reports for your decision-makers with one quick setup.
Quickly learn what’s happening using quantitative analytics tools
Website analytics tools are the most common and reliable sources of measurable information about site performance. They tell you what’s happening on your website or in your product.
You already know Google Analytics 4 (GA4), arguably the most popular platform among marketers. Other marketing reporting tools offering a wealth of quantitative data are Mixpanel and Adobe Analytics.
However, numbers don’t give you the complete picture—they can leave you and your audience wondering why users drop off at checkout in the first place.
Enter behavior analytics tools.
See how people use your site post-redesign via behavior analytics tools
Behavior analytics solutions like Hotjar complement web analytics tools in three key ways:
Just this morning, we released a new feature and were able to see a customer navigate right to a specific part of the feature we highlighted in a user email. In most applications, there is a veil of secrecy because you really don't know how users use your app beyond speaking to them or using other analytics tools. We literally saw the fruits of our labor today.
💡 Pro tip: generate a survey in seconds with Hotjar AI for Surveys. This feature lets you craft any survey based on a goal, including NPS, CSAT, and CES.
Also, save more time when you automate the creation of summary reports. Instantly highlight the findings, quotes, and key insights you need to build your case.
Watch this video to learn more about leveraging Hotjar AI in your reporting and other marketing tasks
Analyze how a channel or campaign performs
You have an ongoing campaign across different channels, including pay-per-click (PPC), email, and social media. In your mid-campaign report, you want to present how each channel compares with the rest, so you can optimize spend and enhance your company’s return on investment (ROI).
There’s no shortage of quantitative data to collect from these multiple sources. The challenge, however, is to seamlessly bring all the data together and effectively evaluate the success of your marketing campaigns.
Don't feel overwhelmed just yet. Combining analytics tools makes it possible to craft an in-depth, actionable marketing campaign report.
🛠 Which tools to use: Hotjar, Mixpanel, GA4, Google Ads, Facebook Ads, LinkedIn Ads
Choose between two powerful website analytics tools
Again, GA4 is a good place to start if you want to learn how end-users got to a landing page: did they click on a Google ad, respond to a Facebook campaign, or find you via a LinkedIn ad? But that in itself doesn’t reveal an entire channel’s performance. You have to know what people did after going deeper into your marketing funnel to become qualified leads.
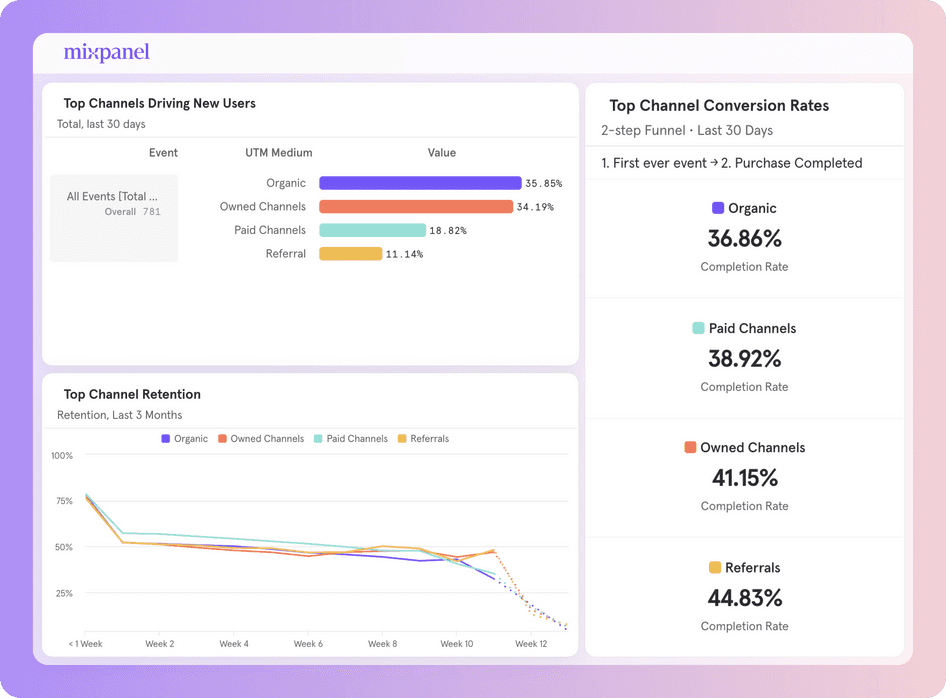
Mixpanel fills the gap by enabling you to track thousands of events like clicking the sign-up button or playing a video in real time. But while Mixpanel reports show where users get stuck, they can’t tell you why. Don’t worry—your friendly neighborhood behavior analytics tools are here to help you venture further down.
Enrich your reporting through Hotjar’s tools and features
Marketing performance reporting should be comprehensive. You can start by outlining the top-performing and worst-performing channels. Add context by identifying their role in the user journey and suggest how to maximize or resolve the issues linked to these channels.
Here’s a sample workflow you can apply within Hotjar:
Integrate Hotjar with Mixpanel: send your Mixpanel events to Hotjar to further deepen your understanding of user behavior
Set up Funnels to get a glimpse of the user journey (including how visitors enter and leave): create up to five comparisons, segmenting by channel, UTM parameters—e.g. source, medium, and campaign—and Mixpanel events. Or, filter by ‘clicked element’ for anything that has no corresponding event in Mixpanel
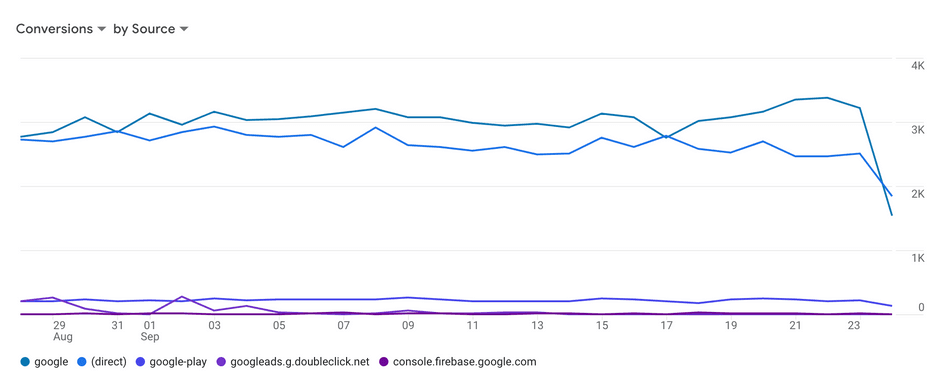
Compare sessions between your top traffic channels in Trends: build a trend that tracks your best-performing channels over time; add the trend to your Dashboard for easier monitoring
Watch users in the wild with Recordings: find the recordings of your low-converting channels; select the traffic channel filter, enter your UTM campaign and source (e.g. email or paid social), and get a front-row view of the user experience
Glean more insights through Heatmaps: filter heatmaps by traffic channel to find opportunities to optimize landing pages for different channels
Understand why you get those numbers
Go beyond comparing each channel’s performance metrics to uncover why you get low conversions, high CTRs, or decreased organic traffic. Delve deeper using visualized user insights and the voice of the customer.
Weaving a narrative into your reporting with qualitative data enhances empathy, reassuring users you have their best interest at heart—and, in turn, helping grow your bottom line.
🛠 Which tools to use: Hotjar Heatmaps, Recordings, Surveys, Feedback, and Interviews
Craft compelling reports with qualitative data
Weave a narrative into your reporting based on eye-opening qualitative insights. Convince your teammates, bosses, and stakeholders to prioritize changes people want.

Add more qualitative data points to secure buy-in from stakeholders
Whether you need a bigger budget or support for your bold marketing idea, a storified marketing report boosts your chances of convincing execs or your teammates. Hotjar allows you to communicate user needs to your audience through these intuitive tools:
Recordings: see what users see when they use your product or site, including what they click on and where they navigate to next. This enables you to quickly identify conversion blockers and pain points, fix the issues, and improve the user experience.
Feedback: think of it as a real-time suggestion box where users can express how they feel about your site or product (see it in action to the right of this page—it’s that red button labeled ‘Feedback’). If they feel happy or frustrated about a feature or element, they can instantly share whatever’s on their mind.
Surveys: let the voice of the customer guide your content marketing reporting and decision-making. Launch a targeted survey to discover and collect opinions about your ideas, campaigns, and even content.
Using the information gathered from Surveys helped us make substantial changes that resulted in a +491% increase in email CTR and a 49% conversion rate increase for our landing pages.
Instantly weave a story highlighting user insights
Marketing reporting isn’t about crunching numbers alone. Remember: reports are stories that dive deep into the heart of customer behavior. And with tools like GA4, Mixpanel, and, of course, Hotjar, you'll blend quantitative facts with rich, qualitative insights that give your audience the full picture.
So, when you craft a report, don’t simply cite website performance metrics. Take advantage of Hotjar’s tools and features to help stakeholders not just know that a user clicked on your site but also understand why they did. Empower your bosses, teammates, and collaborators to make better decisions while ensuring everyone’s truly connecting with customers.
Explain quantitative results further with qualitative data
Uncover the reasons behind your campaign or channel performance. Use Hotjar’s tools and features to learn how people truly feel about your marketing efforts.