Learn / Guides / Marketers guide
How to find, monitor, and solve website issues without technical knowledge
You’ve spent hours putting together your latest marketing campaign, paid for ads, and designed pixel-perfect landing pages—but all it takes is one or two pesky little bugs to annoy visitors and send them running to your competitors. The solution? Learn how to spot and fix website issues before they impact your success.

This guide shows you how to use tools to find, monitor, and solve website issues without technical knowledge. Use these insights to create better user experiences and improve your campaigns’ success.
Summary
Increase the success of your marketing efforts by finding, monitoring, and solving technical and UX website issues before they impact conversions.
Test new pages across multiple browsers and devices to see how they render and perform
Let people navigate and review your designs before they go live to spot problems early
Ensure your analytics tools are tracking your pages correctly to avoid missing data in reports
Use a session recordings tool to view real user behavior on your site and get ahead of any potential website bugs
Monitor for and spot any ‘invisible’ technical errors that negatively impact your site
Identify where and why people drop off your website to solve issues impacting conversions
Spot broken links or buttons, false links, or slow-loading elements with a tool to monitor rage clicks
Give users a way to provide feedback as they navigate your site to get alerted to issues as they crop up
Set up alerts on platforms like Slack to immediately know when something’s broken and quickly react
Share highlights of users encountering specific issues to give your dev team more context
Make it easier (and quicker) for your teammates to fix a bug by showing them how it looks in action
How to find issues when launching something new
Launching something new or rolling out updates introduces plenty of opportunity for error. Here are some things to consider before and after sending changes live to make sure everything works as it should.
Before launch
Before you press ‘publish’, run the following manual and automated tests to ensure your website's technical and UX aspects are up to scratch.
Perform cross-browser testing
Testing your new site page(s) across multiple browsers and devices to see how they render and perform at different resolutions helps you spot design and usability problems before they affect real users.
Tools like BrowserStack make it easy to simulate different browser environments and interact with your site on each to make sure everything looks correct before launch.
💡 Pro tip: look at your analytics data to quantify the most popular technologies your target customers rely on. Use this insight to prioritize the most impactful browsers, screen resolutions, and devices to test your designs on before launch.
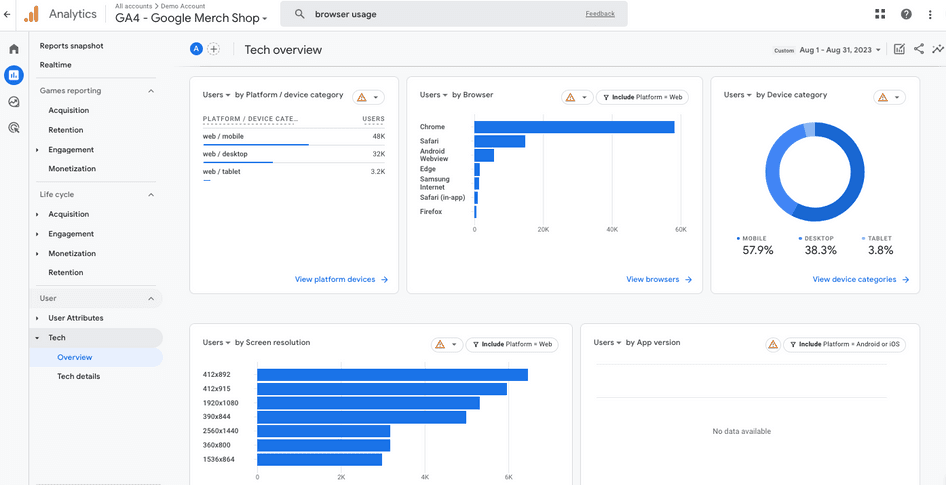
The tech overview report in GA4 will show you your visitors’ most popular devices, browsers, and resolutions—test new designs on these before launch
Test your site on real or target users
Getting real or target users to navigate and review your new designs before they go live gives you the chance to spot problems and address user concerns or confusion before they affect your brand’s reputation.
For example, you could test if a logo redesign resonates with your target buyers in the way you anticipate, or verify if a new landing page design is as easy to navigate as you think.
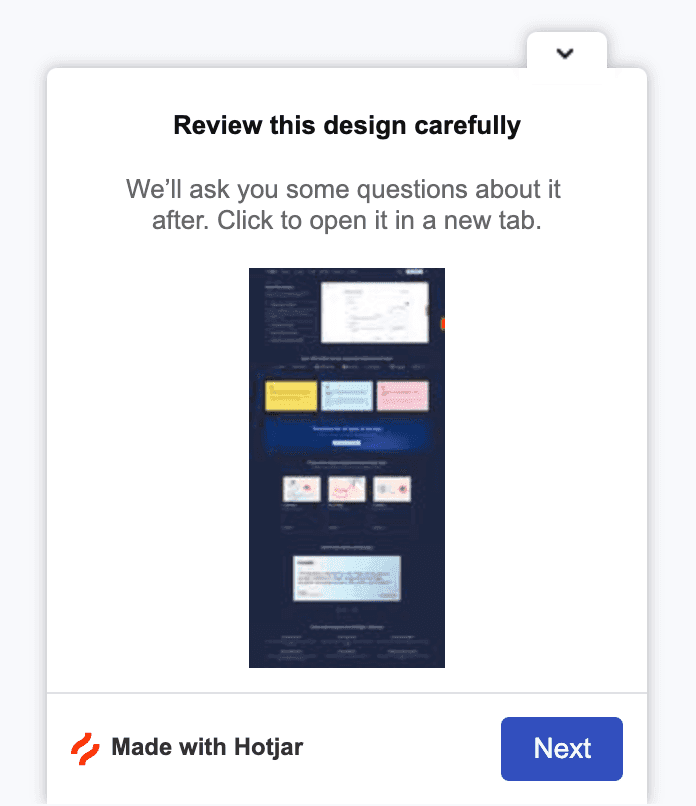
A concept test built with Hotjar Surveys—send it by email or add it as a pop-up on your website
You can do this by
Running concept tests like card sorting, tree testing, and surveys to get feedback on new logos, messaging, or designs before going live
Running moderated user interviews with a tool like Hotjar Engage to see how people navigate your design in real time and ask follow-up questions
After launch
Once your redesign or update has gone live, it’s time to double-check everything works as intended.
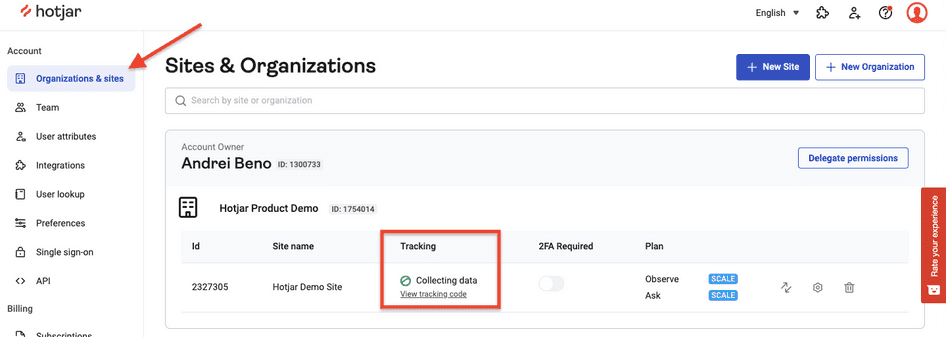
Check tracking scripts are working
Making website changes can easily lead to accidental broken or missing tracking scripts. Check that all your marketing analytics tools are tracking your pages correctly to avoid missing data in your reports.
If you’re using Hotjar, look in your Account settings under Sites & Organizations to make sure that your tracking code is collecting data:
Watch real user interactions early on
Every user on your site is unique, and even the most diligent pre-launch tests can’t guarantee a 100% error-free website. That’s why session recordings are so useful: they recreate real user browsing sessions across multiple pages. You’ll see first-hand every time a user gets stuck, bounces away, or encounters a bug.
Use a session recording tool like Hotjar Recordings to view real user behavior on your site early on in the roll-out to get ahead of any website bugs that may appear.
🎥 See it in action: the folks at Hussle, a gym subscription platform, used Hotjar Recordings to spot bugs when launching a new product feature, their ‘Personalized Pass Builder’.
Luke Calton, Hussle’s Product Lead, watched how users interacted with the new feature and noted down actions to address with future updates, such as
Why is that user hitting the back button at checkout?
Why did this user immediately change their options?
Why isn’t this user heading to the next step?
Do users understand they can build a pass, or why we automatically include other gyms when you add one to your pass?
Recordings gave the team actionable data to make small, iterative changes to improve conversions and make website interactions clearer for customers.
Read more about how Hussle uses Hotjar to spot revenue-damaging bugs and ensure each new launch runs smoothly.
How to continually monitor your website for bugs
Even if you’re not launching something new, your website is a living document, and new problems can pop up anytime and where you least expect them.
While you can’t control external forces, you can continually monitor your website for bugs to uncover issues and prioritize fixes when you spot something that’s not right.
Check for technical errors
‘Invisible’ issues like slow-loading or non-indexable pages are difficult to spot, even if you spend all day looking at the front end of your website.
There are plenty of tools (many of which are free) you can use to monitor for and spot technical errors that might be holding you back. Give these a try:
Google Search Console to identify issues with site speed and search engine crawling
GTmetrix to monitor website speed
Ahrefs’ site audit tool to find on-page SEO issues like broken links
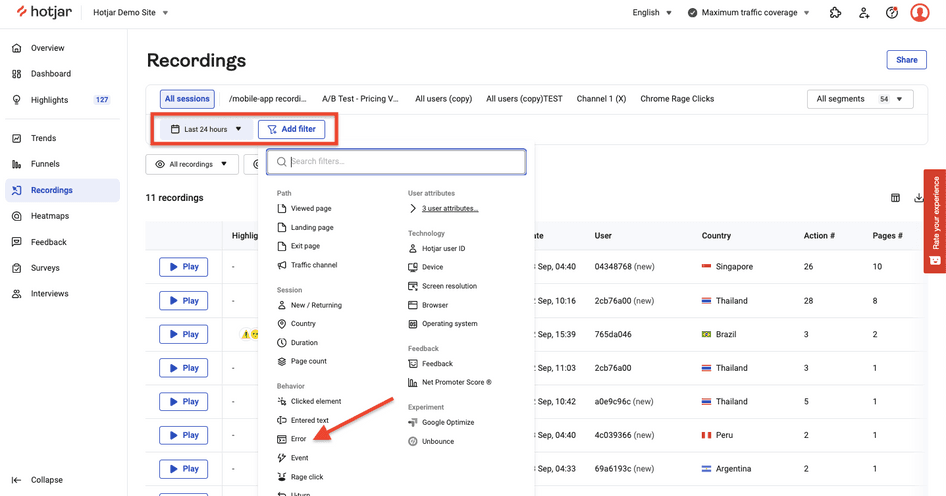
If you’re using Hotjar Recordings, filter by ‘error’ to save time and skip straight to recordings of users who experienced a JavaScript error on your site.
When you view a recording, you’ll see a red error icon when errors occur—click to view the error console and see more details.
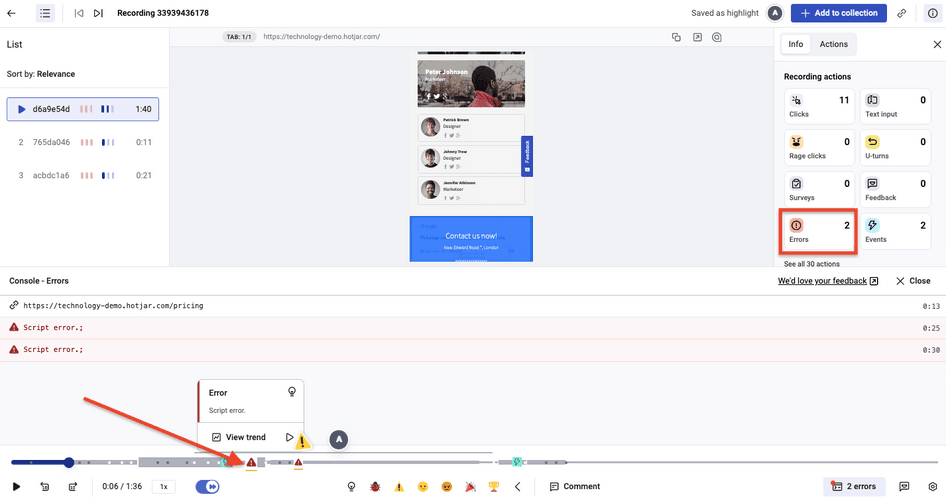
View JavaScript error details in Hotjar Recordings
You can also monitor errors in Hotjar over time by creating an error chart in Hotjar Trends—add the error widget to your Hotjar Dashboard to spot an uptick in errors before they cause problems.
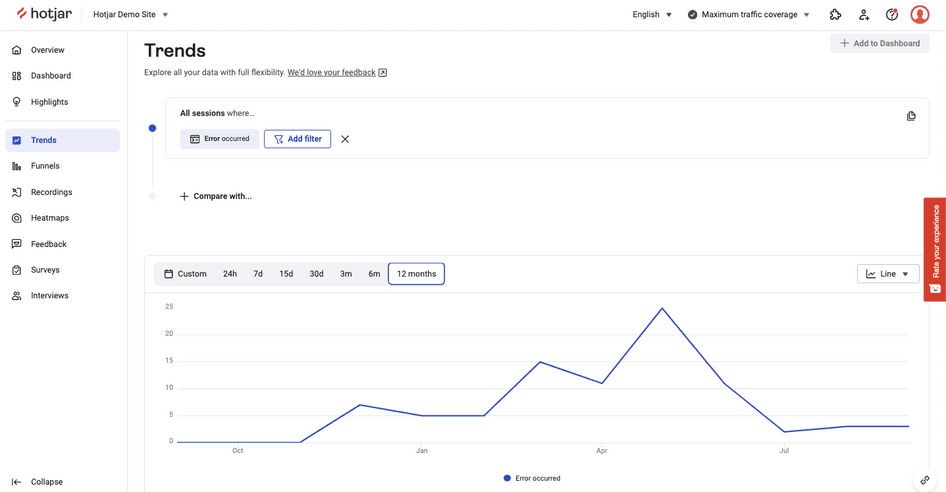
Tracking website errors over time in Hotjar Trends
Investigate website dropoffs
Identifying where (and, more importantly, why) people leave your website will reveal any UX issues that need to be fixed to improve conversions.
You can start this process with a traditional analytics tool like Google Analytics—look for pages with a high bounce rate, exit rate (exits divided by pageviews), and low engagement rate.
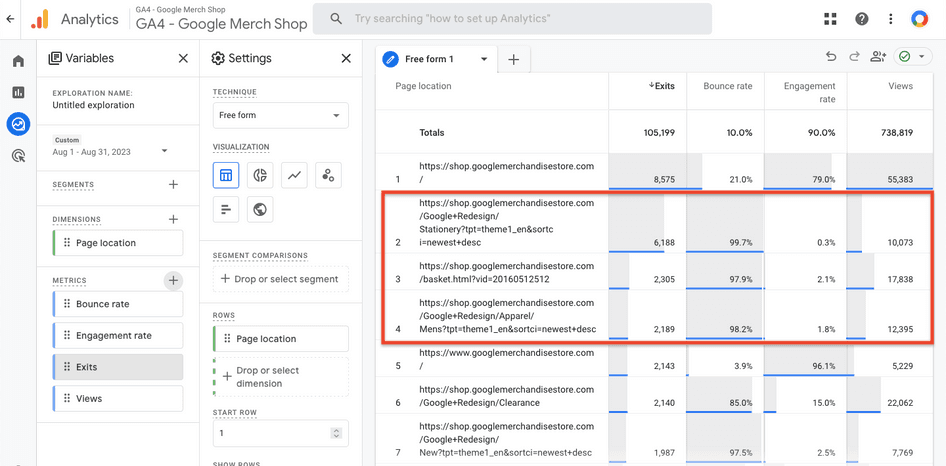
An example of a GA4 report showing high-traffic pages with high exits and bounces and low engagement—use a platform like Hotjar to investigate why
You can also look at your marketing funnels in a tool like Hotjar Funnels to quickly identify dropoffs for further investigation and use funnel analysis to identify issues and boost conversions.
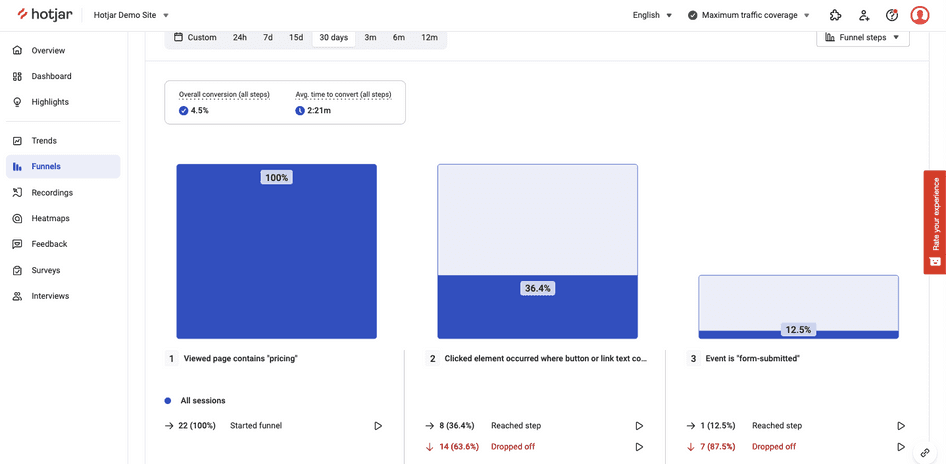
A Hotjar Funnel example showing 87.5% dropoff on the signup form—click the play button to watch related session recordings
Once you’ve identified your problem pages, investigate why they’re not performing by clicking the play icon to watch related session recordings.
Just two days after beginning to monitor recordings we were able to identify an elusive bug that had been causing us headaches for over a month and fix it.
Review rage clicks
Rage clicks represent where users click repeatedly on a website element in a short period of time. They usually indicate something’s wrong, like broken links or buttons, false links (i.e. an unlinked asset a user thinks is a link), or slow-loading elements.
Reviewing where users rage click helps you see your designs from their perspective and figure out what might need fixing or improving.
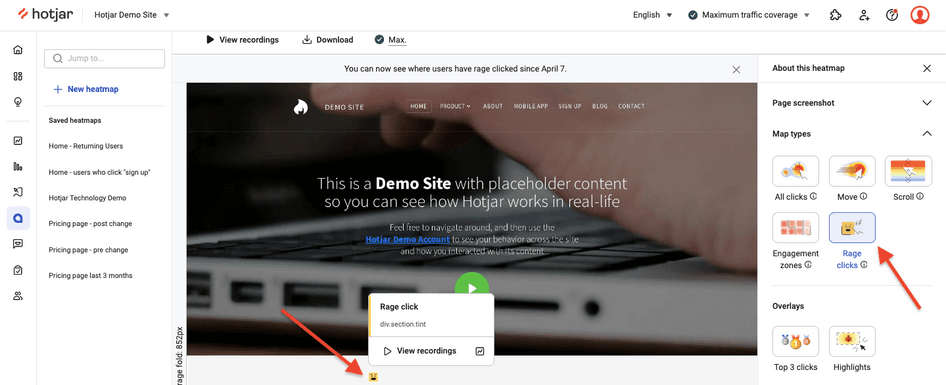
An example of a rage click map in Hotjar Heatmaps—click the play icon to view related session recordings
If you’re using Hotjar Heatmaps, filter any heatmap by rage click to view a rage click map. Click any rage click icon on your heatmap to show the play icon—click this to view session recordings filtered by rage click on that same element:
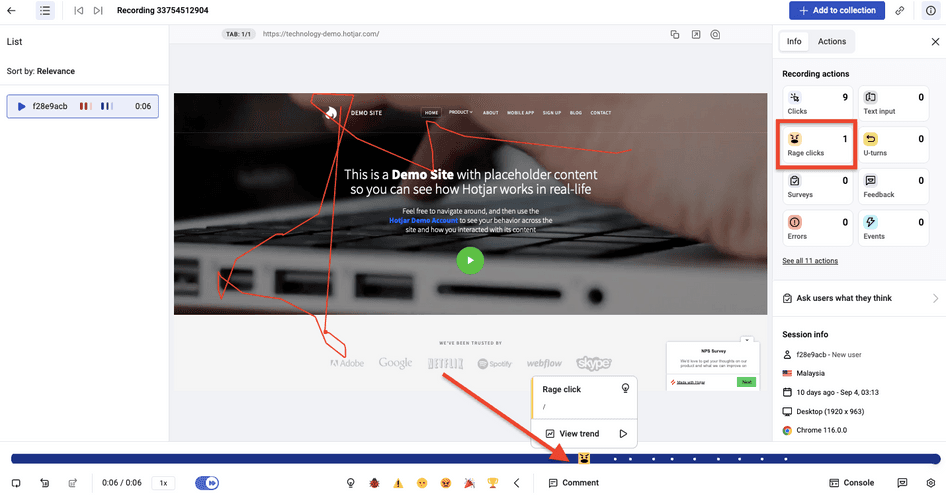
Viewing a rage click in Hotjar Recordings
Collect real-time feedback
Giving visitors a way to leave real-time feedback on your website makes it easier for them to report issues or questions they have instead of needing to open a support ticket or send an email.
We use our own tool, Hotjar Feedback, to do this across our website and in the product. Any visitor or logged-in customer can rate their experience, tag a page element, and leave a comment.
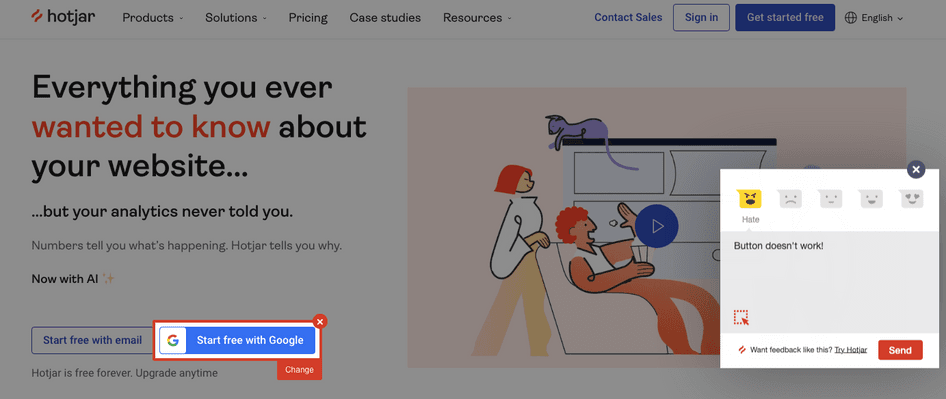
An example of a bug reported by a visitor using Hotjar Feedback
Set up alerts
Remembering to log into individual tools to check for errors can be a hassle (or get forgotten). Setting up alerts will ensure you always know when something’s broken and can quickly react.
If you’re using Hotjar, create a recording segment for sessions that include errors or rage clicks and use the Slack integration to get Slack alerts about new matching recordings sent to a channel of your choice.
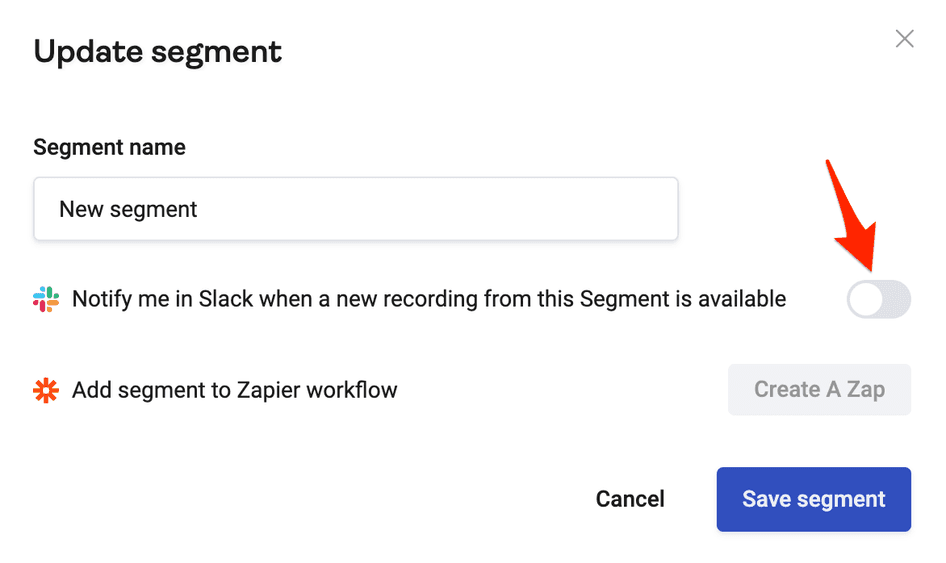
Get Slack alerts for any recording segment in Hotjar
By the way, most of the tools we mention in this guide can also be configured to send you email alerts when new issues are found.
How to solve website issues
Unless you’re a team of one, you’ll likely need to loop in another department or team member to fix some of the issues you found using the above techniques. The remaining tips and tools will help you organize, communicate, and get buy-in for fixes quickly.
Highlight and tag critical issues
Instead of trying to explain or recreate technical or UX issues for your devs, show them the real thing. Seeing first-hand how a real problem affects users helps you clarify the issue more than a wordy message does, and also builds empathy and motivates your team to prioritize UX in future updates.
If you’re using Hotjar Recordings, click to create a ‘highlight’ from part of any recording, add it to a collection, tag it with an icon (the ladybug is for bugs!), and add a comment for context.
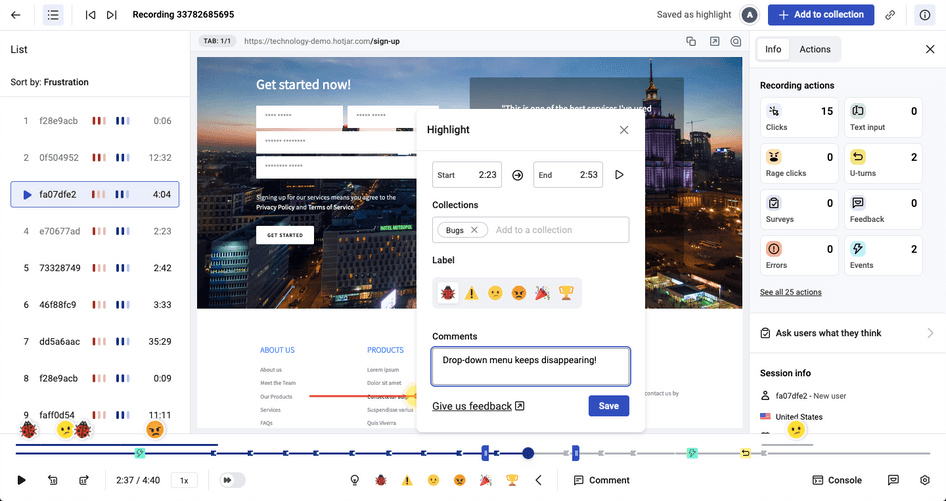
Creating a new bug highlight (or lowlight) in Hotjar Recordings
🎥 See it in action: digital signage company Marlin used Hotjar Recordings to fix product bugs. When the team received a support ticket, they used Hotjar to find that user's session with their consent, watch it, log the bug, and attach the recording to the ticket. This saved hours of work since they didn’t have to recreate the problem themselves.
Share errors with your team
Sharing bugs and website errors with your team has two benefits:
It makes it easier (and quicker) for people to fix a bug by seeing it in action
It helps everyone on the team build user empathy and better customer experiences into future updates
If you’re using Hotjar, review your bug recording collection in Hotjar Highlights and share a link with your team.
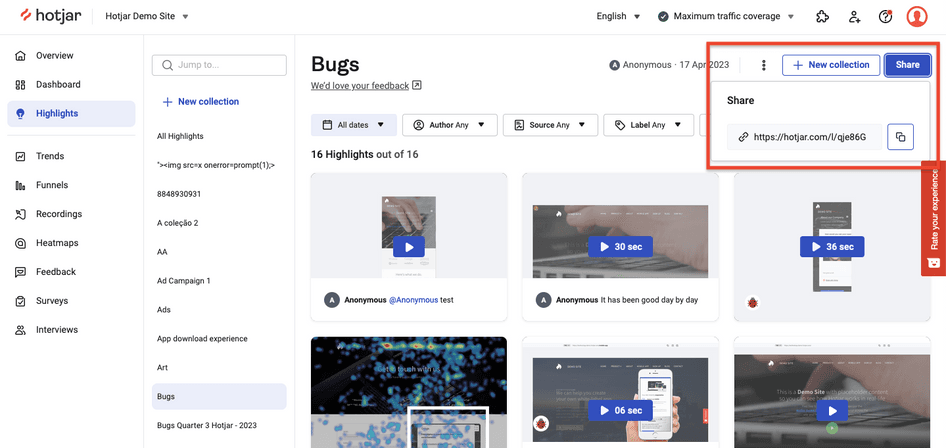
View and share bug recordings in Hotjar Highlights
You can also click to create a Jira issue from any error you find in a session recording or feedback response.
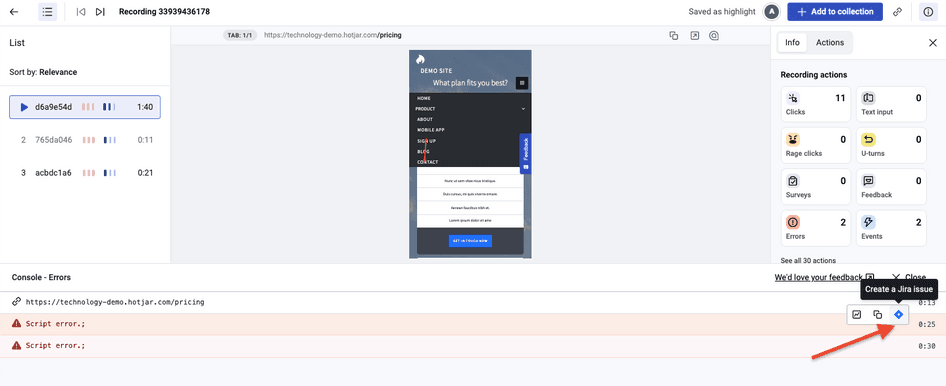
Click to create a Jira issue from any console error found in Hotjar Recordings
🎥 See it in action: rental platform Spotahome used Hotjar Recordings to detect and fix website bugs by holding regular ‘Watch Parties’ as a team. By having members of the customer, product, and dev teams on the call (and by sorting recordings by relevance), they were able to spot issues that would have been missed by individuals.
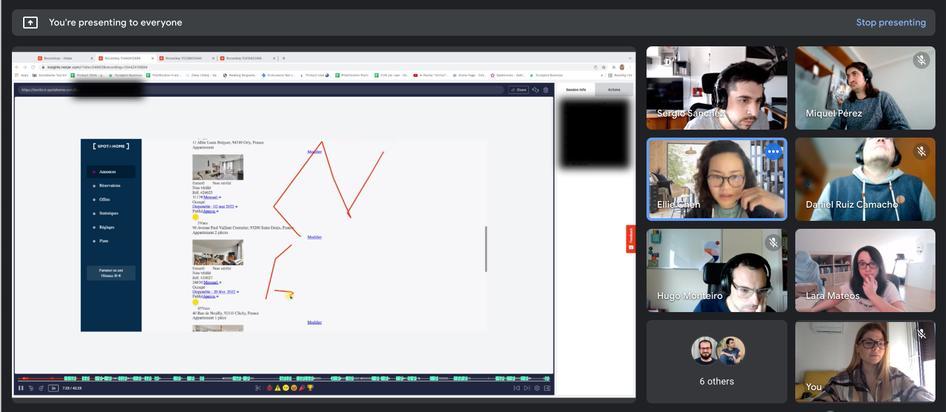
The Spotahome team reviewing website errors together using Hotjar Recordings
Fewer errors, happier customers
Whatever your marketing goals are, your efforts will be helped by reducing the number of bugs, errors, and downright confusing elements across your website. One of the simplest, no-code ways to do this is to bake behavior analytics into your marketing workflow and get into the habit of testing designs before launch, monitoring for bugs year-round, and looping in your team to prioritize the fixes you know will make a difference.
And you can achieve all that with the different tools in Hotjar—start for free and scale as you grow.
Find website issues fast with Hotjar
Use Hotjar’s tools to see exactly what needs fixing today, monitor for errors, and deliver better experiences for your customers
